List of indoor arenas in the United States
This is a list of indoor arenas in the United States.
List of largest municipal arenas in the United States by seating capacity
This is a list of seating capacities for sports and entertainment arenas in the United States with at least 3,000 seats. The list is composed mostly of arenas that house sports teams (basketball, ice hockey and arena football) and serve as indoor venues for concerts and expositions. The arenas in this table are ranked by maximum capacity. College venues that also host pro teams (such as the Thomas & Mack Center and the Cajundome) are included. Domed stadiums (such as the Superdome in New Orleans and the Georgia Dome in Atlanta) are excluded from this list.
- Rows shaded in yellow indicates arena is permanent home to an NBA (National Basketball Association) and/or NHL (National Hockey League) franchise.
.jpg)


Future
| Venue | Location | Professional teams | Notes |
|---|---|---|---|
| Chase Center | San Francisco | Golden State Warriors (NBA) | opening in 2017 |
| Wintrust Arena at McCormick Square | Chicago | DePaul Blue Demons (NCAA) | to be completed in 2017 |
Historic
Note: "Historic" denotes either demolished, not in practical use or unused.
- Amway Arena – Orlando, Florida
- ARCO Arena (First) – Sacramento, California
- Bayfront Arena – St. Petersburg, Florida
- Boston Garden – Boston
- Britt Brown Arena at Kansas Coliseum – Valley Center, Kansas
- Buffalo Memorial Auditorium – Buffalo, New York
- Capital Centre – Landover, Maryland (also known as USAir Arena and US Airways Arena during its existence)
- Charlotte Coliseum – Charlotte, North Carolina
- Chicago Coliseum – Chicago
- Chicago Stadium – Chicago
- Civic Arena – Pittsburgh (also known as Mellon Arena)
- Cleveland Arena – Cleveland, Ohio
- Coconut Grove Convention Center – Miami (formerly known as the Dinner Key Auditorium)
- Coliseum at Richfield – Richfield, Ohio
- Compaq Center – Houston, Texas (formerly known as The Summit; now the main worship center for Lakewood Church)
- Curtis Hixon Hall – Tampa, Florida
- Denver Coliseum – Denver, Colorado
- Duquesne Gardens – Pittsburgh
- The Forum – Inglewood, California
- Hara Arena – Trotwood, Ohio
- HemisFair Arena – San Antonio, Texas
- Hollywood Sportatorium – Pembroke Pines, Florida
- International Amphitheatre – Chicago
- Island Garden – West Hempstead, New York (original arena demolished in 1973)
- Jacksonville Memorial Coliseum – Jacksonville, Florida
- Kiel Auditorium – St. Louis, Missouri (Scottrade Center stands on the site)
- Kingdome – Seattle
- Long Island Arena – Commack, New York
- Los Angeles Memorial Sports Arena – Los Angeles
- Madison Square Garden (second) – New York (built on the site of the first Madison Square Garden; the New York Life Building now stands on the site)
- Madison Square Garden (third) – New York (demolished in 1968; used as a parking lot until One Worldwide Plaza was built on the site in 1989)
- Note: The first Madison Square Garden was not an indoor arena. Although used for many sports, it had no roof.
- Market Square Arena – Indianapolis
- McNichols Sports Arena – Denver, Colorado
- Metropolitan Sports Center – Bloomington, Minnesota
- Mid-South Coliseum – Memphis, Tennessee
- Minneapolis Auditorium – Minneapolis
- Motor Square Garden – Pittsburgh
- Municipal Auditorium – New Orleans
- New Haven Veterans Memorial Coliseum – New Haven, Connecticut
- Olympia Stadium – Detroit
- Omni Coliseum – Atlanta (Philips Arena now stands on the site)
- Philadelphia Arena – Philadelphia
- Philadelphia Civic Center – Philadelphia
- Philadelphia Convention Hall – Philadelphia
- Pyramid Arena – Memphis, Tennessee (now a Bass Pro Shops megastore)
- San Diego Sports Arena – San Diego, California
- San Francisco Civic Auditorium – San Francisco
- St. Louis Arena – St. Louis, Missouri (also known as the Checkerdome)
- St. Paul Civic Center – Saint Paul, Minnesota
- Salt Palace – Salt Lake City
- Sam Houston Coliseum – Houston, Texas
- The Spectrum – Philadelphia (also known as CoreStates Spectrum, First Union Spectrum and Wachovia Spectrum)
- Teaneck Armory – Teaneck, New Jersey
- War Memorial Gymnasium – San Francisco
- Washington Coliseum – Washington, D.C. (formerly Uline Arena)
List of largest college sports arenas in the United States by seating capacity
This list includes indoor arenas which serve as home to college sports teams. Arenas which are shared by both pro and college teams, such as Verizon Center, Madison Square Garden and the Cajundome, appear in both this table and the list of municipal arenas. Domed stadiums are excluded from this list, with the exception of those which can be configured to serve as the home of major college basketball programs (i.e. the Carrier Dome).


.jpg)


_-_1.JPG)


Major college indoor arenas
All facilities are on-campus unless otherwise noted.
A-L
- Agganis Arena – Boston University, Boston
- Alaska Airlines Arena at Hec Edmundson Pavilion – University of Washington, Seattle (formerly sponsored by Bank of America)
- Alex G. Spanos Center – University of the Pacific, Stockton, California
- Alfond Arena – University of Maine, Orono, Maine
- Allen Arena – Lipscomb University, Nashville, Tennessee
- Allen Fieldhouse – University of Kansas, Lawrence, Kansas
- Allstate Arena – DePaul University, Rosemont, Illinois (off campus) (formerly the Rosemont Horizon)
- Alumni Arena – Armstrong Atlantic State University, Savannah, Georgia
- Alumni Arena – University at Buffalo, Buffalo, New York
- Alumni Hall – DePaul University, Chicago
- Alumni Hall – St. John's University, Jamaica, New York
- Alumni Hall – United States Naval Academy, Annapolis, Maryland
- Anderson Arena – Bowling Green State University, Bowling Green, Ohio (closed after 2010–11 season)
- Arena-Auditorium – University of Wyoming, Laramie, Wyoming
- Assembly Hall – Indiana University, Bloomington, Indiana
- Auburn Arena – Auburn University, Auburn, Alabama
- BankUnited Center – University of Miami, Coral Gables, Florida (formerly University of Miami Convocation Center)
- Barnhill Arena – University of Arkansas, Fayetteville, Arkansas
- Bartow Arena – University of Alabama at Birmingham, Birmingham, Alabama
- Baxter Arena – University of Nebraska Omaha, Omaha, Nebraska
- BB&T Arena – Northern Kentucky University, Highland Heights, Kentucky (originally The Bank of Kentucky Center)
- Beard-Eaves-Memorial Coliseum – Auburn University, Auburn, Alabama (closed after 2009–10 season)
- Beasley Coliseum – Washington State University, Pullman, Washington (formerly Friel Court, which is still the name of the playing surface)
- Bender Arena – American University, Washington, D.C.
- Bernard G. Johnson Coliseum – Sam Houston State University, Huntsville, Texas
- Berry Events Center – Northern Michigan University, Marquette, Michigan
- BGSU Ice Arena – Bowling Green State University, Bowling Green, Ohio
- Bob Devaney Sports Center – University of Nebraska, Lincoln, Nebraska
- Bradley Athletics Performance Center – Bradley University (women), Peoria, Illinois
- Bradley Center – Marquette University, Milwaukee (off campus)
- Bramlage Coliseum – Kansas State University, Manhattan, Kansas
- Bren Events Center – University of California, Irvine, Irvine, California
- Breslin Student Events Center – Michigan State University, East Lansing, Michigan
- Bright Hockey Center – Harvard University, Cambridge, Massachusetts
- Brownwood Coliseum – Howard Payne University, Brownwood, Texas
- Bryce Jordan Center – Penn State, State College, Pennsylvania
- Bud Walton Arena – University of Arkansas, Fayetteville, Arkansas
- Burns Arena – Dixie State College of Utah, St. George, Utah
- Burton Coliseum – McNeese State University, Lake Charles, Louisiana (operated by university, but off the main campus)
- Cajundome – University of Louisiana at Lafayette, Lafayette, Louisiana (on university-owned land, but off the main campus)
- Cameron Indoor Stadium – Duke University, Durham, North Carolina
- Carmichael Arena – University of North Carolina (women), Chapel Hill, North Carolina
- Carnesecca Arena – see Alumni Hall – St. John's University
- Carolina Coliseum – University of South Carolina, Columbia, South Carolina
- Carrier Dome – Syracuse University, Syracuse, New York
- Carver Arena – Bradley University (men), Peoria, Illinois (off campus)
- Carver–Hawkeye Arena – University of Iowa, Iowa City, Iowa
- Cassell Coliseum – Virginia Tech, Blacksburg, Virginia
- CenturyLink Center Omaha – Creighton University, Omaha, Nebraska (off campus; originally Qwest Center Omaha)
- CFE Arena – University of Central Florida, Orlando, Florida
- CFSB Center – Murray State University, Murray, Kentucky (originally Regional Special Events Center)
- Chaifetz Arena – Saint Louis University, St. Louis, Missouri
- Charles Koch Arena – Wichita State University, Wichita, Kansas
- Chiles Center – University of Portland, Portland, Oregon
- Christl Arena – United States Military Academy, West Point, New York
- Cintas Center – Xavier University, Cincinnati, Ohio
- Clune Arena – United States Air Force Academy, Colorado Springs, Colorado
- CMSU Multipurpose Building – University of Central Missouri, Warrensburg, Missouri
- Coleman Coliseum – University of Alabama (men), Tuscaloosa, Alabama
- College Park Center – University of Texas at Arlington, Arlington, Texas
- Colonial Life Arena – University of South Carolina, Columbia, South Carolina (formerly Carolina Center and Colonial Center)
- The Complex – Valdosta State University, Valdosta, Georgia
- Conte Forum – Boston College, Newton, Massachusetts
- Convocation Center – Arkansas State University, Jonesboro, Arkansas
- Convocation Center – Eastern Michigan University, Ypsilanti, Michigan
- Convocation Center – Northern Illinois University, DeKalb, Illinois
- Convocation Center – Ohio University, Athens, Ohio
- Convocation Center – University of Texas at San Antonio, San Antonio
- Coors Events Center – University of Colorado, Boulder, Colorado
- Cowan Spectrum – University of Idaho, Moscow, Idaho
- Crisler Center – University of Michigan, Ann Arbor, Michigan
- Curb Event Center – Belmont University, Nashville, Tennessee
- Dean Smith Center – University of North Carolina (men), Chapel Hill, North Carolina
- Dee Events Center – Weber State University, Ogden, Utah
- Don Haskins Center – University of Texas at El Paso, El Paso, Texas
- Dunkin' Donuts Center – Providence College, Providence, Rhode Island (off campus) (formerly Providence Civic Center)
- E.A. Diddle Arena – Western Kentucky University, Bowling Green, Kentucky
- Eblen Center – Tennessee Technological University, Cookeville, Tennessee
- Ervin J. Nutter Center – Wright State University, Fairborn, Ohio
- The Event Center Arena – San Jose State University, San Jose, California
- Events Center – Binghamton University, Binghamton, New York
- Farris Center – University of Central Arkansas, Conway, Arkansas
- FedExForum – University of Memphis, Memphis, Tennessee (off campus)
- Ferrell Center – Baylor University, Waco, Texas
- Fifth Third Arena – University of Cincinnati, Cincinnati (formerly Myrl Shoemaker Center, which is still the name of the building that contains the arena)
- First United Bank Center – West Texas A&M University, Canyon, Texas
- Forbes Arena – Morehouse College, Atlanta
- Ford Center – University of Evansville, Evansville, Indiana (off campus)
- Foster Auditorium – University of Alabama (women), Tuscaloosa, Alabama
- Frank Erwin Center – University of Texas, Austin, Texas
- Freedom Hall – University of Louisville, Louisville, Kentucky (off campus; U of L left after the 2009–10 season)
- Galen Center – University of Southern California, Los Angeles
- Gallagher-Iba Arena – Oklahoma State University, Stillwater, Oklahoma
- Gampel Pavilion – University of Connecticut, Storrs, Connecticut
- Gentry Complex – Tennessee State University, Nashville, Tennessee
- Gerald Stockton Court – Midwestern State University, Wichita Falls, Texas
- Gill Coliseum – Oregon State University, Corvallis, Oregon
- Goggin Ice Center – Miami University, Oxford, Ohio
- Gross Memorial Coliseum – Fort Hays State University, Hays, Kansas
- Haas Pavilion – University of California, Berkeley, California
- Hagan Arena – Saint Joseph's University, Philadelphia
- Halenbeck Hall – St. Cloud State University, St. Cloud, Minnesota
- Halton Arena – University of North Carolina at Charlotte, Charlotte, North Carolina
- Hank McCamish Pavilion – Georgia Tech, Atlanta
- Health and Physical Education Complex – Fort Valley State University, Fort Valley, Georgia
- Health and Sports Center – University of Nebraska at Kearney, Kearney, Nebraska
- Hearnes Center – University of Missouri, Columbia, Missouri
- Hilton Coliseum – Iowa State University, Ames, Iowa
- Hinkle Fieldhouse – Butler University, Indianapolis
- Hofheinz Pavilion – University of Houston, Houston
- Holt Arena – Idaho State University, Pocatello, Idaho
- Hulman Center – Indiana State University, Terre Haute, Indiana
- Humphrey Coliseum – Mississippi State University, Starkville, Mississippi
- Intercollegiate Athletic Arena – Rhode Island College, Providence, Rhode Island
- Izod Center – Fordham University, East Rutherford, New Jersey (secondary home; off campus) (formerly Brendan Byrne Arena and Continental Airlines Arena)
- Jack Stephens Center – University of Arkansas at Little Rock, Little Rock, Arkansas
- Jadwin Gymnasium – Princeton University, Princeton, New Jersey
- James A. Rhodes Arena – University of Akron, Akron, Ohio
- James Center Arena – Tuskegee University, Tuskegee, Alabama
- Joe L. Reed Acadome – Alabama State University, Montgomery, Alabama
- John E. Worthen Arena – Ball State University, Muncie, Indiana
- John Lance Arena – Pittsburg State University, Pittsburg, Kansas
- John MacInnes Ice Arena – Michigan Technological University, Houghton, Michigan
- John Paul Jones Arena – University of Virginia, Charlottesville, Virginia
- Jon M. Huntsman Center – University of Utah, Salt Lake City
- Joseph J. Gentile Center – Loyola University Chicago, Chicago
- Joyce Center – University of Notre Dame, South Bend, Indiana
- JQH Arena – Missouri State University, Springfield, Missouri
- Kemper Arena – University of Missouri–Kansas City, Kansas City, Missouri (off campus)
- KFC Yum! Center – University of Louisville, Louisville, Kentucky (off campus)
- Knott Arena – Mount St. Mary's University, Emmitsburg, Maryland
- Kohl Center – University of Wisconsin, Madison, Wisconsin
- Kolf Sports Center – University of Wisconsin–Oshkosh, Oshkosh, Wisconsin
- Kress Events Center – University of Wisconsin–Green Bay (women), Green Bay, Wisconsin
- Lakefront Arena – University of New Orleans, New Orleans
- Lavietes Pavilion – Harvard University, Cambridge, Massachusetts
- Lawlor Events Center – University of Nevada, Reno, Reno, Nevada
- Lawrence Joel Veterans Memorial Coliseum – Wake Forest University, Winston-Salem, North Carolina (off campus)
- Lawson Arena – Western Michigan University, Kalamazoo, Michigan
- Leede Arena – Dartmouth College, Hanover, New Hampshire
- Levian Gymnasium – Columbia University – New York
- Liacouras Center – Temple University, Philadelphia (formerly The Apollo of Temple)
- Littlejohn Coliseum – Clemson University, Clemson, South Carolina
- Lloyd Noble Center – University of Oklahoma, Norman, Oklahoma
- Louis Brown Athletic Center – Rutgers University, Piscataway, New Jersey
- Lynah Rink – Cornell University, Ithaca, New York
M-Z
- Mabee Center – Oral Roberts University, Tulsa, Oklahoma
- Mackey Arena – Purdue University, West Lafayette, Indiana
- Magness Arena – University of Denver, Denver, Colorado
- Maples Pavilion – Stanford University, Palo Alto, California
- Mariucci Arena – University of Minnesota, Minneapolis
- Marriott Center – Brigham Young University, Provo, Utah
- Massari Gym – Colorado State University-Pueblo, Pueblo, Colorado
- Matthew Knight Arena – University of Oregon, Eugene, Oregon (opened January 2011)
- Matthews Arena – Northeastern University, Boston
- McArthur Court – University of Oregon, Eugene, Oregon (closed January 2011)
- McCarthey Athletic Center – Gonzaga University, Spokane, Washington
- McDermott Convocation Center – University of the Incarnate Word, San Antonio, Texas
- McGuirk Arena – Central Michigan University, Mount Pleasant, Michigan
- McKale Center – University of Arizona, Tucson, Arizona
- McKenzie Arena – University of Tennessee at Chattanooga, Chattanooga, Tennessee (aka "The Roundhouse")
- Memorial Athletic and Convocation Center – Kent State University, Kent, Ohio
- Memorial Center – East Tennessee State University, Johnson City, Tennessee
- Memorial Coliseum – University of Kentucky (women), Lexington, Kentucky
- Memorial Gymnasium – Vanderbilt University, Nashville, Tennessee
- Michigan State Fairgrounds Coliseum – Wayne State University, Detroit, Michigan
- Midwest Wireless Civic Center – Minnesota State University, Mankato, Mankato, Minnesota
- Millett Hall – Miami University, Oxford, Ohio
- Mitchell Center – University of South Alabama, Mobile, Alabama
- Mizzou Arena – University of Missouri, Columbia, Missouri (formerly Paige Sports Arena)
- Moby Arena – Colorado State University, Fort Collins, Colorado
- Montagne Center – Lamar University, Beaumont, Texas
- Moody Coliseum – Abilene Christian University, Abilene, Texas
- Moody Coliseum – Southern Methodist University, University Park, Texas
- Mullins Center – University of Massachusetts Amherst, Amherst, Massachusetts
- Munn Ice Arena – Michigan State University, East Lansing, Michigan
- Murphy Center – Middle Tennessee State University, Murfreesboro, Tennessee
- National Hockey Center – St. Cloud State University, St. Cloud, Minnesota
- Newman Arena – Cornell University, Ithaca, New York
- Oklahoma State Fair Arena – Oklahoma City University, Oklahoma City, Oklahoma (off campus)
- Owensboro Sports Center – Kentucky Wesleyan College, Owensboro, Kentucky
- Palestra – University of Pennsylvania, Philadelphia
- Pan American Center – New Mexico State University, Las Cruces, New Mexico
- Patrick Gym – University of Vermont, Burlington, Vermont
- Patriot Center – George Mason University, Fairfax, Virginia
- Pauley Pavilion – UCLA, Los Angeles
- The Pavilion – Villanova University, Villanova, Pennsylvania
- The Pavilion at Ole Miss – University of Mississippi, Oxford, Mississippi (opened in January 2016)
- Payne Whitney Gym – Yale University, New Haven, Connecticut
- Pete Maravich Assembly Center – Louisiana State University, Baton Rouge, Louisiana
- Peter W. Stott Center – Portland State University, Portland, Oregon
- Petersen Events Center – University of Pittsburgh, Pittsburgh, Pennsylvania
- Pharmed Arena – Florida International University, Miami
- Pioneer Gym – California State University, East Bay, Hayward, California
- Pizzitola Sports Center – Brown University, Providence, Rhode Island
- PNC Arena – North Carolina State University (men), Raleigh, North Carolina (off campus) (formerly Raleigh Entertainment & Sports Arena and RBC Center)
- Prather Coliseum – Northwestern State University, Natchitoches, Louisiana
- Prudential Center – Seton Hall University (men), Newark, New Jersey (off campus)
- R.L. Vaughn Center – Elizabeth City State University, Elizabeth City, North Carolina
- Rabobank Arena – California State University, Bakersfield, Bakersfield, California (off campus)
- Ralph Engelstad Arena – University of North Dakota, Grand Forks, North Dakota
- Redbird Arena – Illinois State University, Normal, Illinois
- Reed Arena – Texas A&M University, College Station, Texas
- Resch Center – University of Wisconsin–Green Bay (men), Green Bay, Wisconsin
- Reynolds Center – University of Tulsa, Tulsa, Oklahoma
- Reynolds Coliseum – North Carolina State University (women), Raleigh, North Carolina
- Robertson Stadium – University of Houston, Houston, Texas
- Ronald B. Stafford Ice Arena – Plattsburgh State University, Plattsburgh, New York
- Rupp Arena – University of Kentucky (men), Lexington, Kentucky (off campus)
- Ryan Center – University of Rhode Island, Kingston, Rhode Island
- Save Mart Center – Fresno State, Fresno, California
- Schollmaier Arena – Texas Christian University, Fort Worth, Texas (formerly Daniel–Meyer Coliseum)
- Sharp Gymnasium – Houston Baptist University, Houston, Texas
- Show Me Center – Southeast Missouri State University, Cape Girardeau, Missouri
- SIU Arena – Southern Illinois University, Carbondale, Illinois
- Smith Center – George Washington University, Washington, D.C.
- Smith Fieldhouse – Brigham Young University, Provo, Utah
- Smith Spectrum – Utah State University, Logan, Utah
- Stan Sheriff Center – University of Hawaiʻi, Honolulu, Hawaii
- State Farm Center – University of Illinois, Champaign, Illinois
- Stegeman Coliseum – University of Georgia, Athens, Georgia
- Stephen C. O'Connell Center – University of Florida, Gainesville, Florida
- Stephens Arena – Angelo State University, San Angelo, Texas
- Stony Brook Sports Complex – Stony Brook University, Stony Brook, New York
- Stopher Gym – Nicholls State University, Thibodaux, Louisiana
- Strahan Coliseum – Texas State University–San Marcos, San Marcos, Texas
- Stroh Center – Bowling Green State University, Bowling Green, Ohio
- Stuart C. Siegel Center – Virginia Commonwealth University – Richmond, Virginia
- Sun Dome – University of South Florida, Tampa, Florida
- Taco Bell Arena – Boise State University, Boise, Idaho (formerly the BSU Pavilion)
- Tad Smith Coliseum – University of Mississippi, Oxford, Mississippi (closed during 2015–16 season)
- Taffy Abel Arena – Lake Superior State University, Sault Ste. Marie, Michigan
- Tallahassee-Leon County Civic Center – Florida State University, Tallahassee, Florida (off campus)
- Taylor Center – Minnesota State University, Mankato, Minnesota
- Ted Constant Convocation Center – Old Dominion University, Norfolk, Virginia
- Texas A&M-Commerce Field House – Texas A&M University–Commerce, Commerce, Texas
- Thomas & Mack Center – UNLV, Paradise, Nevada
- Thomas J. Frericks Center – University of Dayton, Dayton, Ohio
- Thompson Arena – Dartmouth College, Hanover, New Hampshire
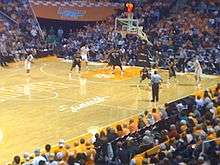
- Thompson–Boling Arena – University of Tennessee, Knoxville, Tennessee
- Times Union Center – Siena College, Albany, New York (off campus) (formerly Knickerbocker Arena and Pepsi Arena)
- Towson Center – Towson University, Towson, Maryland
- Turner Arena – Lincoln Memorial University, Harrogate, Tennessee
- UCSB Events Center – University of California, Santa Barbara, Santa Barbara, California (commonly known as the Thunderdome)
- UIC Pavilion – University of Illinois at Chicago, Chicago
- UNI-Dome – University of Northern Iowa, Cedar Falls, Iowa
- United Supermarkets Arena – Texas Tech University, Lubbock, Texas (originally United Spirit Arena)
- University Arena – Western Michigan University, Kalamazoo, Michigan
- University Center – Southeastern Louisiana University, Hammond, Louisiana
- University Hall – University of Virginia, Charlottesville, Virginia
- University of Dayton Arena – University of Dayton, Dayton, Ohio
- UNT Coliseum – University of North Texas, Denton, Texas
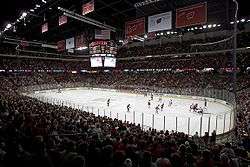
- Value City Arena – Ohio State University, Columbus, Ohio (aka Schottenstein Center, which is the official name of the building that contains the arena)
- Verizon Center – Georgetown University, Washington, D. C. (off-campus) (formerly the MCI Center)
- Viejas Arena – San Diego State University, San Diego (originally Cox Arena)
- Wachs Arena – Northern State University, Aberdeen, South Dakota
- Walter Pyramid – California State University, Long Beach, Long Beach, California (formerly known as the Long Beach Pyramid)
- Wells Fargo Arena – Arizona State University, Tempe, Arizona
- Welsh-Ryan Arena – Northwestern University, Evanston, Illinois
- Wesley Brown Field House – United States Naval Academy, Annapolis, Maryland
- Whittemore Center Arena, University of New Hampshire, Durham, New Hampshire
- William R. Johnson Coliseum – Stephen F. Austin State University, Nacogdoches, Texas
- Williams Arena – University of Minnesota, Minneapolis
- Wilson Complex – New Mexico Highlands University, Las Vegas, New Mexico
- WisePies Arena (aka The Pit) – University of New Mexico, Albuquerque, New Mexico – originally University Arena, but popularly known as "The Pit" before being officially named as such in 2009; received current corporate name in 2014
- Wolstein Center – Cleveland State University, Cleveland, Ohio (formerly CSU Convocation Center)
- World Arena – Colorado College, Colorado Springs, Colorado
- Worthen Arena – Ball State University, Muncie, Indiana
- WVU Coliseum – West Virginia University, Morgantown, West Virginia
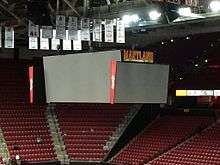
- XFINITY Center – University of Maryland, College Park, Maryland
- XL Center – University of Connecticut, Hartford, Connecticut (off campus)
- Yost Ice Arena – University of Michigan, Ann Arbor, Michigan
See also
| Wikimedia Commons has media related to Indoor arenas in the United States. |