Northern America
.svg.png) | |
| Area | 21,780,142 km2 (8,409,360 sq mi) |
|---|---|
| Population (2015) | 357,838,000 |
| States | |
| Dependencies | |
| GDP |
$18.6 trillion (PPP, 2013 est.) |
| Major languages | English, French, Danish, Spanish, Greenlandic, and various recognised regional languages |
| Timezone |
UTC (Danmarkshavn, Greenland) to UTC -10:00 (west Aleutians) |
| Largest urban agglomerations |
|
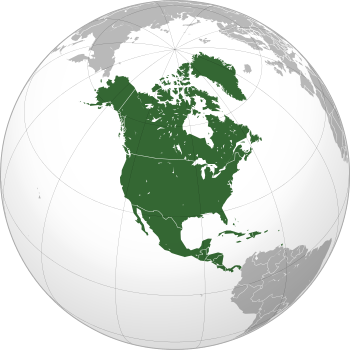
Northern America is the northernmost subcontinent of the North America. It lies directly north of the region of Middle America,[1] containing the Caribbean and Central America subcontinents. The land border between the two regions coincides with the border between the United States and Mexico. Geopolitically, according to the scheme of geographic regions and subregions, Northern America consists of[2][3] Bermuda, Canada, Greenland, Saint-Pierre and Miquelon, and the United States.
Definitions
Maps using the term Northern America date back to 1755, when the region was occupied by France, Great Britain, and Spain.[4] The Solemn Act of the Declaration of Independence of Northern America in 1813 applied to Mexico. Today, Northern America includes the Canada–US dyad, developed countries that exhibit very high Human Development Indexes and intense economic integration while sharing many socioeconomic characteristics.[5]
Countries and dependent territories
| Country or territory | Area (km²)[6] |
Population | Population density (per km²) |
Capital |
|---|---|---|---|---|
| |
53.2 | 64,237 | 1,275 | Hamilton |
| |
9,984,670 | 35,540,419 | 3.4 | Ottawa |
| |
2,166,086 | 56,370 | 0.026 | Nuuk |
| |
242 | 6,080 | 25 | Saint-Pierre |
| |
9,826,675 | 319,406,000 | 32.7 | Washington, D.C. |
Demographics
| Year | Population of Northern America | %± | Canada population, % of Northern America | U.S. population, % of Northern America | ||
|---|---|---|---|---|---|---|
| 1950 | 171,615,000 | — | 13,737,000 | 8.0% | 157,813,000 | 92.0% |
| 1960 | 204,167,000 | +19.0% | 17,909,000 | 8.8% | 186,177,000 | 91.2% |
| 1970 | 231,029,000 | +13.2% | 21,439,000 | 9.3% | 209,486,000 | 90.7% |
| 1980 | 254,217,000 | +10.0% | 24,516,000 | 9.6% | 229,588,000 | 90.3% |
| 1990 | 280,633,000 | +10.4% | 27,662,000 | 9.9% | 252,848,000 | 90.1% |
| 2000 | 313,724,000 | +11.8% | 30,702,000 | 9.8% | 282,896,000 | 90.2% |
| 2010 | 344,129,000 | +9.7% | 34,126,000 | 9.9% | 309,876,000 | 90.0% |
| 2015 | 357,838,000 | +4.0% | 35,940,000 | 10.0% | 321,774,000 | 89.9% |
See also
| Wikimedia Commons has media related to Northern America. |
References
- ↑ Gonzalez, Joseph. 2004. "Northern America: Land of Opportunity" (ch. 6). The Complete Idiot's Guide to Geography. (ISBN 1592571883) New York: Alpha Books; pp. 57-8
- ↑ Definition of major areas and regions, from World Migrant Stock: The 2005 Revision Population Database, United Nations Population Division. Accessed on line October 3, 2007.
- ↑ Composition of macro geographical (continental) regions, geographical sub-regions, and selected economic and other groupings, UN Statistics Division. Accessed on line October 3, 2007. (French)
- ↑ Bellin, Jacques-Nicolas. 1755. Carte de l'Amerique septentrionale (Map of Northern America). Item NMC 21057: Library and Archives Canada.
- ↑ Torrey, Barbara Boyle & Eberstadt, Nicholas. 2005 (Aug./Sep.). "The Northern America Fertility Divide." Hoover Institution Policy Review. No. 132.
- ↑ Unless otherwise noted, land area figures are taken from "Demographic Yearbook—Table 3: Population by sex, rate of population increase, surface area and density" (PDF). United Nations Statistics Division. 2008. Retrieved 2010-10-14.
- ↑ Includes the U.S. state of Hawaii, which is distant from the North American landmass in the Pacific Ocean and therefore more commonly associated with the other territories of Oceania.
Continents of the world | ||||||
|---|---|---|---|---|---|---|
| ||||||
.svg.png)
.svg.png)
.svg.png)
.svg.png)
.svg.png)
.svg.png)
.svg.png)
.svg.png)
.svg.png)