Woking Borough Council election, 2008
The 2008 Woking Council election took place on 1 May 2008 to elect members of Woking Borough Council in Surrey, England. One third of the council was up for election and the Conservative party stayed in overall control of the council.[1]
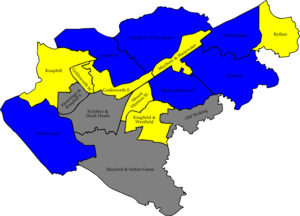
After the election, the composition of the council was
Background
13 seats were contested in the election with 42 candidates from the Conservatives, Liberal Democrats, Labour and United Kingdom Independence Party (UKIP).[3] Labour only put forward 6 candidates, while UKIP had candidates in every ward for the first time.[4] Since the 2007 election the Conservatives had held a majority on the council after a long period with no party holding a majority.[5]
Election result
The results saw the Conservatives maintain their majority on the council with 19 seats compared to 17 for the Liberal Democrats.[4] Seven new councillors were elected after five sitting councillors stood down and 2 Liberal Democrats lost in the election.[4] The Conservatives gained seats from the Liberal Democrats in Brookwood and Horsell West, while the Liberal Democrats won seats back in Knaphill and Maybury and Sheerwater.[4] Overall turnout in the election at 43.46%,[6] was almost the same as the 43.6% seen in 2007.[4]
| Woking Local Election Result 2008[6][7] | ||||||||||
|---|---|---|---|---|---|---|---|---|---|---|
| Party | Seats | Gains | Losses | Net gain/loss | Seats % | Votes % | Votes | +/− | ||
| Liberal Democrat | 7 | 2 | 2 | 0 | 53.8 | 44.1 | 11,230 | +8.7% | ||
| Conservative | 6 | 2 | 2 | 0 | 46.2 | 46.7 | 11,885 | -4.2% | ||
| Labour | 0 | 0 | 0 | 0 | 0 | 4.6 | 1,178 | -4.1% | ||
| UKIP | 0 | 0 | 0 | 0 | 0 | 4.6 | 1,160 | +0.1% | ||
Ward results
| Party | Candidate | Votes | % | ± | |
|---|---|---|---|---|---|
| Conservative | Glynis Preshaw | 488 | 48.7 | +3.4 | |
| Liberal Democrat | Michael Peel | 477 | 47.6 | -1.7 | |
| UKIP | William March | 19 | 1.9 | +1.9 | |
| Labour | Richard Ford | 19 | 1.9 | -0.1 | |
| Majority | 11 | 1.1 | |||
| Turnout | 1,003 | 52.9 | -1.6 | ||
| Conservative gain from Liberal Democrat | Swing | ||||
| Party | Candidate | Votes | % | ± | |
|---|---|---|---|---|---|
| Liberal Democrat | Anne Roberts | 1,204 | 50.6 | +7.6 | |
| Conservative | Simon Farrant | 1,106 | 46.5 | -10.5 | |
| UKIP | Richard Squire | 68 | 2.9 | +2.9 | |
| Majority | 98 | 4.1 | |||
| Turnout | 2,378 | 44.1 | +0.1 | ||
| Liberal Democrat hold | Swing | ||||
| Party | Candidate | Votes | % | ± | |
|---|---|---|---|---|---|
| Liberal Democrat | Rosie Sharpley | 1,261 | 58.4 | +6.5 | |
| Conservative | David Roe | 654 | 30.3 | -7.1 | |
| UKIP | Robert Burberry | 126 | 5.8 | +2.5 | |
| Labour | John Scott-Morgan | 120 | 5.6 | -1.8 | |
| Majority | 607 | 28.1 | +13.6 | ||
| Turnout | 2,161 | 40.0 | -0.9 | ||
| Liberal Democrat hold | Swing | ||||
| Party | Candidate | Votes | % | ± | |
|---|---|---|---|---|---|
| Liberal Democrat | Ian Eastwood | 661 | 55.3 | -8.9 | |
| Conservative | Anthony Casey | 369 | 30.9 | +1.7 | |
| Labour | Paul Brown | 116 | 9.7 | +3.1 | |
| UKIP | Leo Dix | 50 | 4.2 | +4.2 | |
| Majority | 292 | 24.4 | -10.6 | ||
| Turnout | 1,196 | 31.3 | -1.6 | ||
| Liberal Democrat hold | Swing | ||||
| Party | Candidate | Votes | % | ± | |
|---|---|---|---|---|---|
| Conservative | Michael Smith | 1,100 | 70.3 | -0.8 | |
| Liberal Democrat | John Doran | 334 | 21.4 | +3.0 | |
| UKIP | Marion Free | 130 | 8.3 | +1.8 | |
| Majority | 766 | 48.9 | -3.8 | ||
| Turnout | 1,564 | 44.5 | -3.4 | ||
| Conservative hold | Swing | ||||
| Party | Candidate | Votes | % | ± | |
|---|---|---|---|---|---|
| Conservative | Anthony Branagan | 1,249 | 48.0 | -2.7 | |
| Liberal Democrat | Ann-Marie Barker | 1,153 | 44.3 | +4.5 | |
| UKIP | Timothy Shaw | 117 | 4.5 | +0.3 | |
| Labour | Audrey Worgan | 82 | 3.2 | -0.4 | |
| Majority | 96 | 3.7 | -7.2 | ||
| Turnout | 2,601 | 49.3 | -2.5 | ||
| Conservative gain from Liberal Democrat | Swing | ||||
| Party | Candidate | Votes | % | ± | |
|---|---|---|---|---|---|
| Liberal Democrat | Derek McCrum | 699 | 39.4 | +7.5 | |
| Conservative | Carl Thomson | 509 | 28.7 | -7.7 | |
| Labour | John Martin | 478 | 26.9 | +1.7 | |
| UKIP | Dennis Davey | 88 | 5.0 | -1.4 | |
| Majority | 190 | 10.7 | |||
| Turnout | 1,774 | 44.9 | +1.9 | ||
| Liberal Democrat hold | Swing | ||||
| Party | Candidate | Votes | % | ± | |
|---|---|---|---|---|---|
| Liberal Democrat | Oliver Wells | 1,380 | 49.8 | +7.3 | |
| Conservative | Beryl Dunham | 1,258 | 45.4 | +1.1 | |
| UKIP | Duncan Clarke | 131 | 4.7 | -3.1 | |
| Majority | 122 | 4.4 | |||
| Turnout | 2,769 | 39.5 | +2.3 | ||
| Liberal Democrat gain from Conservative | Swing | ||||
| Party | Candidate | Votes | % | ± | |
|---|---|---|---|---|---|
| Liberal Democrat | Mohammed Bashir | 1,551 | 49.1 | +14.9 | |
| Conservative | Rashid Mohammed | 1,104 | 35.0 | -3.8 | |
| Labour | Nicholas Trier | 363 | 11.5 | -10.4 | |
| UKIP | Marcia Taylor | 139 | 4.4 | +1.4 | |
| Majority | 447 | 14.1 | |||
| Turnout | 3,157 | 48.6 | +2.8 | ||
| Liberal Democrat gain from Conservative | Swing | ||||
| Party | Candidate | Votes | % | ± | |
|---|---|---|---|---|---|
| Conservative | David Bittleston | 942 | 54.3 | +10.1 | |
| Liberal Democrat | Philip Goldenberg | 736 | 42.4 | -6.0 | |
| UKIP | Judith Squire | 56 | 3.2 | -0.7 | |
| Majority | 206 | 11.9 | |||
| Turnout | 1,734 | 47.4 | -1.3 | ||
| Conservative hold | Swing | ||||
| Party | Candidate | Votes | % | ± | |
|---|---|---|---|---|---|
| Liberal Democrat | Ian Johnson | 965 | 61.0 | +4.3 | |
| Conservative | Valerian Hopkins | 568 | 35.9 | +0.7 | |
| UKIP | Mary Kingston | 48 | 3.0 | -1.5 | |
| Majority | 397 | 25.1 | +3.6 | ||
| Turnout | 1,581 | 37.9 | -5.4 | ||
| Liberal Democrat hold | Swing | ||||
| Party | Candidate | Votes | % | ± | |
|---|---|---|---|---|---|
| Conservative | Ashley Bowes | 1,379 | 70.5 | -5.8 | |
| Liberal Democrat | Andrew Grimshaw | 466 | 23.8 | +6.2 | |
| UKIP | Robin Milner | 112 | 5.7 | -0.5 | |
| Majority | 913 | 46.7 | -12.0 | ||
| Turnout | 1,957 | 39.2 | -12.2 | ||
| Conservative hold | Swing | ||||
| Party | Candidate | Votes | % | ± | |
|---|---|---|---|---|---|
| Conservative | Gary Elson | 1,159 | 73.4 | -3.8 | |
| Liberal Democrat | Michael Wilson | 343 | 21.7 | +8.1 | |
| UKIP | Graham Wood | 76 | 4.8 | +0.7 | |
| Majority | 816 | 51.7 | -11.9 | ||
| Turnout | 1,578 | 39.2 | -4.0 | ||
| Conservative hold | Swing | ||||
References
- ↑ "Woking". BBC News Online. 2008-04-19. Retrieved 2010-01-24.
- ↑ "Local elections: Results: Voters in the cities and the shires have their say in the ballot box". The Guardian. 2008-05-02. p. 7.
- ↑ "Election - Who's who in Surrey's 2008 elections". getsurrey. 2008-04-18. Retrieved 2010-01-24.
- 1 2 3 4 5 "New council faces despite the status quo". getsurrey. 2008-05-02. Retrieved 2010-01-24.
- ↑ "Election - Woking's main battlegrounds". getsurrey. 2008-04-24. Retrieved 2010-01-24.
- 1 2 3 4 5 6 7 8 9 10 11 12 13 14 15 "Election of Borough Councillors for the Wards of Woking Borough" (PDF). Woking Borough Council. Retrieved 2010-01-24.
- 1 2 3 4 5 6 7 8 9 10 11 12 13 14 "Local election results in Surrey". getsurrey. 2008-05-02. Retrieved 2010-01-24.
| Surrey County Council | |
|---|---|
| Elmbridge Borough Council | |
| Epsom and Ewell Borough Council | |
| Guildford Borough Council | |
| Mole Valley District Council | |
| Reigate and Banstead Borough Council | |
| Runnymede Borough Council | |
| Spelthorne Borough Council |
|
| Surrey Heath Borough Council | |
| Tandridge District Council | |
| Waverley Borough Council |
|
| Woking Borough Council | |