Tandridge District Council election, 2006
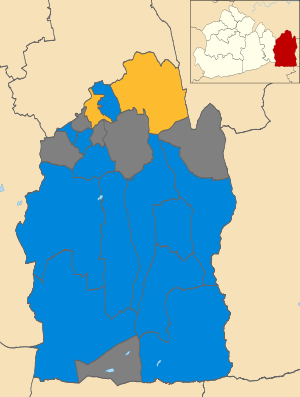
Map of the results of the 2006 Tandridge District Council election. Conservatives in blue and Liberal Democrats in yellow. Wards in grey were not contested in 2006.
The 2006 Tandridge District Council election took place on 4 May 2006 to elect members of Tandridge District Council in Surrey, England. One third of the council was up for election and the Conservative party stayed in overall control of the council.[1]
After the election, the composition of the council was
- Conservative 29
- Liberal Democrat 10
- Labour 2
- Independent 1[2]
Election result
Overall turnout at the election was 45.40%.[3]
| Tandridge local election result 2006[3][4] | ||||||||||
|---|---|---|---|---|---|---|---|---|---|---|
| Party | Seats | Gains | Losses | Net gain/loss | Seats % | Votes % | Votes | +/− | ||
| Conservative | 12 | 2 | 0 | +2 | 85.7 | 55.2 | 11,872 | +4.4% | ||
| Liberal Democrat | 2 | 0 | 1 | -1 | 14.3 | 34.1 | 7,332 | +1.9% | ||
| Labour | 0 | 0 | 0 | 0 | 0 | 5.4 | 1,163 | -2.8% | ||
| UKIP | 0 | 0 | 0 | 0 | 0 | 4.7 | 1,011 | -4.1% | ||
| Green | 0 | 0 | 0 | 0 | 0 | 0.6 | 124 | +0.6% | ||
| Independent | 0 | 0 | 1 | -1 | 0 | 0 | 0 | 0 | ||
Ward results
| Party | Candidate | Votes | % | ± | |
|---|---|---|---|---|---|
| Conservative | Antoun Elias | 1,103 | 63.8 | +3.9 | |
| Liberal Democrat | Richard Fowler | 318 | 18.4 | -3.0 | |
| UKIP | Graham Bailey | 203 | 11.7 | -0.1 | |
| Labour | David Wilbraham | 104 | 6.0 | -0.8 | |
| Majority | 785 | 45.4 | +6.9 | ||
| Turnout | 1,728 | 39.8 | -2.6 | ||
| Conservative gain from Independent | Swing | ||||
| Party | Candidate | Votes | % | ± | |
|---|---|---|---|---|---|
| Conservative | Alan Brown | 1,019 | 62.4 | +8.1 | |
| Liberal Democrat | Louise Martin | 392 | 24.0 | +0.7 | |
| UKIP | William Nock | 223 | 13.6 | -8.8 | |
| Majority | 627 | 38.4 | +7.4 | ||
| Turnout | 1,634 | 38.2 | -2.8 | ||
| Conservative hold | Swing | ||||
| Party | Candidate | Votes | % | ± | |
|---|---|---|---|---|---|
| Conservative | Michael Sydney | 774 | 68.9 | +8.6 | |
| Liberal Democrat | Anthony Hardisty | 349 | 31.1 | -8.6 | |
| Majority | 425 | 37.8 | +17.2 | ||
| Turnout | 1,123 | 39.3 | +3.2 | ||
| Conservative hold | Swing | ||||
| Party | Candidate | Votes | % | ± | |
|---|---|---|---|---|---|
| Conservative | Rosemary Thorn | 900 | 44.3 | -3.9 | |
| Liberal Democrat | Colin White | 844 | 41.6 | +11.1 | |
| UKIP | Richard Grant | 185 | 9.1 | -5.4 | |
| Labour | Maxine Mathews | 102 | 5.0 | -1.9 | |
| Majority | 56 | 2.7 | -15.0 | ||
| Turnout | 2,031 | 46.8 | +1.6 | ||
| Conservative gain from Liberal Democrat | Swing | ||||
| Party | Candidate | Votes | % | ± | |
|---|---|---|---|---|---|
| Conservative | Beverley Connolly | 845 | 65.8 | +4.3 | |
| Liberal Democrat | Anne Bell | 371 | 28.9 | -9.6 | |
| Labour | Christopher Brooks | 69 | 5.4 | +5.4 | |
| Majority | 474 | 36.9 | +13.9 | ||
| Turnout | 1,285 | 45.8 | -2.7 | ||
| Conservative hold | Swing | ||||
| Party | Candidate | Votes | % | ± | |
|---|---|---|---|---|---|
| Conservative | Eric Morgan | 894 | 65.2 | +5.0 | |
| Liberal Democrat | Mark Wilson | 478 | 34.8 | -0.6 | |
| Majority | 416 | 30.4 | +5.6 | ||
| Turnout | 1,372 | 49.7 | +8.1 | ||
| Conservative hold | Swing | ||||
| Party | Candidate | Votes | % | ± | |
|---|---|---|---|---|---|
| Conservative | Brian Perkins | 812 | 52.5 | +9.3 | |
| Liberal Democrat | Lisa Bangs | 735 | 47.5 | -5.4 | |
| Majority | 77 | 5.0 | |||
| Turnout | 1,547 | 51.8 | +0.2 | ||
| Conservative hold | Swing | ||||
| Party | Candidate | Votes | % | ± | |
|---|---|---|---|---|---|
| Conservative | David Weightman | 1,300 | 67.0 | +9.1 | |
| Liberal Democrat | Anne-Marie Bunting | 639 | 33.0 | +1.8 | |
| Majority | 661 | 34.0 | +7.3 | ||
| Turnout | 1,939 | 46.2 | -3.8 | ||
| Conservative hold | Swing | ||||
| Party | Candidate | Votes | % | ± | |
|---|---|---|---|---|---|
| Conservative | Barry Compton | 913 | 40.4 | +3.0 | |
| Labour | Barbara Harling | 791 | 35.0 | -0.7 | |
| Liberal Democrat | Ceri Lewis | 261 | 11.5 | -2.8 | |
| UKIP | Anthony Stone | 172 | 7.6 | -5.1 | |
| Green | Michaela O'Brien | 124 | 5.5 | +5.5 | |
| Majority | 122 | 5.4 | +3.7 | ||
| Turnout | 2,261 | 54.9 | -0.8 | ||
| Conservative hold | Swing | ||||
| Party | Candidate | Votes | % | ± | |
|---|---|---|---|---|---|
| Conservative | Matthew Groves | 784 | 51.7 | +4.7 | |
| Liberal Democrat | Lucy Darlow | 732 | 48.3 | -4.7 | |
| Majority | 52 | 3.4 | |||
| Turnout | 1,516 | 55.4 | -1.7 | ||
| Conservative hold | Swing | ||||
| Party | Candidate | Votes | % | ± | |
|---|---|---|---|---|---|
| Liberal Democrat | Simon Morrow | 878 | 47.6 | +9.1 | |
| Conservative | David Cooley | 737 | 40.0 | +3.0 | |
| UKIP | Martin Haley | 228 | 12.4 | -5.4 | |
| Majority | 141 | 7.6 | +6.1 | ||
| Turnout | 1,843 | 45.7 | +2.0 | ||
| Liberal Democrat hold | Swing | ||||
| Party | Candidate | Votes | % | ± | |
|---|---|---|---|---|---|
| Conservative | Glynis Whittle | 843 | 69.3 | -0.4 | |
| Liberal Democrat | Sarah Morrow | 374 | 30.7 | +0.4 | |
| Majority | 469 | 38.6 | -0.8 | ||
| Turnout | 1,217 | 47.8 | +1.6 | ||
| Conservative hold | Swing | ||||
| Party | Candidate | Votes | % | ± | |
|---|---|---|---|---|---|
| Conservative | Rosalind Langham | 584 | 53.3 | -2.5 | |
| Liberal Democrat | David Gosling | 414 | 37.8 | +13.0 | |
| Labour | Elena Tully | 97 | 8.9 | -10.5 | |
| Majority | 170 | 15.5 | -15.5 | ||
| Turnout | 1,095 | 38.5 | +4.0 | ||
| Conservative hold | Swing | ||||
| Party | Candidate | Votes | % | ± | |
|---|---|---|---|---|---|
| Liberal Democrat | Sakina Bradbury | 547 | 60.0 | -4.6 | |
| Conservative | Olwen Watson | 364 | 40.0 | +4.6 | |
| Majority | 183 | 20.0 | -9.2 | ||
| Turnout | 911 | 38.1 | +0.2 | ||
| Liberal Democrat hold | Swing | ||||
References
- ↑ "Local elections: Tandridge". BBC News Online. 5 May 2006. Retrieved 6 January 2012.
- ↑ "Local elections 2006: Results in full". The Guardian. 6 May 2006. p. 20.
- 1 2 3 4 5 6 7 8 9 10 11 12 13 14 15 16 "Election results 2006". Tandridge District Council. Archived from the original on 2006-09-27. Retrieved 6 January 2012.
- ↑ "Local elections". The Times. 5 May 2006. p. 9.
| Surrey County Council | |
|---|---|
| Elmbridge Borough Council | |
| Epsom and Ewell Borough Council | |
| Guildford Borough Council | |
| Mole Valley District Council | |
| Reigate and Banstead Borough Council | |
| Runnymede Borough Council | |
| Spelthorne Borough Council |
|
| Surrey Heath Borough Council | |
| Tandridge District Council | |
| Waverley Borough Council |
|
| Woking Borough Council | |
This article is issued from Wikipedia - version of the 9/10/2016. The text is available under the Creative Commons Attribution/Share Alike but additional terms may apply for the media files.