Surrey County Council elections
Surrey County Council is elected every four years and was made in 1889 under the Local Government Act 1888. Since 1974 all areas have had district/borough councils providing a second tier of services (see the Local Government Act 1972). The county has no grammar schools and gained its first academies and free schools in the 21st century, reducing the number of schools run by the authority. Other major services provided include transport, social services and minerals, and waste planning.
Approximately a third of the population elect an even more localised third tier of local government to civil parishes such as Farnham, Claygate and Horley.
Political control
| Party or group in control | Years | |
|---|---|---|
| Conservative | 1965–1993 | |
| No overall control | 1993–1997 | |
| Conservative | 1997–present | |
Composition since 1965
Council elections
Results are not provided here for 1889-1965. Many results remain to be uploaded.
- Surrey County Council election, 1977
- Surrey County Council election, 2009
- Surrey County Council election, 2013
| Party | Seats | |
|---|---|---|
| Conservative | 57 | |
| Labour | 8 | |
| Residents Association/Independent | 6 | |
| Liberal | 1 | |
| Party | Seats | |
|---|---|---|
| Conservative | 64 | |
| Residents Association/Independent | 5 | |
| Labour | 3 | |
| Liberal | 0 | |
| Party | Seats | |
|---|---|---|
| Conservative | 64 | |
| Labour | 4 | |
| Residents Association/Independent | 3 | |
| Liberal | 1 | |
| Party | Seats | |
|---|---|---|
| Conservative | 46 | |
| Labour | 12 | |
| Liberal | 9 | |
| Residents Association/Independent | 5 | |
| Party | Seats | |
|---|---|---|
| Conservative | 68 | |
| Residents Association/Independent | 3 | |
| Labour | 2 | |
| Liberal | 0 | |
The number of electoral divisions on Surrey County Council was increased to 76, in time for the 1981 election.
| Party | Seats | |
|---|---|---|
| Conservative | 61 | |
| Labour | 7 | |
| Residents Association/Independent | 5 | |
| Liberal | 3 | |
| Party | Seats | |
|---|---|---|
| Conservative | 52 | |
| SDP-Liberal Alliance | 12 | |
| Labour | 7 | |
| Residents Association/Independent | 5 | |
| Party | Seats | |
|---|---|---|
| Conservative | 56 | |
| Social & Liberal Democrats | 9 | |
| Labour | 7 | |
| Residents Association/Independent | 4 | |
| Party | Seats | |
|---|---|---|
| Conservative | 34 | |
| Liberal Democrats | 29 | |
| Labour | 8 | |
| Residents Association/Independent | 5 | |
| Party | Seats | |
|---|---|---|
| Conservative | 47 | |
| Liberal Democrats | 17 | |
| Labour | 6 | |
| Residents Association/Independent | 6 | |
| Party | Seats | |
|---|---|---|
| Conservative | 51 | |
| Liberal Democrats | 13 | |
| Labour | 6 | |
| Residents Association/Independent | 6 | |
The number of electoral divisions on Surrey County Council was increased from 76 to 80, in time for the 2005 election.[7]
| Party | Seats | |
|---|---|---|
| Conservative | 58 | |
| Liberal Democrats | 12 | |
| Residents Association/Independent[9] | 8 | |
| Labour | 2 | |
Surrey County Council election, 2009
| Party | Seats | |
|---|---|---|
| Conservative | 56 | |
| Liberal Democrats | 13 | |
| Residents Association/Independent | 10 | |
| Labour | 1 | |
Surrey County Council election, 2013
The number of electoral divisions on Surrey County Council was increased from 80 to 81, in time for the 2013 election.
| Party | Seats | |
|---|---|---|
| Conservative | 58 | |
| Liberal Democrats | 9 | |
| Residents Association/Independent | 9 | |
| UKIP | 3 | |
| Labour | 1 | |
| Green | 1 | |
County result maps
-
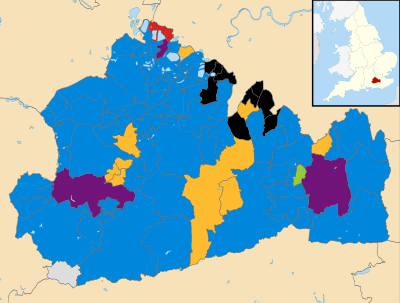
2013 results map
By-election results
| Party | Candidate | Votes | % | ± | |
|---|---|---|---|---|---|
| Conservative | 1,930 | 55.3 | +4.7 | ||
| Liberal Democrat | 1,245 | 35.7 | -1.8 | ||
| Labour | 312 | 8.9 | -3.0 | ||
| Majority | 685 | 19.6 | |||
| Turnout | 3,487 | ||||
| Conservative hold | Swing | 3.2 | |||
| Party | Candidate | Votes | % | ± | |
|---|---|---|---|---|---|
| Conservative | 2,428 | 59.1 | +9.3 | ||
| Labour | 1,678 | 40.9 | +7.6 | ||
| Majority | 750 | 18.2 | |||
| Turnout | 4,106 | 32.3 | |||
| Conservative hold | Swing | 0.8 | |||
| Party | Candidate | Votes | % | ± | |
|---|---|---|---|---|---|
| Conservative | 1,904 | 52.1 | +8.9 | ||
| Liberal Democrat | 1,629 | 44.5 | -6.1 | ||
| Labour | 123 | 3.4 | -2.8 | ||
| Majority | 278 | 7.6 | |||
| Turnout | 3,659 | 31.9 | |||
| Conservative gain from Liberal Democrat | Swing | 7.5 | |||
| Party | Candidate | Votes | % | ± | |
|---|---|---|---|---|---|
| Independent | 847 | 38.5 | -31.5 | ||
| Conservative | 736 | 33.7 | +33.7 | ||
| Liberal Democrat | 472 | 21.6 | -8.1 | ||
| Labour | 129 | 5.9 | +5.9 | ||
| Majority | 111 | 4.8 | |||
| Turnout | 2,184 | 18.9 | |||
| Independent hold | Swing | -32.6 | |||
| Party | Candidate | Votes | % | ± | |
|---|---|---|---|---|---|
| Labour | 741 | 40.1 | -9.9 | ||
| Conservative | 729 | 39.4 | +3.8 | ||
| Liberal Democrat | 282 | 15.2 | +6.5 | ||
| Independent | 98 | 5.3 | -0.3 | ||
| Majority | 12 | 0.7 | |||
| Turnout | 1,850 | 22.5 | |||
| Labour hold | Swing | -6.8 | |||
| Party | Candidate | Votes | % | ± | |
|---|---|---|---|---|---|
| Liberal Democrat | 1,672 | 57.2 | +9.3 | ||
| Conservative | 1,022 | 34.9 | +4.0 | ||
| Labour | 231 | 7.9 | -13.3 | ||
| Majority | 650 | 22.3 | |||
| Turnout | 2,925 | 18.0 | |||
| Liberal Democrat hold | Swing | 2.6 | |||
| Party | Candidate | Votes | % | ± | |
|---|---|---|---|---|---|
| Conservative | 2,042 | 49.4 | +0.1 | ||
| Liberal Democrat | 1,974 | 47.8 | +6.7 | ||
| Labour | 115 | 2.8 | -6.7 | ||
| Majority | 68 | 1.6 | |||
| Turnout | 4,131 | 39.6 | |||
| Conservative hold | Swing | -3.3 | |||
| Party | Candidate | Votes | % | ± | |
|---|---|---|---|---|---|
| Conservative | Marsha Moseley | 1,547 | 63.3 | +12.2 | |
| Liberal Democrat | Denise Smith | 898 | 36.7 | +3.5 | |
| Majority | 649 | 26.6 | |||
| Turnout | 2,445 | 27.7 | |||
| Conservative hold | Swing | 4.3 | |||
| Party | Candidate | Votes | % | ± | |
|---|---|---|---|---|---|
| Conservative | Anthony Samuels | 5231 | 65.1 | -0.2 | |
| Liberal Democrat | Vicki Macleod | 2802 | 34.9 | 9.3 | |
| Majority | 2429 | 30.2 | |||
| Turnout | 8033 | 69.4 | 29.7 | ||
| Conservative hold | Swing | -4.8 | |||
| Party | Candidate | Votes | % | ± | |
|---|---|---|---|---|---|
| Conservative | Nigel Sutcliffe | 1844 | 53.5 | 5.3 | |
| Liberal Democrat | Paul Ronald Cragg | 1286 | 37.3 | 2.4 | |
| Labour | Martin Phillips | 193 | 5.6 | 1.5 | |
| UKIP | Mazhar Manzoor | 78 | 2.3 | -9.8 | |
| Peace | John Hugh Morris | 39 | 1.1 | 1.1 | |
| Majority | 558 | 16.2 | |||
| Turnout | 3448 | ||||
| Conservative hold | Swing | 1.4 | |||
| Party | Candidate | Votes | % | ± | |
|---|---|---|---|---|---|
| Conservative | Simon George Stanford Gimson | 3602 | 66.1 | 8.4 | |
| Liberal Democrat | Andrew Howard Barnes | 1087 | 20.0 | -2.4 | |
| Labour | Michael Stanley Jeram | 701 | 12.9 | 7.8 | |
| Majority | 2515 | 46.2 | |||
| Turnout | 5446 | ||||
| Conservative hold | Swing | 5.4 | |||
| Party | Candidate | Votes | % | ± | |
|---|---|---|---|---|---|
| Conservative | Alan Edward Young | 2830 | |||
| Independent | Diane Martine James | 1093 | |||
| Liberal Democrat | Richard Ernest Cole | 933 | |||
| Labour | Lynda May Macdermott | 532 | |||
| Majority | 1737 | ||||
| Turnout | |||||
| Conservative hold | Swing | ||||
| Party | Candidate | Votes | % | ± | |
|---|---|---|---|---|---|
| Conservative | Linda Stephanie Kemeny | 1342 | 48.8 | ||
| Liberal Democrat | Christina Judith Liddington | 1058 | 38.5 | ||
| Labour | Audrey Janice Worgan | 188 | 6.8 | ||
| UKIP | Duncan Clarke | 155 | 5.6 | ||
| Majority | 284 | 10.3 | |||
| Turnout | 2749 | 28.9 | |||
| Conservative hold | Swing | ||||
| Party | Candidate | Votes | % | ± | |
|---|---|---|---|---|---|
| Conservative | Keith Francis Witham | 2022 | 53.3 | ||
| Liberal Democrat | Paul Ronald Cragg | 1236 | 32.6 | ||
| Labour | Martin Phillips | 517 | 13.6 | ||
| Majority | 786 | 20.7 | |||
| Turnout | 3794 | ||||
| Conservative hold | Swing | ||||
| Party | Candidate | Votes | % | ± | |
|---|---|---|---|---|---|
| Conservative | Ramon John Gray | 4190 | 54.6 | ||
| Weybridge Independents | Peter Michael Harman | 1899 | 24.7 | ||
| Labour | Elinor Mair Jones | 967 | 12.6 | ||
| UKIP | Joe Branco | 622 | 8.1 | ||
| Majority | 2291 | 29.8 | |||
| Turnout | 67.4 | ||||
| Conservative hold | Swing | ||||
| Party | Candidate | Votes | % | ± | |
|---|---|---|---|---|---|
| Conservative | Karan Persand | 612 | 23.5 | ||
| Residents | Neil Andrew Dallen | 591 | 22.7 | ||
| Liberal Democrat | Julie Anne Morris | 588 | 22.6 | ||
| Labour | Kate Chinn | 578 | 22.2 | ||
| UKIP | Robert Leach | 168 | 6.5 | ||
| Green | Chris Crook | 58 | 2.2 | ||
| Majority | 21 | 0.8 | |||
| Turnout | 2,602 | 24.7 | |||
| Conservative gain from Liberal Democrat | Swing | ||||
| Party | Candidate | Votes | % | ± | |
|---|---|---|---|---|---|
| Conservative | Denise Turner-Stewart | 1,585 | 46.6 | +9.0 | |
| UKIP | Peter Alfred Appleford | 695 | 20.4 | -17.4 | |
| Labour | Iain Lochiel Raymond | 543 | 16.0 | -4.3 | |
| Liberal Democrat | Christopher Leslie Bateson | 382 | 11.2 | +7.4 | |
| Green | Andrew McLuskey | 145 | 4.3 | N/A | |
| TUSC | Matthew David Clarke | 33 | 1.0 | N/A | |
| Majority | 890 | 26.1 | |||
| Turnout | 3,404 | ||||
| Conservative gain from UKIP | Swing | ||||
References
- ↑ see Surrey Advertiser 3 April 1965 edition
- ↑ see Surrey Advertiser April 1967
- ↑ see Surrey Advertiser 17 April 1970 edition
- ↑ 1973 to 1993 results source - Local Elections in Britain A Statistical Digest, 2nd edition, edited by Colin Rallings & Michael Thrasher
- ↑ pp7,8 RESEARCH PAPER 01/71 "The Local Elections of 7 June 2001" at http://www.parliament.uk/parliamentary_publications_and_archives/research_papers.cfm . See also http://www.epsom-ewell.gov.uk/NR/rdonlyres/5C2744D8-F982-4CCE-AC16-30B071EC1BB4/0/SurreyCountyCouncilElectionResults.pdf
- ↑ p7 RESEARCH PAPER 01/71 "The Local Elections of 7 June 2001" at http://www.parliament.uk/parliamentary_publications_and_archives/research_papers.cfm . See also http://www.epsom-ewell.gov.uk/NR/rdonlyres/5C2744D8-F982-4CCE-AC16-30B071EC1BB4/0/SurreyCountyCouncilElectionResults.pdf
- ↑ BBC News http://news.bbc.co.uk/1/hi/uk_politics/vote_2005/england/4520703.stm
- ↑ BBC News local election results: Surrey http://news.bbc.co.uk/1/shared/vote2005/locals/html/3883.stm
- ↑ The 8 Resident Association/Independent councillors represent electoral divisions in Elmbridge and in Epsom & Ewell, or in an electoral division bordering on Epsom & Ewell. See http://www.surreycc.gov.uk/members/membook.nsf/webSelectMember?openform
- ↑ Surrey County Council website election results 2009: http://www1.surreycc.gov.uk/election2009/default.aspx?2009-06-06T15:59:12#election
- ↑ http://news.surreycc.gov.uk/2013/05/03/election-results-special/
- ↑ http://www.surrey.gov.uk
- ↑ See www.guildford.gov.uk
- ↑ See www.guildford.gov.uk
- ↑ See www.surreycc.gov.uk
- ↑ See www.surreycc.gov.uk
- ↑ See www.surreycc.gov.uk
- ↑ See www.surreycc.gov.uk
- ↑ See www.surreycc.gov.uk
- ↑ See www.surreycc.gov.uk
External links
| Surrey County Council | |
|---|---|
| Elmbridge Borough Council | |
| Epsom and Ewell Borough Council | |
| Guildford Borough Council | |
| Mole Valley District Council | |
| Reigate and Banstead Borough Council | |
| Runnymede Borough Council | |
| Spelthorne Borough Council |
|
| Surrey Heath Borough Council | |
| Tandridge District Council | |
| Waverley Borough Council |
|
| Woking Borough Council | |