South Cambridgeshire District Council election, 2006

Elections to South Cambridgeshire District Council took place on Thursday 4 May 2006, as part of the United Kingdom local elections, 2006. Twenty seats, making up just over one third of South Cambridgeshire District Council, were up for election, with a by-election being held in one ward (Harston and Hauxton). Seats up for election in 2006 were last contested at the 2004 election, when all seats were up for election due to new ward boundaries, and were next contested at the 2010 election. The Conservative Party remained the largest party with an increased number of seats, but the council remained under no overall control.
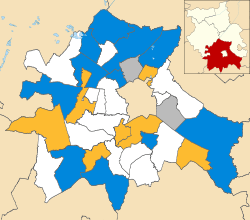
Summary
At this election, the Conservative Party and the Liberal Democrats were defending eight seats each. Independent councillors were defending in three wards, while Labour were defending in Sawston. The Liberal Democrats lost three seats to the Conservatives in Balsham, Melbourn and Waterbeach, but gained the Shelfords and Stapleford from the Conservatives. In Milton, the incumbent independent councillor ran for re-election as a Liberal Democrat. Other Conservative gains included from Labour in Sawston as well as from an independent in Cottenham. In Histon and Impington however an independent, who had run as a Conservative in 2004, defeated the incumbent Conservative councillor.
Results
| South Cambridgeshire District Council election, 2006[1] | |||||||
|---|---|---|---|---|---|---|---|
| Party | Seats | Popular vote | |||||
| Won | Not up | Total | ± | Votes | % | ||
| Conservative | 11 | 14 | 25 | +3 | 14,193 | 46.8 | |
| Liberal Democrats | 7 | 12 | 19 | −1 | 11,651 | 38.4 | |
| Independent | 2 | 10 | 12 | −1 | 1,760 | 5.8 | |
| Labour | 0 | 1 | 1 | −1 | 1,420 | 4.7 | |
| Green | 0 | 0 | 0 | 0 | 1,140 | 3.8 | |
| Respect | 0 | 0 | 0 | 0 | 86 | 0.3 | |
| Monster Raving Loony | 0 | 0 | 0 | 0 | 56 | 0.2 | |
| Total | 20 | 37 | 57 | – | 30,306 | – | |
| Turnout | 40.2 | ||||||
Results by ward
| Party | Candidate | Votes | % | ± | |
|---|---|---|---|---|---|
| Conservative | Victoria Grace Ford | 1,060 | 51.2 | +0.1 | |
| Liberal Democrat | Samuel John Agnew | 1,011 | 48.8 | −0.1 | |
| Majority | 49 | ||||
| Turnout | 58.7 | ||||
| Conservative gain from Liberal Democrat | Swing | ||||
| Party | Candidate | Votes | % | ± | |
|---|---|---|---|---|---|
| Conservative | Bunty Elizabeth Waters | 932 | 56.5 | +6.7 | |
| Liberal Democrat | Thomas Joseph Flanagan | 537 | 32.6 | −4.9 | |
| Labour | John Samuel Shepherd | 94 | 5.7 | −1.3 | |
| Respect | Steven Sweeney | 86 | 5.2 | N/A | |
| Majority | 395 | ||||
| Turnout | 43.2 | ||||
| Conservative hold | Swing | ||||
| Party | Candidate | Votes | % | ± | |
|---|---|---|---|---|---|
| Conservative | David Charles McCraith | 751 | 55.9 | +9.2 | |
| Green | Simon Peter Saggers | 319 | 23.8 | +3.2 | |
| Liberal Democrat | Anthony Stuart Milton | 272 | 20.3 | N/A | |
| Majority | 432 | ||||
| Turnout | 39.2 | ||||
| Conservative hold | Swing | ||||
| Party | Candidate | Votes | % | ± | |
|---|---|---|---|---|---|
| Conservative | David Hugh Morgan | 737 | 46.1 | −8.6 | |
| Liberal Democrat | Jonathan Rolf Hansford | 417 | 26.1 | −8.2 | |
| Independent | Clayton James Hudson | 300 | 18.8 | N/A | |
| Labour | Mark David Hurn | 145 | 9.1 | +2.2 | |
| Majority | 320 | ||||
| Turnout | 36.5 | ||||
| Conservative hold | Swing | ||||
| Party | Candidate | Votes | % | ± | |
|---|---|---|---|---|---|
| Liberal Democrat | Robin Barry Martlew | 423 | 52.7 | −3.4 | |
| Conservative | Adrian Michael Peck | 347 | 43.2 | −0.7 | |
| Labour | Helen Mary Haugh | 33 | 4.1 | N/A | |
| Majority | 76 | ||||
| Turnout | 46.0 | ||||
| Liberal Democrat hold | Swing | ||||
| Party | Candidate | Votes | % | ± | |
|---|---|---|---|---|---|
| Conservative | Nigel Charles Francis Bolitho | 1,207 | 59.8 | +23.7 | |
| Liberal Democrat | Linden Mary Leeke | 811 | 40.2 | +13.9 | |
| Majority | 396 | ||||
| Turnout | 34.1 | ||||
| Conservative gain from Independent | Swing | ||||
| Party | Candidate | Votes | % | ± | |
|---|---|---|---|---|---|
| Independent | Sandra June Olga Doggett | 599 | 44.7 | +24.0 | |
| Liberal Democrat | John George Williams | 423 | 31.5 | +3.4 | |
| Conservative | Alison Mary Farmer | 319 | 23.8 | +2.7 | |
| Majority | 176 | ||||
| Turnout | 39.3 | ||||
| Independent hold | Swing | ||||
| Party | Candidate | Votes | % | ± | |
|---|---|---|---|---|---|
| Liberal Democrat | Ann Elsby | 787 | 54.9 | −14.5 | |
| Conservative | Mark John Taylor | 529 | 36.9 | +6.3 | |
| Labour | Grace Mary Everson | 117 | 8.2 | N/A | |
| Majority | 258 | ||||
| Turnout | 37.9 | ||||
| Liberal Democrat hold | Swing | ||||
| Party | Candidate | Votes | % | ± | |
|---|---|---|---|---|---|
| Conservative | Thomas Dominic Bygott | 685 | 48.1 | −7.5 | |
| Liberal Democrat | Peter Robert Fane | 439 | 30.9 | +6.6 | |
| Green | Teal Richard Riley | 178 | 12.5 | −7.6 | |
| Labour | Michael Idowu | 121 | 8.5 | N/A | |
| Majority | 246 | ||||
| Turnout | 45.4 | ||||
| Conservative hold | Swing | ||||
| Party | Candidate | Votes | % | ± | |
|---|---|---|---|---|---|
| Liberal Democrat | Janet Elizabeth Lockwood | 550 | 58.5 | +12.7 | |
| Conservative | Alan William Langley | 390 | 41.5 | +4.0 | |
| Majority | 160 | ||||
| Turnout | 50.9 | ||||
| Liberal Democrat hold | Swing | ||||
| Party | Candidate | Votes | % | ± | |
|---|---|---|---|---|---|
| Independent | Neil Sinnett Davies | 861 | 34.7 | N/A | |
| Conservative | Jean Anne Muncey | 816 | 32.9 | +1.3 | |
| Liberal Democrat | Thomas Frederick Ralph Lynn | 614 | 24.7 | −9.8 | |
| Green | Mark Johan Alexander Claessen | 191 | 7.7 | +3.3 | |
| Majority | 45 | ||||
| Turnout | 39.9 | ||||
| Independent gain from Conservative | Swing | ||||
| Party | Candidate | Votes | % | ± | |
|---|---|---|---|---|---|
| Liberal Democrat | Patricia Mary Bear | 947 | 65.5 | +4.8 | |
| Conservative | Robert Patrick James Altham | 499 | 34.5 | +1.7 | |
| Majority | 448 | ||||
| Turnout | 40.6 | ||||
| Liberal Democrat hold | Swing | ||||
| Party | Candidate | Votes | % | ± | |
|---|---|---|---|---|---|
| Conservative | Janice Mary Guest | 1,077 | 56.7 | +15.8 | |
| Liberal Democrat | David Adrian Louis George Wherrell | 574 | 30.2 | −21.0 | |
| Green | Sally Ann Seagrave Nichols | 126 | 6.6 | −1.2 | |
| Labour | Michael William Kernaghan | 122 | 6.4 | N/A | |
| Majority | 503 | ||||
| Turnout | 46.4 | ||||
| Conservative gain from Liberal Democrat | Swing | ||||
| Party | Candidate | Votes | % | ± | |
|---|---|---|---|---|---|
| Liberal Democrat | Susan Elizabeth Kerr van de Ven | 546 | 63.9 | +10.8 | |
| Conservative | Lister John Wilson | 261 | 30.5 | −10.0 | |
| Green | Pauline Radley | 48 | 5.6 | −0.8 | |
| Majority | 285 | ||||
| Turnout | 47.7 | ||||
| Liberal Democrat hold | Swing | ||||
| Party | Candidate | Votes | % | ± | |
|---|---|---|---|---|---|
| Liberal Democrat | Richard Summerfield | 686 | 52.1 | +19.6 | |
| Conservative | Gerda Covell | 575 | 43.7 | +16.8 | |
| Monster Raving Loony | Timothy John Franklin (aka Speedways Fast Freddy) | 56 | 4.3 | N/A | |
| Majority | 111 | ||||
| Turnout | 43.8 | ||||
| Liberal Democrat gain from Independent | Swing | ||||
| Party | Candidate | Votes | % | ± | |
|---|---|---|---|---|---|
| Conservative | Raymond Michael Matthews | 862 | 49.8 | +0.3 | |
| Labour | Nigel Peter Carder | 590 | 34.1 | +19.1 | |
| Green | Jacquelyn Jean Garfit | 278 | 16.1 | N/A | |
| Majority | 272 | ||||
| Turnout | 32.3 | ||||
| Conservative gain from Labour | Swing | ||||
| Party | Candidate | Votes | % | ± | |
|---|---|---|---|---|---|
| Conservative | Susan Mary Ellington | unopposed | |||
| Conservative hold | Swing | ||||
| Party | Candidate | Votes | % | ± | |
|---|---|---|---|---|---|
| Liberal Democrat | Anthony Neil Berent | 1,248 | 46.4 | +24.2 | |
| Conservative | Simon Robert Carne King | 1,244 | 46.3 | −18.7 | |
| Labour | Michael Robert Nettleton | 198 | 7.4 | −5.5 | |
| Majority | 4 | ||||
| Turnout | 48.9 | ||||
| Liberal Democrat gain from Conservative | Swing | ||||
| Party | Candidate | Votes | % | ± | |
|---|---|---|---|---|---|
| Conservative | Peter Terence Johnson | 943 | 56.2 | +16.5 | |
| Liberal Democrat | Jane Rata Williamson | 735 | 43.8 | +10.1 | |
| Majority | 208 | ||||
| Turnout | 42.8 | ||||
| Conservative gain from Liberal Democrat | Swing | ||||
| Party | Candidate | Votes | % | ± | |
|---|---|---|---|---|---|
| Conservative | Philippa Saran Corney | 959 | 60.3 | +6.3 | |
| Liberal Democrat | Leslie Harold Gelling | 631 | 39.7 | +3.9 | |
| Majority | 328 | ||||
| Turnout | 32.1 | ||||
| Conservative hold | Swing | ||||
References
| Cambridgeshire County Council | |
|---|---|
| Peterborough City Council | |
| Cambridge City Council | |
| East Cambridgeshire District Council |
|
| Fenland District Council | |
| Huntingdonshire District Council | |
| South Cambridgeshire District Council | |
| Isle of Ely County Council |
|
| Huntingdon & Peterborough County Council |
|
| |