Huntingdonshire District Council election, 2002
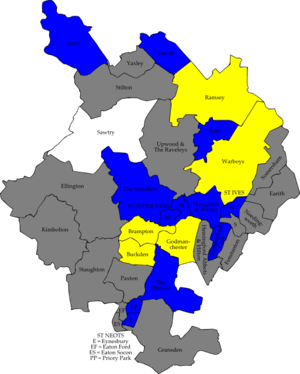
Map of the results of the 2002 Huntingdonshire District Council election. Conservatives in blue, Liberal Democrats in yellow and independents in white. Wards in grey were not contested in 2002.
The 2002 Huntingdonshire District Council election took place on 4 May 2002 to elect members of Huntingdonshire District Council in Cambridgeshire, England. One third of the council was up for election and the Conservative party stayed in overall control of the council.[1]
After the election, the composition of the council was
Election result
| Huntingdonshire local election result 2002[3][4] | ||||||||||
|---|---|---|---|---|---|---|---|---|---|---|
| Party | Seats | Gains | Losses | Net gain/loss | Seats % | Votes % | Votes | +/− | ||
| Conservative | 12 | 2 | 2 | 0 | 66.7 | 46.1 | 10,967 | -9.6% | ||
| Liberal Democrat | 5 | 2 | 2 | 0 | 27.8 | 37.5 | 8,922 | +9.9% | ||
| Independent | 1 | 0 | 0 | 0 | 5.6 | 4.6 | 1,105 | +1.3% | ||
| Labour | 0 | 0 | 0 | 0 | 0 | 11.7 | 2,777 | -0.9% | ||
Ward results
| Party | Candidate | Votes | % | ± | |
|---|---|---|---|---|---|
| Liberal Democrat | Shirley Menczer | 1,098 | 60.1 | +9.2 | |
| Conservative | Elaine Sefton | 670 | 36.7 | -8.4 | |
| Labour | Graham Hitchings | 58 | 3.2 | +1.3 | |
| Majority | 428 | 23.4 | +17.6 | ||
| Turnout | 1,826 | 49.5 | -4.6 | ||
| Liberal Democrat hold | Swing | ||||
| Party | Candidate | Votes | % | ± | |
|---|---|---|---|---|---|
| Liberal Democrat | William Clough | 729 | 70.8 | +4.8 | |
| Conservative | John Lancaster | 270 | 26.2 | -5.2 | |
| Labour | David Brown | 30 | 2.9 | +0.3 | |
| Majority | 459 | 44.6 | +10.0 | ||
| Turnout | 1,029 | 50.2 | -7.8 | ||
| Liberal Democrat hold | Swing | ||||
| Party | Candidate | Votes | % | ± | |
|---|---|---|---|---|---|
| Conservative | John Rignall | 570 | 77.6 | +7.2 | |
| Liberal Democrat | Janet Dutton | 99 | 13.5 | -7.3 | |
| Labour | Maria Baker | 66 | 9.0 | +0.1 | |
| Majority | 471 | 64.1 | +14.5 | ||
| Turnout | 735 | 44.9 | -4.0 | ||
| Conservative hold | Swing | ||||
| Party | Candidate | Votes | % | ± | |
|---|---|---|---|---|---|
| Conservative | Nicholas Guyatt | 392 | 66.7 | -3.1 | |
| Independent | John Davidson | 99 | 16.8 | +16.8 | |
| Labour | Kevin Goddard | 97 | 16.5 | -4.0 | |
| Majority | 293 | 49.8 | +0.4 | ||
| Turnout | 588 | 42.2 | +7.6 | ||
| Conservative hold | Swing | ||||
| Party | Candidate | Votes | % | ± | |
|---|---|---|---|---|---|
| Conservative | Eric Butler | 253 | 53.7 | +0.0 | |
| Labour | Graeme Watkins | 218 | 46.3 | +3.5 | |
| Majority | 35 | 7.4 | -3.6 | ||
| Turnout | 471 | 35.1 | -2.1 | ||
| Conservative hold | Swing | ||||
| Party | Candidate | Votes | % | ± | |
|---|---|---|---|---|---|
| Liberal Democrat | Charles Looker | 986 | 58.3 | +8.9 | |
| Conservative | Keith Gabb | 614 | 36.3 | -7.1 | |
| Labour | Sandra Wilcox | 92 | 5.4 | -1.8 | |
| Majority | 372 | 22.0 | +16.0 | ||
| Turnout | 1,692 | 37.5 | +2.1 | ||
| Liberal Democrat gain from Conservative | Swing | ||||
| Party | Candidate | Votes | % | ± | |
|---|---|---|---|---|---|
| Conservative | Michael Day | 514 | 60.5 | -9.2 | |
| Liberal Democrat | Gilly Jackson | 203 | 23.9 | +15.7 | |
| Labour | Michael Sneath | 132 | 15.5 | -6.6 | |
| Majority | 311 | 36.6 | -11.0 | ||
| Turnout | 849 | 41.0 | +2.1 | ||
| Conservative hold | Swing | ||||
| Party | Candidate | Votes | % | ± | |
|---|---|---|---|---|---|
| Conservative | Roger Rhodes | 401 | 48.4 | -18.9 | |
| Liberal Democrat | David Hunter | 389 | 47.0 | +24.5 | |
| Labour | John Watson | 38 | 4.6 | -5.6 | |
| Majority | 12 | 1.4 | -43.4 | ||
| Turnout | 828 | 41.1 | +7.1 | ||
| Conservative hold | Swing | ||||
| Party | Candidate | Votes | % | ± | |
|---|---|---|---|---|---|
| Conservative | Deborah Sharp | 961 | 54.5 | -12.3 | |
| Labour | Ann Beevor | 485 | 27.5 | -5.7 | |
| Liberal Democrat | Justin Meadows | 317 | 18.0 | +18.0 | |
| Majority | 476 | 27.0 | -6.6 | ||
| Turnout | 1,763 | 24.7 | -2.0 | ||
| Conservative hold | Swing | ||||
| Party | Candidate | Votes | % | ± | |
|---|---|---|---|---|---|
| Conservative | John Sadler | 791 | 48.6 | -6.8 | |
| Labour | Ruth Pugh | 486 | 29.9 | +2.3 | |
| Liberal Democrat | Michael Shellens | 349 | 21.5 | +9.1 | |
| Majority | 305 | 18.8 | -8.9 | ||
| Turnout | 1,626 | 22.2 | -1.3 | ||
| Conservative hold | Swing | ||||
| Party | Candidate | Votes | % | ± | |
|---|---|---|---|---|---|
| Liberal Democrat | Raymond Powell | 859 | 50.3 | +8.5 | |
| Conservative | Ian Muir | 850 | 49.7 | -1.8 | |
| Majority | 9 | 0.5 | |||
| Turnout | 1,709 | 28.6 | +3.1 | ||
| Liberal Democrat gain from Conservative | Swing | ||||
| Party | Candidate | Votes | % | ± | |
|---|---|---|---|---|---|
| Independent | Richard Tuplin | 1,006 | 64.2 | +12.5 | |
| Conservative | David Bowens | 479 | 30.6 | -10.3 | |
| Labour | Susan Coomey | 82 | 5.2 | -2.2 | |
| Majority | 527 | 33.6 | +22.8 | ||
| Turnout | 1,567 | 34.1 | +0.6 | ||
| Independent hold | Swing | ||||
| Party | Candidate | Votes | % | ± | |
|---|---|---|---|---|---|
| Conservative | Jean Chandler | 808 | 39.4 | -23.0 | |
| Liberal Democrat | Deborah Townsend | 800 | 39.0 | +15.0 | |
| Labour | Robert Haynes | 443 | 21.6 | +11.2 | |
| Majority | 8 | 0.4 | -38.0 | ||
| Turnout | 2,051 | 30.1 | +4.6 | ||
| Conservative hold | Swing | ||||
| Party | Candidate | Votes | % | ± | |
|---|---|---|---|---|---|
| Conservative | Andrew Hansard | 731 | 44.6 | -3.6 | |
| Liberal Democrat | Ian Taylor | 661 | 40.3 | +6.0 | |
| Labour | William O'Connor | 248 | 15.1 | -2.4 | |
| Majority | 70 | 4.3 | -9.6 | ||
| Turnout | 1,640 | 26.5 | +5.1 | ||
| Conservative hold | Swing | ||||
| Party | Candidate | Votes | % | ± | |
|---|---|---|---|---|---|
| Conservative | Andrew Barnes | 804 | 51.7 | +15.8 | |
| Liberal Democrat | Michael Pope | 651 | 41.9 | -11.0 | |
| Labour | Patricia Nicholls | 99 | 6.4 | -4.7 | |
| Majority | 153 | 9.8 | |||
| Turnout | 1,554 | 37.3 | +5.5 | ||
| Conservative gain from Liberal Democrat | Swing | ||||
| Party | Candidate | Votes | % | ± | |
|---|---|---|---|---|---|
| Conservative | Nichola Elliott | 496 | 52.9 | +7.8 | |
| Liberal Democrat | John Grosvenor | 383 | 40.8 | -7.5 | |
| Labour | Janet Boston | 59 | 6.3 | -0.2 | |
| Majority | 113 | 12.0 | |||
| Turnout | 938 | 44.4 | -10.4 | ||
| Conservative gain from Liberal Democrat | Swing | ||||
| Party | Candidate | Votes | % | ± | |
|---|---|---|---|---|---|
| Conservative | Sarah Vanbergen | 846 | 52.6 | -6.0 | |
| Liberal Democrat | Vivienne Dyer | 678 | 42.2 | +7.9 | |
| Labour | Valerie Brooker | 83 | 5.2 | -1.9 | |
| Majority | 168 | 10.5 | -13.8 | ||
| Turnout | 1,607 | 54.5 | +7.7 | ||
| Conservative hold | Swing | ||||
| Party | Candidate | Votes | % | ± | |
|---|---|---|---|---|---|
| Liberal Democrat | Jack Taylor | 720 | 55.5 | +21.7 | |
| Conservative | Pamela Thornton | 517 | 39.8 | -22.8 | |
| Labour | Carol Osborne | 61 | 4.7 | +1.1 | |
| Majority | 203 | 15.6 | |||
| Turnout | 1,298 | 34.2 | -0.8 | ||
| Liberal Democrat hold | Swing | ||||
By-elections between 2002 and 2003
| Party | Candidate | Votes | % | ± | |
|---|---|---|---|---|---|
| Liberal Democrat | 553 | 52.9 | +29.0 | ||
| Conservative | 493 | 47.1 | -13.4 | ||
| Majority | 60 | 5.7 | |||
| Turnout | 1,046 | 50.3 | +9.3 | ||
| Liberal Democrat gain from Conservative | Swing | ||||
References
- ↑ "Huntingdonshire". BBC News Online. Retrieved 2 July 2014.
- ↑ "Local Elections: Results : Huntingdonshire". The Guardian. NewsBank. 3 May 2002.
- ↑ "Election results - Local Elections". The Times. NewsBank. 3 May 2002.
- 1 2 3 4 5 6 7 8 9 10 11 12 13 14 15 16 17 18 19 "District Council Election" (PDF). Huntingdonshire District Council. Retrieved 2 July 2014.
- ↑ "Local Authority Byelection Results". Retrieved 2 July 2014.
- ↑ "Tories make shock gain from SNP". The Guardian. 20 September 2002. Retrieved 2 July 2014.
| Cambridgeshire County Council | |
|---|---|
| Peterborough City Council | |
| Cambridge City Council | |
| East Cambridgeshire District Council |
|
| Fenland District Council | |
| Huntingdonshire District Council | |
| South Cambridgeshire District Council | |
| Isle of Ely County Council |
|
| Huntingdon & Peterborough County Council |
|
| |
This article is issued from Wikipedia - version of the 4/21/2016. The text is available under the Creative Commons Attribution/Share Alike but additional terms may apply for the media files.