Cambridgeshire County Council election, 2005

An election to Cambridgeshire County Council took place on 5 May 2005 as part of the United Kingdom local elections, 2005. The election took place on the same day as the United Kingdom general election, 2005. 69 councillors were elected from 60 electoral divisions, which returned either one or two county councillors each by first-past-the-post voting. New electoral division boundaries were brought in for this election, increasing the number of seats from 59. The Conservative Party retained their majority on the council, while the Labour Party lost all their rural councillors with their representation limited to the city of Cambridge.
Results
| Cambridgeshire County Council election, 2005[1][2][3] | ||||||||||
|---|---|---|---|---|---|---|---|---|---|---|
| Party | Seats | Gains | Losses | Net gain/loss | Seats % | Votes % | Votes | +/− | ||
| Conservative | 42 | N/A | N/A | N/A | 60.9% | 41.9% | 138,135 | N/A | ||
| Liberal Democrat | 23 | N/A | N/A | N/A | 33.3% | 37.4% | 123,533 | N/A | ||
| Labour | 3 | N/A | N/A | N/A | 4.3% | 14.9% | 49,252 | N/A | ||
| Green | 0 | N/A | N/A | N/A | 0.0% | 3.3% | 10,979 | N/A | ||
| Labour Co-op | 1 | N/A | N/A | N/A | 1.4% | 1.5% | 5,014 | N/A | ||
| Independent | 0 | N/A | N/A | N/A | 0.0% | 0.5% | 1,625 | N/A | ||
| UKIP | 0 | N/A | N/A | N/A | 0.0% | 0.4% | 1,416 | N/A | ||
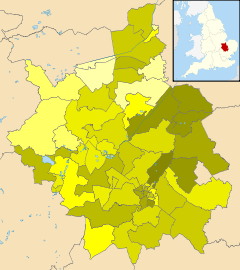
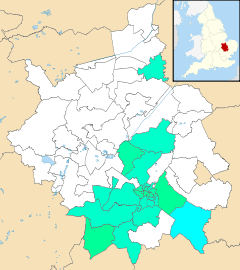
Party strength by electoral division
The following maps show the percentage of the vote each party obtained by electoral division. A colour key for each map can be viewed by clicking on the image.
| Conservative Party | Liberal Democrats |
|---|---|
 |
 |
| Labour Party | Green Party |
 |
 |
Results by electoral division
Cambridge (14 seats)
| Party | Candidate | Votes | % | ± | |
|---|---|---|---|---|---|
| Labour Co-op | Paul Sales | 1,384 | 39.9 | N/A | |
| Liberal Democrat | Edward Thomas Sexton | 1,033 | 29.8 | N/A | |
| Conservative | Simon Anthony Mitton | 631 | 18.2 | N/A | |
| Green | Margaret Elizabeth Wright | 416 | 12.0 | N/A | |
| Turnout | 55.5 | ||||
| Labour Co-op win (new seat) | |||||
| Party | Candidate | Votes | % | ± | |
|---|---|---|---|---|---|
| Liberal Democrat | Rupert William George Moss-Eccardt | 1,686 | 41.0 | N/A | |
| Labour Co-op | Ian Charles Kidman | 1,386 | 33.7 | N/A | |
| Conservative | Shapour Meftah | 743 | 18.1 | N/A | |
| Green | Michael Smith | 295 | 7.2 | N/A | |
| Turnout | 60.6 | ||||
| Liberal Democrat win (new seat) | |||||
| Party | Candidate | Votes | % | ± | |
|---|---|---|---|---|---|
| Liberal Democrat | John David Cyril White | 2,132 | 52.2 | N/A | |
| Conservative | Robert William Boorman | 767 | 18.8 | N/A | |
| Labour | Jane Jacks | 733 | 17.9 | N/A | |
| Green | Stephen Roger Lawrence | 451 | 11.1 | N/A | |
| Turnout | 62.6 | ||||
| Liberal Democrat win (new seat) | |||||
| Party | Candidate | Votes | % | ± | |
|---|---|---|---|---|---|
| Labour | Christine Margaret Carter | 1,633 | 40.5 | N/A | |
| Liberal Democrat | Benjamin William Hutchings | 1,105 | 27.4 | N/A | |
| Conservative | Edward Alexander MacNaghten | 1,054 | 26.2 | N/A | |
| Green | Neil Alan Ford | 237 | 5.9 | N/A | |
| Turnout | 64.0 | ||||
| Labour win (new seat) | |||||
| Party | Candidate | Votes | % | ± | |
|---|---|---|---|---|---|
| Labour | Martin Ballard | 1,255 | 35.9 | N/A | |
| Liberal Democrat | Andrew Blackhurst | 1,203 | 34.4 | N/A | |
| Conservative | Steve Alexander Jones | 718 | 20.6 | N/A | |
| Green | Marilyn Carter | 241 | 6.9 | N/A | |
| UKIP | Albert Charles Watts | 77 | 2.2 | N/A | |
| Turnout | 59.9 | ||||
| Labour win (new seat) | |||||
| Party | Candidate | Votes | % | ± | |
|---|---|---|---|---|---|
| Liberal Democrat | Julian Leon Huppert | 1,411 | 39.2 | N/A | |
| Labour | Janet Robertson | 1,187 | 32.9 | N/A | |
| Conservative | Kevin Andre Francis | 694 | 19.3 | N/A | |
| Green | Peter Harry Pope | 306 | 8.5 | N/A | |
| Turnout | 60.8 | ||||
| Liberal Democrat win (new seat) | |||||
| Party | Candidate | Votes | % | ± | |
|---|---|---|---|---|---|
| Labour | Primrose Elizabeth Hughes | 1,228 | 36.9 | N/A | |
| Liberal Democrat | Clive Hollins | 1,129 | 33.9 | N/A | |
| Conservative | Rhona Corinne Boorman | 728 | 21.9 | N/A | |
| Green | Gerhard Ernst Goldbeck-Wood | 243 | 7.3 | N/A | |
| Turnout | 55.2 | ||||
| Labour win (new seat) | |||||
| Party | Candidate | Votes | % | ± | |
|---|---|---|---|---|---|
| Liberal Democrat | Gaynor Victoria Griffiths | 1,877 | 50.1 | N/A | |
| Conservative | Timothy James Haire | 665 | 17.8 | N/A | |
| Labour | Elizabeth Walter | 610 | 16.3 | N/A | |
| Green | Martin Vaughan Lucas-Smith | 592 | 15.8 | N/A | |
| Turnout | 57.5 | ||||
| Liberal Democrat win (new seat) | |||||
| Party | Candidate | Votes | % | ± | |
|---|---|---|---|---|---|
| Liberal Democrat | Alexander Arthur Luttrell Reid | 1,978 | 50.7 | N/A | |
| Conservative | Alasdair Ewen Ross | 703 | 18.0 | N/A | |
| Labour | Rita Rosemary Gaggs | 671 | 17.2 | N/A | |
| Green | Anna Serena Gomori-Woodcock | 553 | 14.2 | N/A | |
| Turnout | 62.1 | ||||
| Liberal Democrat win (new seat) | |||||
| Party | Candidate | Votes | % | ± | |
|---|---|---|---|---|---|
| Liberal Democrat | Nichola Jane Harrison | 1,356 | 40.4 | N/A | |
| Labour | Lucy Ann Sheerman | 1,052 | 31.3 | N/A | |
| Green | John Collins | 527 | 15.7 | N/A | |
| Conservative | Rosemary Anne Clarkson | 426 | 12.7 | N/A | |
| Turnout | 54.8 | ||||
| Liberal Democrat win (new seat) | |||||
| Party | Candidate | Votes | % | ± | |
|---|---|---|---|---|---|
| Liberal Democrat | Geoffrey John Heathcock | 2,392 | 59.2 | N/A | |
| Conservative | Andre Beaumont | 848 | 21.0 | N/A | |
| Labour Co-op | Leonard Arthur Freeman | 574 | 14.2 | N/A | |
| Green | Shayne Mary Mitchell | 225 | 5.6 | N/A | |
| Turnout | 63.0 | ||||
| Liberal Democrat win (new seat) | |||||
| Party | Candidate | Votes | % | ± | |
|---|---|---|---|---|---|
| Liberal Democrat | Joanna Toomey | 1,668 | 44.9 | N/A | |
| Labour Co-op | Jozef Lawrence Gluza | 1,235 | 33.3 | N/A | |
| Green | Hamish Downer | 402 | 10.8 | N/A | |
| Conservative | Mark Patrick Fanken-Hall | 359 | 9.7 | N/A | |
| UKIP | Marjorie Ruth Hadley Barr | 45 | 1.2 | N/A | |
| Turnout | 59.1 | ||||
| Liberal Democrat win (new seat) | |||||
| Party | Candidate | Votes | % | ± | |
|---|---|---|---|---|---|
| Liberal Democrat | Anne Christine Kent | 1,669 | 50.9 | N/A | |
| Conservative | John Ionides | 904 | 27.6 | N/A | |
| Labour Co-op | George Samuel Tudor | 435 | 13.3 | N/A | |
| Green | Ceri Barbara Galloway | 266 | 8.1 | N/A | |
| Turnout | 61.1 | ||||
| Liberal Democrat win (new seat) | |||||
| Party | Candidate | Votes | % | ± | |
|---|---|---|---|---|---|
| Liberal Democrat | Kevin Wilkins | 1,869 | 46.7 | N/A | |
| Labour | Simon Richard Ainsley Watkins | 964 | 24.1 | N/A | |
| Conservative | James Andrew Strachan | 699 | 17.5 | N/A | |
| Green | Sarah Peake | 468 | 11.7 | N/A | |
| Turnout | 62.8 | ||||
| Liberal Democrat win (new seat) | |||||
East Cambridgeshire (9 seats)
| Party | Candidate | Votes | % | ± | |
|---|---|---|---|---|---|
| Liberal Democrat | Hazel Williams | 2,220 | 55.9 | N/A | |
| Conservative | Lavinia Rebecca Edwards | 1,749 | 44.1 | N/A | |
| Turnout | 64.4 | ||||
| Liberal Democrat win (new seat) | |||||
| Party | Candidate | Votes | % | ± | |
|---|---|---|---|---|---|
| Liberal Democrat | Nigel Charles Bell | 2,589 | 59.6 | N/A | |
| Conservative | Victoria Angela Hearne-Casapieri | 1,754 | 40.4 | N/A | |
| Turnout | 60.2 | ||||
| Liberal Democrat win (new seat) | |||||
| Party | Candidate | Votes | % | ± | |
|---|---|---|---|---|---|
| Liberal Democrat | Linda Jane Crossley | 2,123 | 56.2 | N/A | |
| Conservative | Andrew Roderick Mair | 1,656 | 43.8 | N/A | |
| Turnout | 64.7 | ||||
| Liberal Democrat win (new seat) | |||||
| Party | Candidate | Votes | % | ± | |
|---|---|---|---|---|---|
| Conservative | William Thomas Ian Hunt | 1,994 | 41.3 | N/A | |
| Liberal Democrat | Gareth Laurence Philip Wilson | 1,789 | 37.1 | N/A | |
| Labour | Michele Wilkinson | 710 | 14.7 | N/A | |
| Green | Astra Patricia Carter-Marsh | 336 | 6.9 | N/A | |
| Turnout | 66.8 | ||||
| Conservative win (new seat) | |||||
| Party | Candidate | Votes | % | ± | |
|---|---|---|---|---|---|
| Liberal Democrat | Brenda Miriam Bean | 1,599 | 55.2 | N/A | |
| Conservative | Frederick John William Brown | 1,299 | 44.8 | N/A | |
| Turnout | 51.9 | ||||
| Liberal Democrat win (new seat) | |||||
| Party | Candidate | Votes | % | ± | |
|---|---|---|---|---|---|
| Liberal Democrat | Judith Broadway | 3,380 | 27.9 | N/A | |
| Conservative | John Albert Powley | 3,039 | 25.1 | N/A | |
| Liberal Democrat | Michael William Allan | 2,872 | 23.7 | N/A | |
| Conservative | Jacqueline Petts | 2,837 | 23.4 | N/A | |
| Turnout | 50.6 | ||||
| Liberal Democrat win (new seat) | |||||
| Conservative win (new seat) | |||||
| Party | Candidate | Votes | % | ± | |
|---|---|---|---|---|---|
| Liberal Democrat | Philip David Bailey | 2,122 | 56.8 | N/A | |
| Conservative | Philip Anderson Edmund Read | 1,617 | 43.3 | N/A | |
| Turnout | 63.2 | ||||
| Liberal Democrat win (new seat) | |||||
| Party | Candidate | Votes | % | ± | |
|---|---|---|---|---|---|
| Conservative | Mathew Gauntlett Shuter | 2,476 | 49.7 | N/A | |
| Liberal Democrat | Beate (Sisse) McCall | 1,644 | 33.0 | N/A | |
| Labour | Steven John O'Dell | 859 | 17.3 | N/A | |
| Turnout | 65.2 | ||||
| Conservative win (new seat) | |||||
Fenland (11 seats)
| Party | Candidate | Votes | % | ± | |
|---|---|---|---|---|---|
| Conservative | Alan Keith Melton | 1,604 | 46.0 | N/A | |
| Liberal Democrat | David Neale Upstone | 955 | 27.4 | N/A | |
| Labour | Susan Margaret Coomey | 926 | 26.6 | N/A | |
| Turnout | 62.1 | ||||
| Conservative win (new seat) | |||||
| Party | Candidate | Votes | % | ± | |
|---|---|---|---|---|---|
| Conservative | Geoffrey Farrar Harper | 2,114 | 52.6 | N/A | |
| Labour | Grant Charles Osbourn | 1,142 | 28.4 | N/A | |
| Liberal Democrat | Evelyn Vernon Bradford | 765 | 19.0 | N/A | |
| Turnout | 62.9 | ||||
| Conservative win (new seat) | |||||
| Party | Candidate | Votes | % | ± | |
|---|---|---|---|---|---|
| Conservative | Frederick Hartley Yeulett | 1,623 | 44.5 | N/A | |
| Labour | Karon Andree Webb | 1,190 | 32.6 | N/A | |
| Liberal Democrat | Michael Hal Pitt | 551 | 15.1 | N/A | |
| Green | Christopher John Bennett | 287 | 7.9 | N/A | |
| Turnout | 60.9 | ||||
| Conservative win (new seat) | |||||
| Party | Candidate | Votes | % | ± | |
|---|---|---|---|---|---|
| Conservative | John Frederick West | 1,497 | 52.1 | N/A | |
| Liberal Democrat | Edna Howarth | 1,378 | 47.9 | N/A | |
| Turnout | 57.5 | ||||
| Conservative win (new seat) | |||||
| Party | Candidate | Votes | % | ± | |
|---|---|---|---|---|---|
| Conservative | Michael Kirby Ogden | 2,105 | 57.6 | N/A | |
| Liberal Democrat | Simon Michael Rodgers | 1,549 | 42.4 | N/A | |
| Turnout | 61.5 | ||||
| Conservative win (new seat) | |||||
| Party | Candidate | Votes | % | ± | |
|---|---|---|---|---|---|
| Conservative | Brian Hardy | 2,294 | 59.1 | N/A | |
| Liberal Democrat | Toby Fisher | 1,591 | 40.9 | N/A | |
| Turnout | 57.9 | ||||
| Conservative win (new seat) | |||||
| Party | Candidate | Votes | % | ± | |
|---|---|---|---|---|---|
| Conservative | Jillian Mary Tuck | 2,164 | 58.8 | N/A | |
| Liberal Democrat | Shirley Fieldhouse | 1,517 | 41.2 | N/A | |
| Turnout | 57.7 | ||||
| Conservative win (new seat) | |||||
| Party | Candidate | Votes | % | ± | |
|---|---|---|---|---|---|
| Conservative | Martin John Curtis | 2,014 | 52.5 | N/A | |
| Labour | Richard Jeremy Hibbert | 1,341 | 34.9 | N/A | |
| Liberal Democrat | Malcolm Philip Schofield | 483 | 12.6 | N/A | |
| Turnout | 62.7 | ||||
| Conservative win (new seat) | |||||
| Party | Candidate | Votes | % | ± | |
|---|---|---|---|---|---|
| Conservative | Thomas Ralph Butcher | 2,291 | 57.9 | N/A | |
| Labour | Mark William Goffrey | 1,082 | 27.3 | N/A | |
| Liberal Democrat | Thomas Spencer Yates | 585 | 14.8 | N/A | |
| Turnout | 61.6 | ||||
| Conservative win (new seat) | |||||
| Party | Candidate | Votes | % | ± | |
|---|---|---|---|---|---|
| Conservative | Leslie Sims | 1,585 | 47.0 | N/A | |
| Labour | Kevin Roy Goddard | 1,184 | 35.1 | N/A | |
| Liberal Democrat | Anthony William Morris | 602 | 17.9 | N/A | |
| Turnout | 48.2 | ||||
| Conservative win (new seat) | |||||
| Party | Candidate | Votes | % | ± | |
|---|---|---|---|---|---|
| Conservative | Simon John Edward King | 1,941 | 53.7 | N/A | |
| Liberal Democrat | Louis Jerome Rodrigues | 1,084 | 29.9 | N/A | |
| UKIP | Paul Sydney Clapp | 592 | 16.4 | N/A | |
| Turnout | 51.0 | ||||
| Conservative win (new seat) | |||||
Huntingdonshire (19 seats)
| Party | Candidate | Votes | % | ± | |
|---|---|---|---|---|---|
| Liberal Democrat | Peter James Downes | 2,563 | 48.3 | N/A | |
| Conservative | Ian Derek Gardner | 2,285 | 42.1 | N/A | |
| Labour | Robert Kenneth Pugh | 460 | 8.7 | N/A | |
| Turnout | 73.7 | ||||
| Liberal Democrat win (new seat) | |||||
| Party | Candidate | Votes | % | ± | |
|---|---|---|---|---|---|
| Conservative | Barbara Elizabeth Boddington | 2,092 | 47.6 | N/A | |
| Liberal Democrat | William Terence Clough | 1,277 | 29.1 | N/A | |
| Independent | Alec Baynton Stenner | 579 | 13.2 | N/A | |
| Labour | David Robert Nicholls | 442 | 10.1 | N/A | |
| Turnout | 72.1 | ||||
| Conservative win (new seat) | |||||
| Party | Candidate | Votes | % | ± | |
|---|---|---|---|---|---|
| Conservative | Jeffery John Dutton | 3,114 | 23.9 | N/A | |
| Conservative | Colin Richard Hyams | 2,847 | 21.9 | N/A | |
| Liberal Democrat | Peter Ronald Fleming | 2,397 | 18.4 | N/A | |
| Liberal Democrat | Michael Frederick Shellens | 2,047 | 15.7 | N/A | |
| Labour | William Francis Hennessey | 1,301 | 10.0 | N/A | |
| Labour | David Michael Brown | 1,298 | 9.9 | N/A | |
| Turnout | 57.5 | ||||
| Conservative win (new seat) | |||||
| Conservative win (new seat) | |||||
| Party | Candidate | Votes | % | ± | |
|---|---|---|---|---|---|
| Conservative | Peter Randolph Brown | 2,830 | 25.9 | N/A | |
| Conservative | Elaine Victoria Kadic | 2,352 | 21.5 | N/A | |
| Liberal Democrat | Michael Philip Burrell | 1,375 | 12.6 | N/A | |
| Labour | Ann Elizabeth Beevor | 1,330 | 12.2 | N/A | |
| Liberal Democrat | Ann Monk | 1,227 | 11.2 | N/A | |
| Labour | David Mitchell King | 1,119 | 10.2 | N/A | |
| UKIP | Leonard Bruce | 376 | 3.4 | N/A | |
| UKIP | Andrew David Manning | 326 | 2.9 | N/A | |
| Turnout | 52.1 | ||||
| Conservative win (new seat) | |||||
| Conservative win (new seat) | |||||
| Party | Candidate | Votes | % | ± | |
|---|---|---|---|---|---|
| Conservative | David Harty | 3,598 | 25.9 | N/A | |
| Conservative | Sharon Rosemary Lee | 3,342 | 24.1 | N/A | |
| Liberal Democrat | Robert William Joseph Eaton | 2,388 | 17.2 | N/A | |
| Liberal Democrat | Gordon Sydney Edward Thorpe | 2,017 | 14.6 | N/A | |
| Labour | Janet Boston | 1,272 | 9.2 | N/A | |
| Labour | Patricia Anne Nicholls | 1,240 | 8.9 | N/A | |
| Turnout | 55.9 | ||||
| Conservative win (new seat) | |||||
| Conservative win (new seat) | |||||
| Party | Candidate | Votes | % | ± | |
|---|---|---|---|---|---|
| Conservative | Lawrence Walter McGuire | 3,454 | 26.2 | N/A | |
| Conservative | William George Martin Hensley | 3,108 | 23.6 | N/A | |
| Labour | Margaret Cochrane | 2,009 | 15.2 | N/A | |
| Liberal Democrat | John Robert Davidson | 1,727 | 13.1 | N/A | |
| Labour | Graeme Leslie Watkins | 1,573 | 11.9 | N/A | |
| Liberal Democrat | Janet Siobhan Nevin Dutton | 1,328 | 10.1 | N/A | |
| Turnout | 54.8 | ||||
| Conservative win (new seat) | |||||
| Conservative win (new seat) | |||||
| Party | Candidate | Votes | % | ± | |
|---|---|---|---|---|---|
| Conservative | Susan Bridget Normington | 1,737 | 46.3 | N/A | |
| Liberal Democrat | Raymond Powell | 1,412 | 37.6 | N/A | |
| Labour | Carol Ann Harper | 603 | 16.1 | N/A | |
| Turnout | 58.9 | ||||
| Conservative win (new seat) | |||||
| Party | Candidate | Votes | % | ± | |
|---|---|---|---|---|---|
| Conservative | John Keith Walters | 2,898 | 58.1 | N/A | |
| Liberal Democrat | Martin Graham Land | 1,244 | 24.9 | N/A | |
| Labour | Mary Theresa Howell | 846 | 16.9 | N/A | |
| Turnout | 67.9 | ||||
| Conservative win (new seat) | |||||
| Party | Candidate | Votes | % | ± | |
|---|---|---|---|---|---|
| Conservative | John Ackerly Penhall Eddy | 2,386 | 49.2 | N/A | |
| Liberal Democrat | Anthony Bell Hulme | 1,814 | 37.4 | N/A | |
| Labour | Mark George Harry Holman | 649 | 13.38 | N/A | |
| Turnout | 66.5 | ||||
| Conservative win (new seat) | |||||
| Party | Candidate | Votes | % | ± | |
|---|---|---|---|---|---|
| Conservative | Kevin Antony Reynolds | 3,747 | 23.8 | N/A | |
| Conservative | Dennis Roy Pegram | 3,229 | 20.5 | N/A | |
| Liberal Democrat | David Frederick Hodge | 2,691 | 17.1 | N/A | |
| Liberal Democrat | Gillian Ann Jackson | 2,471 | 15.7 | N/A | |
| Labour | Richard John Allen | 1,368 | 8.7 | N/A | |
| Labour | Angela Louise Richards | 1,191 | 7.6 | N/A | |
| Independent | Stuart Frederick Littlewood | 1,046 | 6.7 | N/A | |
| Turnout | 55.5 | ||||
| Conservative win (new seat) | |||||
| Conservative win (new seat) | |||||
| Party | Candidate | Votes | % | ± | |
|---|---|---|---|---|---|
| Liberal Democrat | Sandra Anne Giles | 2,405 | 20.8 | N/A | |
| Conservative | Rodney Samuel Farrer | 2,293 | 19.9 | N/A | |
| Liberal Democrat | Ian Pele Taylor | 2,055 | 17.8 | N/A | |
| Conservative | Paul Keith Ursell | 1,935 | 16.8 | N/A | |
| Labour | Anthony Jude Gregory | 1,524 | 13.2 | N/A | |
| Labour | William Francis O'Connor | 1,337 | 11.6 | N/A | |
| Turnout | 50.6 | ||||
| Liberal Democrat win (new seat) | |||||
| Conservative win (new seat) | |||||
| Party | Candidate | Votes | % | ± | |
|---|---|---|---|---|---|
| Conservative | Ian Cyril Bates | 2,598 | 52.8 | N/A | |
| Liberal Democrat | Mark George Rainer | 1,657 | 33.7 | N/A | |
| Labour | John Philip Watson | 662 | 13.5 | N/A | |
| Turnout | 69.8 | ||||
| Conservative win (new seat) | |||||
| Party | Candidate | Votes | % | ± | |
|---|---|---|---|---|---|
| Conservative | Victor Harold Lucas | 2,544 | 55.4 | N/A | |
| Liberal Democrat | John Michael Souter | 1,489 | 32.4 | N/A | |
| Labour | Steven Hicks | 563 | 12.3 | N/A | |
| Turnout | 64.6 | ||||
| Conservative win (new seat) | |||||
South Cambridgeshire (16 seats)
| Party | Candidate | Votes | % | ± | |
|---|---|---|---|---|---|
| Conservative | John Edward Reynolds | 2,266 | 45.8 | N/A | |
| Liberal Democrat | Thomas Joseph Flanagan | 1,808 | 36.6 | N/A | |
| Labour | John Samuel Shepherd | 870 | 17.6 | N/A | |
| Turnout | 69.5 | ||||
| Conservative win (new seat) | |||||
| Party | Candidate | Votes | % | ± | |
|---|---|---|---|---|---|
| Conservative | Linda Joan Oliver | 1,981 | 54.4 | N/A | |
| Liberal Democrat | Ashley Woodford | 982 | 26.9 | N/A | |
| Green | Simon Peter Saggers | 679 | 18.6 | N/A | |
| Turnout | 67.3 | ||||
| Conservative win (new seat) | |||||
| Party | Candidate | Votes | % | ± | |
|---|---|---|---|---|---|
| Conservative | Lister John Wilson | 1,125 | 45.3 | N/A | |
| Liberal Democrat | Jonathan Rolf Hansford | 807 | 32.5 | N/A | |
| Labour | Mark David Hurn | 406 | 16.4 | N/A | |
| Green | Pauline Radley | 143 | 5.8 | N/A | |
| Turnout | 68.8 | ||||
| Conservative win (new seat) | |||||
| Party | Candidate | Votes | % | ± | |
|---|---|---|---|---|---|
| Conservative | Matthew Bradney | 3,269 | 21.3 | N/A | |
| Liberal Democrat | John David Jenkins | 3,213 | 20.9 | N/A | |
| Conservative | Peter Cecil Henry Hudson | 2,717 | 17.7 | N/A | |
| Liberal Democrat | Linden Mary Leeke | 2,377 | 15.5 | N/A | |
| Labour | Helen Patricia Wright | 1,453 | 9.5 | N/A | |
| Labour | Aidan Romaine Hervey | 1,357 | 8.9 | N/A | |
| Green | Mark Johan Alexander Claessen | 949 | 6.2 | N/A | |
| Turnout | 61.7 | ||||
| Conservative win (new seat) | |||||
| Liberal Democrat win (new seat) | |||||
| Party | Candidate | Votes | % | ± | |
|---|---|---|---|---|---|
| Liberal Democrat | Timothy James Stone | 2,140 | 43.9 | N/A | |
| Conservative | Robin Driver | 2,100 | 43.1 | N/A | |
| Labour | Alexandra Mayer | 634 | 13.0 | N/A | |
| Turnout | 72.9 | ||||
| Liberal Democrat win (new seat) | |||||
| Party | Candidate | Votes | % | ± | |
|---|---|---|---|---|---|
| Conservative | Robert John Turner | 2,010 | 43.2 | N/A | |
| Liberal Democrat | Frances Aisha Roberts Amrani | 1,939 | 41.7 | N/A | |
| Green | Mary Anne Lawson | 705 | 15.2 | N/A | |
| Turnout | 61.1 | ||||
| Conservative win (new seat) | |||||
| Party | Candidate | Votes | % | ± | |
|---|---|---|---|---|---|
| Liberal Democrat | Sebastian Gerald Molesworth Kindersley | 2,541 | 45.1 | N/A | |
| Conservative | Josephine Percy | 2,084 | 36.9 | N/A | |
| Labour | Mirian Lynn | 663 | 11.8 | N/A | |
| Green | Stephen Roy Edmondson | 347 | 6.2 | N/A | |
| Turnout | 72.8 | ||||
| Liberal Democrat win (new seat) | |||||
| Party | Candidate | Votes | % | ± | |
|---|---|---|---|---|---|
| Conservative | Denzil John Baldwin | 2,168 | 41.3 | N/A | |
| Liberal Democrat | Livia Medb Mitson | 1,855 | 35.4 | N/A | |
| Labour | John Kazer | 786 | 14.9 | N/A | |
| Green | William Michael Connolley | 438 | 8.4 | N/A | |
| Turnout | 71.8 | ||||
| Conservative win (new seat) | |||||
| Party | Candidate | Votes | % | ± | |
|---|---|---|---|---|---|
| Liberal Democrat | John Dennis Batchelor | 2,298 | 43.7 | N/A | |
| Conservative | Peter Norman Hase | 2,023 | 38.5 | N/A | |
| Labour | Michael Gale | 696 | 13.2 | N/A | |
| Green | William John Quinn | 240 | 4.6 | N/A | |
| Turnout | 72.8 | ||||
| Liberal Democrat win (new seat) | |||||
| Party | Candidate | Votes | % | ± | |
|---|---|---|---|---|---|
| Conservative | David Charles McCraith | 2,083 | 42.1 | N/A | |
| Liberal Democrat | Anthony Stuart Milton | 1,854 | 37.4 | N/A | |
| Labour | Donald John McCallum | 735 | 14.8 | N/A | |
| Green | Sally A S Nichols | 281 | 5.7 | N/A | |
| Turnout | 70.5 | ||||
| Conservative win (new seat) | |||||
| Party | Candidate | Votes | % | ± | |
|---|---|---|---|---|---|
| Conservative | Mandy Lorraine Smith | 2,033 | 52.5 | N/A | |
| Liberal Democrat | Robin Barry Martlew | 1,840 | 47.5 | N/A | |
| Turnout | 67.9 | ||||
| Conservative win (new seat) | |||||
| Party | Candidate | Votes | % | ± | |
|---|---|---|---|---|---|
| Conservative | Christine Gail Kenney | 3,270 | 20.2 | N/A | |
| Conservative | Anthony Geoffrey Orgee | 3,225 | 19.9 | N/A | |
| Liberal Democrat | Max Arnold Parke Campbell | 2,915 | 17.9 | N/A | |
| Liberal Democrat | David Terrance Ford | 2,829 | 17.5 | N/A | |
| Labour | Ronald Hornby | 1,577 | 9.7 | N/A | |
| Labour | Pamela Mary Stacey | 1,521 | 9.4 | N/A | |
| Green | Jacquelyn Jean Garfit | 877 | 5.4 | N/A | |
| Turnout | 61.8 | ||||
| Conservative win (new seat) | |||||
| Conservative win (new seat) | |||||
| Party | Candidate | Votes | % | ± | |
|---|---|---|---|---|---|
| Liberal Democrat | Robert Michael Williamson | 2,820 | 61.2 | N/A | |
| Conservative | Gerda Ann Covell | 1,789 | 38.8 | N/A | |
| Turnout | 63.4 | ||||
| Liberal Democrat win (new seat) | |||||
| Party | Candidate | Votes | % | ± | |
|---|---|---|---|---|---|
| Conservative | Shona Fay Johnstone | 2,011 | 46.7 | N/A | |
| Liberal Democrat | Rebecca Anne Mead | 1,825 | 42.3 | N/A | |
| Green | Marion Eva Barber | 475 | 11.0 | N/A | |
| Turnout | 65.8 | ||||
| Conservative win (new seat) | |||||
References
- ↑ "Election results and information for 2005". Cambridgeshire County Council. Retrieved 2012-04-18.
- ↑ "Local election results: Cambridgeshire". BBC News. Retrieved 2012-04-18.
- ↑ "Cambridgeshire". Andrew Teale. Retrieved 2012-04-18.
| Cambridgeshire County Council | |
|---|---|
| Peterborough City Council | |
| Cambridge City Council | |
| East Cambridgeshire District Council |
|
| Fenland District Council | |
| Huntingdonshire District Council | |
| South Cambridgeshire District Council | |
| Isle of Ely County Council |
|
| Huntingdon & Peterborough County Council |
|
| |
| County council elections |
|
|---|---|
| Unitary authorities |
|
| District councils (Northern Ireland) | |
| Sui generis |
|
| Mayoral elections |
|
| |