Basildon District Council election, 2008
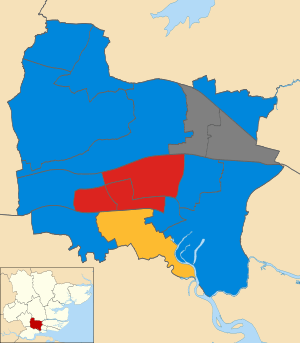
The 2008 Basildon District Council election took place on 1 May 2008 to elect members of Basildon District Council in Essex, England. One third of the council was up for election and the Conservative party stayed in overall control of the council.[1]
After the election, the composition of the council was
- Conservative 29
- Labour 10
- Liberal Democrats 3[2]
Candidates
The Conservative, Labour and British National parties stood in all 14 seats contested, which was an increase from 11 at the 2007 election for the British National party.[3] The Liberal Democrats stood in 13 wards, just not contesting Pitsea North West, while there were 4 United Kingdom Independence Party, 3 Green and 3 independent candidates.[3] The independent candidates included councillor Jane Dyer in Vange, after she left the Labour party just before the election,[4] and former councillor David Harrison in Wickford North.[3]
Election result
The results saw the Conservative increase their majority by 1 after taking Vange ward to hold 29 seats.[2] Conservative Luke Mackenzie became the youngest councillor in Basildon at the age of 22, after taking Vange from independent, formerly Labour, councillor Jane Dyer, who only received 72 votes in the election.[2] Labour remained on 10 seats, with the party 82 votes behind the Conservatives in the contest in Vange.[2] Meanwhile, the Liberal Democrats remained on 3 seats, but finished behind the British National Party in the share of the vote.[2] Overall turnout in the election was 29%.[5]
Following the election Lynda Gordon became the first female group leader on Basildon council, after taking over from Nigel Smith as leader of the Labour group.[6] Smith had declared that he would step down as leader of the Labour group before the election.[6]
| Basildon Local Election Result 2008[7][2] | ||||||||||
|---|---|---|---|---|---|---|---|---|---|---|
| Party | Seats | Gains | Losses | Net gain/loss | Seats % | Votes % | Votes | +/− | ||
| Conservative | 10 | 1 | 0 | +1 | 71.4 | 47.5 | 15,936 | +4.3% | ||
| Labour | 3 | 0 | 0 | 0 | 21.4 | 20.8 | 6,982 | -1.5% | ||
| Liberal Democrat | 1 | 0 | 0 | 0 | 7.1 | 11.5 | 3,851 | -1.4% | ||
| BNP | 0 | 0 | 0 | 0 | 0 | 14.1 | 4,743 | +2.1% | ||
| Independent | 0 | 0 | 1 | -1 | 0 | 3.3 | 1,093 | -4.5% | ||
| UKIP | 0 | 0 | 0 | 0 | 0 | 2.0 | 669 | +0.8% | ||
| Green | 0 | 0 | 0 | 0 | 0 | 0.8 | 266 | +0.2% | ||
Ward results
| Party | Candidate | Votes | % | ± | |
|---|---|---|---|---|---|
| Conservative | Stuart Sullivan | 1,932 | 65.8 | +21.6 | |
| Liberal Democrat | Roger Hatch | 428 | 14.6 | -20.7 | |
| BNP | Geoffrey McCarthy | 220 | 7.5 | -4.6 | |
| Labour | Patricia Reid | 206 | 7.0 | -1.3 | |
| UKIP | Susan McCaffery | 152 | 5.2 | +5.2 | |
| Majority | 1,504 | 51.2 | +42.2 | ||
| Turnout | 2,938 | 32 | -2 | ||
| Conservative hold | Swing | ||||
| Party | Candidate | Votes | % | ± | |
|---|---|---|---|---|---|
| Conservative | Philip Turner | 2,145 | 71.1 | +5.4 | |
| Liberal Democrat | Belinda Jackson | 332 | 11.0 | -4.4 | |
| Labour | Wendy Aitken | 239 | 7.9 | +0.0 | |
| BNP | Michael Bateman | 200 | 6.6 | -4.4 | |
| UKIP | Cherry Young | 99 | 3.3 | +3.3 | |
| Majority | 1,813 | 60.1 | +9.8 | ||
| Turnout | 3,015 | 32 | -1 | ||
| Conservative hold | Swing | ||||
| Party | Candidate | Votes | % | ± | |
|---|---|---|---|---|---|
| Conservative | Richard Moore | 1,967 | 64.9 | +2.0 | |
| BNP | Irene Bateman | 407 | 13.4 | +2.3 | |
| Liberal Democrat | Geoffrey Taylor | 384 | 12.7 | -2.5 | |
| Labour | Margaret Viney | 275 | 9.1 | -1.7 | |
| Majority | 1,506 | 51.4 | +3.7 | ||
| Turnout | 3,033 | 36 | -0 | ||
| Conservative hold | Swing | ||||
| Party | Candidate | Votes | % | ± | |
|---|---|---|---|---|---|
| Conservative | Stuart Allen | 1,311 | 68.5 | +7.7 | |
| BNP | Carolyn Rossiter | 251 | 13.1 | -0.4 | |
| Labour | Anthony Borlase | 218 | 11.4 | +0.9 | |
| Liberal Democrat | Jennifer Cole | 135 | 7.0 | +0.4 | |
| Majority | 1,060 | 55.4 | +8.1 | ||
| Turnout | 1,915 | 30 | -6 | ||
| Conservative hold | Swing | ||||
| Party | Candidate | Votes | % | ± | |
|---|---|---|---|---|---|
| Labour | Paul Kirkman | 1,013 | 40.1 | -2.0 | |
| Conservative | Jim Devlin | 636 | 25.2 | +2.0 | |
| BNP | Leonard Heather | 628 | 24.9 | +2.0 | |
| Liberal Democrat | John Lutton | 250 | 9.9 | -1.9 | |
| Majority | 377 | 14.9 | -3.9 | ||
| Turnout | 2,527 | 27 | -1 | ||
| Labour hold | Swing | ||||
| Party | Candidate | Votes | % | ± | |
|---|---|---|---|---|---|
| Conservative | Frank Tomlin | 1,020 | 45.1 | +11.8 | |
| Labour | David Kirkman | 661 | 29.2 | +4.7 | |
| BNP | David King | 387 | 17.1 | +5.5 | |
| Liberal Democrat | Jonathan Myall | 193 | 8.5 | +4.9 | |
| Majority | 359 | 15.9 | +7.0 | ||
| Turnout | 2,261 | 27 | -4 | ||
| Conservative hold | Swing | ||||
| Party | Candidate | Votes | % | ± | |
|---|---|---|---|---|---|
| Conservative | Stephen Hillier | 1,176 | 57.6 | -5.0 | |
| Labour | William Archibald | 283 | 13.9 | -2.5 | |
| BNP | Kevin Swaby | 197 | 9.6 | +9.6 | |
| UKIP | Imelda Clancy | 152 | 7.4 | +7.4 | |
| Liberal Democrat | Emma Peall | 130 | 6.4 | -4.7 | |
| Green | Annie Humphries | 104 | 5.1 | -4.8 | |
| Majority | 893 | 43.7 | -2.5 | ||
| Turnout | 2,042 | 30 | -5 | ||
| Conservative hold | Swing | ||||
| Party | Candidate | Votes | % | ± | |
|---|---|---|---|---|---|
| Labour | Lynda Gordon | 972 | 43.8 | +4.3 | |
| Conservative | Mark Coxshall | 604 | 27.2 | -1.1 | |
| BNP | Jay Slaven | 358 | 16.1 | -0.2 | |
| Liberal Democrat | Stephen Nice | 160 | 7.2 | -2.6 | |
| Green | Ernest Humphries | 126 | 5.7 | -0.3 | |
| Majority | 368 | 16.6 | +5.4 | ||
| Turnout | 2,220 | 25 | -0 | ||
| Labour hold | Swing | ||||
| Party | Candidate | Votes | % | ± | |
|---|---|---|---|---|---|
| Liberal Democrat | Geoff Williams | 1,247 | 43.0 | -8.0 | |
| Conservative | Kerry Whitaker | 697 | 24.1 | -6.6 | |
| Labour | Mark Witzer | 495 | 17.1 | -1.2 | |
| BNP | Mark Henry | 459 | 15.8 | +15.8 | |
| Majority | 550 | 19.0 | -1.3 | ||
| Turnout | 2,898 | 33 | +0 | ||
| Liberal Democrat hold | Swing | ||||
| Party | Candidate | Votes | % | ± | |
|---|---|---|---|---|---|
| Conservative | Andrew Baggott | 945 | 40.7 | +7.3 | |
| Labour | Emma Collins | 739 | 31.9 | -2.4 | |
| BNP | Raymond Pearce | 370 | 15.9 | -1.0 | |
| UKIP | Terry McBride | 266 | 11.5 | +3.7 | |
| Majority | 205 | 8.9 | |||
| Turnout | 2,320 | 25 | +2 | ||
| Conservative hold | Swing | ||||
| Party | Candidate | Votes | % | ± | |
|---|---|---|---|---|---|
| Conservative | Ann Blake | 1,255 | 52.0 | +5.3 | |
| Labour | Richard Llewellyn | 604 | 25.0 | -6.1 | |
| BNP | Sidney Chaney | 383 | 15.9 | +0.7 | |
| Liberal Democrat | Vivien Howard | 171 | 7.1 | +7.1 | |
| Majority | 651 | 27.0 | +11.4 | ||
| Turnout | 2,413 | 27 | -1 | ||
| Conservative hold | Swing | ||||
| Party | Candidate | Votes | % | ± | |
|---|---|---|---|---|---|
| Labour | Philip Rackley | 539 | 38.1 | -3.2 | |
| Conservative | Gwen Ball | 408 | 28.8 | +5.9 | |
| BNP | Philip Howell | 305 | 21.6 | +0.1 | |
| Liberal Democrat | Michael Dickinson | 163 | 11.5 | +0.9 | |
| Majority | 131 | 9.3 | -9.1 | ||
| Turnout | 1,415 | 24 | -3 | ||
| Labour hold | Swing | ||||
| Party | Candidate | Votes | % | ± | |
|---|---|---|---|---|---|
| Conservative | Luke MacKenzie | 590 | 35.8 | +0.9 | |
| Labour | Santa Bennett | 508 | 30.9 | -7.8 | |
| BNP | Rodney Leveridge | 289 | 17.6 | -8.8 | |
| Liberal Democrat | Philip Jenkins | 104 | 6.3 | +6.3 | |
| Independent | Jane Dyer | 72 | 4.4 | +4.4 | |
| Independent | David Aitken | 47 | 2.9 | +2.9 | |
| Green | Dean Hall | 36 | 2.2 | +2.2 | |
| Majority | 82 | 5.0 | |||
| Turnout | 1,646 | 24 | -4 | ||
| Conservative gain from Independent | Swing | ||||
| Party | Candidate | Votes | % | ± | |
|---|---|---|---|---|---|
| Conservative | Carole Morris | 1,250 | 43.1 | -9.6 | |
| Independent | David Harrison | 974 | 33.6 | -0.2 | |
| BNP | Anthony Gladwin | 289 | 10.0 | +10.0 | |
| Labour | Christopher Wilson | 230 | 7.9 | -5.6 | |
| Liberal Democrat | Michael Woods | 154 | 5.3 | +5.3 | |
| Majority | 276 | 9.5 | -9.4 | ||
| Turnout | 2,897 | 31 | -2 | ||
| Conservative hold | Swing | ||||
References
- ↑ "Basildon". BBC News Online. Retrieved 1 July 2011.
- 1 2 3 4 5 6 7 "Basildon: Tories maintain stranglehold". Echo. 2 May 2008. Retrieved 2 July 2011.
- 1 2 3 Austin, Jon (7 April 2008). "BNP to stand in every ward in May elections". Echo. Retrieved 2 July 2011.
- ↑ Austin, Jon (8 April 2008). "Leader hits out at former colleague". Echo. Retrieved 2 July 2011.
- ↑ "Tories hold their grip in Basildon local elections". Echo. 7 May 2010. Retrieved 2 July 2011.
- 1 2 "Lynda Gordon leads Basildon Labour group". Echo. 8 May 2008. Retrieved 2 July 2011.
- 1 2 3 4 5 6 7 8 9 10 11 12 13 14 15 "Basildon District Council Election - Thursday, 1st May, 2008". Basildon Borough Council. Retrieved 1 July 2011.