South Down (UK Parliament constituency)
| South Down | |
|---|---|
|
County constituency for the House of Commons | |
|
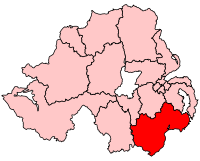
Boundary of South Down in Northern Ireland. | |
| Current constituency | |
| Created | 1950 |
| Member of parliament | Margaret Ritchie (Social Democratic and Labour) |
| Created from | Down |
| 1885–1922 | |
| Replaced by | Down |
| Created from | Down |
| Overlaps | |
| European Parliament constituency | Northern Ireland |
South Down is a parliamentary constituency in the United Kingdom House of Commons. It has been represented since 2010 by Margaret Ritchie, of the Social Democratic and Labour Party.
Boundaries

The county constituency was first created in 1885 from the southern part of Down. It was defined as including 'The Baronies of – Iveagh Upper, Lower Half, Lordship of Newry, and Mourne, and so much of the Barony of Iveagh Upper, Upper Half, as comprises the Parishes of – Clonallan, Donaghmore, Drumgath, Kilbroney, and Warrenpoint.'.[1] In 1918, it was redefined as including 'The rural district of Newry No. 1; the part of the rural district of Kilkeel which is not included in the East Down Division; and the urban districts of Newcastle, Newry and Warrenpoint.'[2] From the dissolution of Parliament in 1922, it was merged back into Down. Maps showing the component units of the constituency can be seen here.
The seat was re-created in 1950 when the old Down two MP constituency was abolished as part of the final move to single member seats. Originally the seat consisted of most of the mid and southern parts of County Down, with the north included in North Down. It was defined as including '(i) The urban districts of Banbridge, Downpatrick, Dromore, Kilkeel, Newcastle, Newry and Warrenpoint; (ii) the rural districts of Banbridge, Downpatrick, Kilkeel, Moira and Newry No. 1.'[3] Of the post 1973 districts, it contained all of Down and Banbridge, together with parts of Newry and Mourne, Ards and Craigavon.
In 1983 the seat was radically cut down as part of an expansion of Northern Ireland's constituencies from 12 to 17. Significant parts of the constituency were transferred to either Upper Bann or Newry and Armagh. The composition of the seat in 1983 was the entire district of Down, the Annaclone, Ballyoolymore, Croob, Dromore, Drumadonnell, Garran, Quilly and Skeagh electoral wards of Banbridge, and the Annalong, Ballycrossan, Binnian, Clonallan, Cranfield, Donaghmore, Drumgath, Kilkeel, Lisnacree, Rathfriland, Rostrevor, Seaview, and Spelga wards from Newry and Mourne.[4]
In boundary changes proposed by a review in 1995, the seat was originally to be abolished and replaced by a new Mid Down constituency. This provoked a storm of protest and following a local enquiry minor changes were made with the seat losing one small section to Lagan Valley and another to Strangford. It still consists of parts of Down, Banbridge and Newry and Mourne districts.
In 2005, the Boundary Commission published provisional recommendations for modifying the boundaries of constituencies in Northern Ireland. For South Down, it originally proposed to add part of Newry from Newry and Armagh and the Loughbrickland part of Banbridge district from Upper Bann, while losing some more of Down to Strangford. These changes were challenged in a round of public consultations, with the result that revised recommendations were made. Under the new proposals, the Newry area remained in Newry and Armagh and Loughbrickland in Upper Bann. This meant that only 4 wards around the town of Ballynahinch were transferred to Strangford. These changes became the final recommendations and were given legal effect in 2008.
History
1885 to 1922
The constituency was a predominantly Nationalist area in 1918. The Unionists had significant but minority support. The Sinn Féin candidate polled poorly, probably due to the limited electoral pact to avoid seriously splitting the anti-unionist vote in seats the unionist candidate might have otherwise won.
The First Dáil
Sinn Féin contested the general election of 1918 on a platform that instead of taking up any seats they won in the United Kingdom Parliament, they would establish a revolutionary assembly in Dublin. In republican theory every MP elected in Ireland was a potential Deputy to this assembly. In practice only the Sinn Féin members accepted the offer and their candidate Éamon de Valera only received 0.2% of the votes in South Down, while being elected unopposed for East Clare; the nationalist Jeremiah McVeagh, elected as IPP MP for South Down, did not participate in the First Dáil.
In 1921 Sinn Féin decided to use the UK authorised elections for the Northern Ireland House of Commons and the House of Commons of Southern Ireland as a poll for the Irish Republic's Second Dáil. This area, in republican theory, was incorporated in a potential eight-member Dáil constituency of Down.
1950 to present
When initially created this seat had a clear unionist majority, albeit with a strong nationalist minority. However boundary changes, which have wrapped it closer around nationalist heartlands near Downpatrick and the Mournes have transformed South Down into a safe nationalist seat.
The Westminster seat was consistently held by the Ulster Unionist Party from its creation until 1987. In the October 1974 general election the former Conservative MP Enoch Powell defended the seat for the UUP, representing a coup for them as they gained the support of a high profile English politician, offering them a spokesperson to the United Kingdom as a whole.
Powell advocated a policy of integration for Northern Ireland whereby all forms of devolution would be wound up and the province governed as an integral part of the United Kingdom. As part of this he campaigned for the province to have the same ratio of MPs to population as in the rest of the United Kingdom, rather than fewer, which had previously been justified due to the existence of the devolved Stormont Parliament. Powell was successful in this but a side effect was that in his own constituency a significant block of unionist voters were removed, resulting in a nationalist majority. Powell managed to survive due to a split nationalist vote, but in 1987 he narrowly lost to Eddie McGrady of the Social Democratic and Labour Party, who held the seat until retiring in 2010.
Since then the unionist vote has declined further due to boundary changes, which excluded mainly unionist Dromore and Saintfield, and a trend for many unionists to tactically vote for the SDLP at Westminster elections to avoid the seat falling to Sinn Féin.
Members of Parliament
The Member of Parliament since the 2010 general election has been Margaret Ritchie of the Social Democratic and Labour Party. She succeeded fellow SDLP MP Eddie McGrady, who had held the seat since 1987 when he defeated Enoch Powell of the Ulster Unionist Party, who had represented the seat since October 1974.
- In this section by-elections are indicated by an asterisk after the date.
| Election | Member | Party | |
|---|---|---|---|
| 1885 | constituency created | ||
| 1885 | John Francis Small | Irish Parliamentary | |
| 1886 | Michael McCartan | Irish Parliamentary | |
| 1892 | Irish National Federation | ||
| 1900 | Irish Parliamentary | ||
| 1902 * | Jeremiah McVeagh | Irish Parliamentary | |
| 1922 | constituency abolished – see Down | ||
| 1950 | constituency re-created | ||
| 1950 | Lawrence Orr | Ulster Unionist | |
| Oct 1974 | Enoch Powell | Ulster Unionist | |
| 1987 | Eddie McGrady | Social Democratic and Labour | |
| 2010 | Margaret Ritchie | Social Democratic and Labour | |
Elections
Elections in the 2010s
| Party | Candidate | Votes | % | ± | |
|---|---|---|---|---|---|
| SDLP | Margaret Ritchie[7] | 18,077 | 42.3 | -6.1 | |
| Sinn Féin | Chris Hazzard[7] | 12,186 | 28.5 | -0.2 | |
| UUP | Harold McKee | 3,964 | 9.3 | +2.0 | |
| DUP | Jim Wells | 3,486 | 8.2 | -0.4 | |
| UKIP | Henry Reilly[7] | 3,044 | 7.1 | n/a | |
| Alliance | Martyn Todd[7] | 1,622 | 3.8 | +2.5 | |
| NI Conservatives | Felicity Buchan | 318 | 0.7 | n/a | |
| Majority | 5,891 | 13.8 | -6.0 | ||
| Turnout | 42,589 | 56.8 | -3.4 | ||
| SDLP hold | Swing | -2.9 | |||
| Party | Candidate | Votes | % | ± | |
|---|---|---|---|---|---|
| SDLP | Margaret Ritchie | 20,648 | 48.5 | 1.6 | |
| Sinn Féin | Caitríona Ruane | 12,236 | 28.7 | 1.7 | |
| DUP | Jim Wells | 3,645 | 8.6 | -7.6 | |
| UCU-NF | John McCallister | 3,093 | 7.3 | -1.5 | |
| TUV | Ivor McConnell | 1,506 | 3.5 | 3.5 | |
| Green (NI) | Cadogan Enright | 901 | 2.1 | 2.1 | |
| Alliance | David Griffin | 560 | 1.3 | 0 | |
| Majority | 8,412 | 19.8 | |||
| Turnout | 42,589 | 60.2 | -8.5 | ||
| SDLP hold | Swing | 0.1 | |||
Elections in the 2000s
| Party | Candidate | Votes | % | ± | |
|---|---|---|---|---|---|
| SDLP | Eddie McGrady | 21,557 | 44.7 | -1.6 | |
| Sinn Féin | Caitriona Ruane | 12,417 | 25.8 | +6.1 | |
| DUP | Jim Wells | 8,815 | 18.3 | +3.3 | |
| UUP | Dermot Nesbitt | 4,775 | 9.9 | -7.7 | |
| Alliance | Julian Crozier | 613 | 1.3 | 0.0 | |
| Majority | 9,140 | 19.0 | |||
| Turnout | 48,177 | 65.4 | -5.4 | ||
| SDLP hold | Swing | -3.8 | |||
| Party | Candidate | Votes | % | ± | |
|---|---|---|---|---|---|
| SDLP | Eddie McGrady | 24,136 | 46.3 | -6.6 | |
| Sinn Féin | Mick Murphy | 10,278 | 19.7 | +9.4 | |
| UUP | Dermot Nesbitt | 9,173 | 17.6 | -15.2 | |
| DUP | Jim Wells | 7,802 | 15.0 | 0.0 | |
| Alliance | Betty Campbell | 685 | 1.3 | -2.1 | |
| Majority | 13,858 | 26.6 | |||
| Turnout | 52,074 | 70.8 | 0.0 | ||
| SDLP hold | Swing | ||||
Elections in the 1990s
| Party | Candidate | Votes | % | ± | |
|---|---|---|---|---|---|
| SDLP | Eddie McGrady | 26,181 | 52.9 | ||
| UUP | Dermot Nesbitt | 16,248 | 32.8 | ||
| Sinn Féin | Mick Murphy | 5,127 | 10.4 | ||
| Alliance | Julian Crozier | 1,711 | 3.5 | ||
| Natural Law | Rosaleen McKeon | 219 | 0.4 | ||
| Majority | 9,933 | ||||
| Turnout | 70.8 | ||||
| SDLP hold | Swing | ||||
| Party | Candidate | Votes | % | ± | |
|---|---|---|---|---|---|
| SDLP | Eddie McGrady | 31,523 | 51.2 | ||
| UUP | Drew Nelson | 25,181 | 40.9 | ||
| Sinn Féin | Sean Fitzpatrick | 1,843 | 3.0 | ||
| Alliance | Michael Healey | 1,542 | 2.5 | ||
| NI Conservatives | Stephanie McKenzie-Hill | 1,488 | 2.4 | ||
| Majority | 6,342 | ||||
| Turnout | 80.9 | ||||
| SDLP hold | Swing | ||||
Elections in the 1980s
| Party | Candidate | Votes | % | ± | |
|---|---|---|---|---|---|
| SDLP | Eddie McGrady | 26,579 | 47.0 | ||
| UUP | Enoch Powell | 25,848 | 45.7 | ||
| Sinn Féin | Geraldine Ritchie | 2,363 | 4.2 | ||
| Alliance | Siobhan Laird | 1,069 | 1.9 | ||
| Workers' Party | Des O'Hagan | 675 | 1.2 | ||
| Majority | 731 | 1.3 | |||
| Turnout | 79.4 | ||||
| SDLP gain from UUP | Swing | ||||
| Party | Candidate | Votes | % | ± | |
|---|---|---|---|---|---|
| UUP | Enoch Powell | 24,963 | 48.4 | ||
| SDLP | Eddie McGrady | 23,121 | 44.8 | ||
| Sinn Féin | Hugh McDowell | 2,963 | 5.7 | ||
| Workers' Party | Sean Magee | 522 | 1 | ||
| Majority | 1,842 | ||||
| Turnout | |||||
| UUP hold | Swing | ||||
| Party | Candidate | Votes | % | ± | |
|---|---|---|---|---|---|
| UUP | Enoch Powell | 20,693 | 40.3 | ||
| SDLP | Eddie McGrady | 20,145 | 39.3 | ||
| Sinn Féin | Patrick Fitzsimmons | 4,074 | 7.9 | ||
| DUP | Cecil Harvey | 3,743 | 7.3 | ||
| Alliance | Patrick Forde | 1,823 | 3.6 | ||
| Workers' Party | Margaret Magee | 851 | 1.7 | ||
| Majority | 548 | 1.1 | |||
| Turnout | 77.7 | ||||
| UUP hold | Swing | ||||
Elections in the 1970s
| Party | Candidate | Votes | % | ± | |
|---|---|---|---|---|---|
| UUP | Enoch Powell | 32,254 | 50.0 | ||
| SDLP | Eddie McGrady | 24,033 | 37.3 | ||
| Alliance | Patrick Forde | 4,407 | 6.8 | ||
| Irish Independence | John Markey | 1,853 | 2.9 | ||
| Republican Clubs | Des O'Hagan | 1,682 | 2.6 | ||
| Inter-Dependence Party | Francis Rice | 216 | 0.3 | ||
| Reform | Peter Courtney | 31 | 0.1 | ||
| Majority | 8,221 | 12.8 | |||
| Turnout | 72.0 | ||||
| UUP hold | Swing | ||||
| Party | Candidate | Votes | % | ± | |
|---|---|---|---|---|---|
| UUP | Enoch Powell | 33,614 | 50.8 | ||
| SDLP | Sean Hollywood | 30,047 | 45.4 | ||
| Republican Clubs | Gerard O'Hanlon | 2,327 | 3.5 | ||
| Marxist-Leninist (Ireland) | David Vipond | 152 | 0.2 | ||
| Majority | 3,567 | 5.4 | |||
| Turnout | 72.4 | ||||
| UUP hold | Swing | ||||
| Party | Candidate | Votes | % | ± | |
|---|---|---|---|---|---|
| UUP | Lawrence Orr | 31,088 | 52.1 | ||
| SDLP | Sean Hollywood | 25,486 | 42.8 | ||
| Republican Clubs | Hugh Golding | 3,046 | 5.1 | ||
| Majority | 5,602 | 9.4 | |||
| Turnout | 65.0 | ||||
| UUP hold | Swing | ||||
| Party | Candidate | Votes | % | ± | |
|---|---|---|---|---|---|
| UUP | Lawrence Orr | 34,894 | 54.3 | ||
| Unity | Hugh Golding | 21,676 | 33.7 | ||
| Liberal | John Quinn | 7,747 | 12.1 | ||
| Majority | 13,218 | 20.6 | |||
| Turnout | 74.0 | ||||
| UUP hold | Swing | ||||
Elections in the 1960s
| Party | Candidate | Votes | % | ± | |
|---|---|---|---|---|---|
| UUP | Lawrence Orr | 32,876 | 64.0 | ||
| Liberal | John Quinn | 9,586 | 18.7 | ||
| Independent Republican | George Mussen | 8,917 | 17.4 | ||
| Majority | 23,290 | 45.3 | |||
| Turnout | 65.8 | ||||
| UUP hold | Swing | ||||
| Party | Candidate | Votes | % | ± | |
|---|---|---|---|---|---|
| UUP | Lawrence Orr | 32,922 | 59.0 | ||
| Independent Republican | George Mussen | 11,031 | 19.8 | ||
| NI Labour | Samuel Thompson | 6,260 | 11.2 | ||
| Liberal | Hamilton Gooding | 5,610 | 10.1 | ||
| Majority | 21,891 | 39.2 | |||
| Turnout | 72.1 | ||||
| UUP hold | Swing | ||||
Elections in the 1950s
| Party | Candidate | Votes | % | ± | |
|---|---|---|---|---|---|
| UUP | Lawrence Orr | 36,875 | 85.4 | ||
| Sinn Féin | Kevin O'Rourke | 6,298 | 14.6 | ||
| Majority | 30,577 | 70.8 | |||
| Turnout | 55.6 | ||||
| UUP hold | Swing | ||||
| Party | Candidate | Votes | % | ± | |
|---|---|---|---|---|---|
| UUP | Lawrence Orr | 37,921 | 65.9 | ||
| Sinn Féin | Kevin O'Rourke | 19,624 | 34.1 | ||
| Majority | 18,297 | 31.8 | |||
| Turnout | 73.9 | ||||
| UUP hold | Swing | ||||
| Party | Candidate | Votes | % | ± | |
|---|---|---|---|---|---|
| UUP | Lawrence Orr | 37,789 | 58.4 | ||
| Independent Republican | Gerald Annesley | 26,976 | 41.6 | ||
| Majority | 10,813 | 16.7 | |||
| Turnout | 82.0 | ||||
| UUP hold | Swing | ||||
| Party | Candidate | Votes | % | ± | |
|---|---|---|---|---|---|
| UUP | Lawrence Orr | 38,508 | 63.5 | ||
| Irish Labour | Jack MacGougan | 22,176 | 36.5 | ||
| Majority | 16,332 | 26.9 | |||
| Turnout | 76.7 | ||||
| UUP hold | Swing | ||||
Elections in the 1910s
| Party | Candidate | Votes | % | ± | |
|---|---|---|---|---|---|
| Irish Parliamentary | Jeremiah McVeagh | 8,756 | 59.2% | N/A | |
| Irish Unionist | John Alexander Weir Johnston | 5,573 | 37.7% | N/A | |
| Independent | Alexander Fisher | 436 | 2.9% | N/A | |
| Sinn Féin | Éamon de Valera | 33 | 0.2% | N/A | |
| Majority | 3,183 | 21.5% | N/A | ||
| Turnout | 18,708 | N/A | |||
| Irish Parliamentary hold | Swing | N/A | |||
Elections in the 1900s
| Party | Candidate | Votes | % | ± | |
|---|---|---|---|---|---|
| Irish Parliamentary | Jeremiah McVeagh | 3,910 | N/A | ||
| Irish Unionist | Peter Kerr-Smiley | N/A | |||
| Majority | N/A | ||||
| Turnout | N/A | ||||
| Irish Parliamentary hold | Swing | N/A | |||
Irish Parliamentary Party candidate Jeremiah McVeagh was elected unopposed in a by-election 19 February 1902.[15]
| Party | Candidate | Votes | % | ± | |
|---|---|---|---|---|---|
| Irish National Federation | Michael McCartan | Unopposed | N/A | N/A | |
| Irish National Federation hold | Swing | N/A | |||
Elections in the 1890s
| Party | Candidate | Votes | % | ± | |
|---|---|---|---|---|---|
| Irish National Federation | Michael McCartan | 4,057 | 54.6 | +1.2 | |
| Liberal Unionist | T. Rowan | 3,378 | 45.4 | -0.7 | |
| Majority | 679 | ||||
| Turnout | 7,435 | ||||
| Irish National Federation hold | Swing | ||||
| Party | Candidate | Votes | % | ± | |
|---|---|---|---|---|---|
| Irish National Federation | Michael McCartan | 4,207 | 53.4 | +53.4 | |
| Liberal Unionist | J. W. Craig | 3,636 | 46.1 | +46.1 | |
| Parnellite Nationalist | E. Magenis | 42 | 0.5 | +0.5 | |
| Majority | 571 | 7.3 | |||
| Turnout | 7,885 | ||||
| Irish National Federation gain from Irish Parliamentary | Swing | ||||
Elections in the 1880s
| Party | Candidate | Votes | % | ± | |
|---|---|---|---|---|---|
| Irish Parliamentary | Michael McCartan | 4,786 | 55.6 | -1.6 | |
| Conservative | R. S. Corbett | 3,816 | 44.4 | +1.6 | |
| Majority | 970 | ||||
| Turnout | 8,602 | ||||
| Irish Parliamentary hold | Swing | ||||
| Party | Candidate | Votes | % | ± | |
|---|---|---|---|---|---|
| Irish Parliamentary | John Francis Small | 4,995 | 57.2 | +57.2 | |
| Conservative | W. H. Kisbey QC | 3,743 | 42.8 | +42.8 | |
| Majority | 1,252 | 14.4 | +14.4 | ||
| Turnout | 8,738 | ||||
| Irish Parliamentary hold | Swing | ||||
See also
References
- ↑ Redistribution of Seats Act, 1885, (Ch 23) Seventh Schedule, Part III – Ireland – County of Down
- ↑ Redistribution of Seats (Ireland) Act, 1918, (Ch 65) Fourth Schedule,
- ↑ Representation of the People Act, 1948 (Ch 65) First Schedule, Part IV – Northern Ireland – (a) County Constituencies
- ↑ Crewe, Ivor (1983). British Parliamentary Constituencies – a Statistical Compendium. faber and faber. ISBN 0-571-13236-7.
- ↑ "Election Data 2015". Electoral Calculus. Archived from the original on 17 October 2015. Retrieved 17 October 2015.
- ↑ http://www.eoni.org.uk/Elections/Election-results-and-statistics/Election-results-and-statistics-2003-onwards/Elections-2015/UK-Parliamentary-Election-Results/UK-Parliamentary-Election-Result-Belfast-East-(14) 25Aug15
- 1 2 3 4 https://yournextmp.com/constituency/66138/
- ↑ "Election Data 2010". Electoral Calculus. Archived from the original on 26 July 2013. Retrieved 17 October 2015.
- ↑ "Election Data 2005". Electoral Calculus. Archived from the original on 15 October 2011. Retrieved 18 October 2015.
- ↑ "Election Data 2001". Electoral Calculus. Archived from the original on 15 October 2011. Retrieved 18 October 2015.
- ↑ "Election Data 1997". Electoral Calculus. Archived from the original on 15 October 2011. Retrieved 18 October 2015.
- ↑ "Election Data 1992". Electoral Calculus. Archived from the original on 15 October 2011. Retrieved 18 October 2015.
- ↑ "Election Data 1987". Electoral Calculus. Archived from the original on 15 October 2011. Retrieved 18 October 2015.
- ↑ "Election Data 1983". Electoral Calculus. Archived from the original on 15 October 2011. Retrieved 18 October 2015.
- ↑ "Election intelligence". The Times (36696). London. 20 February 1902. p. 10.
Further reading
- Guardian Unlimited Politics (Election results from 1992 to the present)
- http://www.psr.keele.ac.uk/ (Election results from 1951 to the present)
- Leigh Rayment's Historical List of MPs – Constituencies beginning with "D" (part 3)
- Parliamentary Election Results in Ireland, 1801–1922, edited by B.M. Walker (Royal Irish Academy 1978)
- Who's Who of British members of parliament: Volume II 1886–1918, edited by M. Stenton and S. Lees (The Harvester Press 1978)
- Who's Who of British members of parliament: Volume III 1919–1945, edited by M. Stenton and S. Lees (The Harvester Press 1979)
- F. W. S. Craig, British Parliamentary Election Results 1950 – 1970
- The Liberal Year Book For 1917, Liberal Publication Department
- The Constitutional Year Book For 1912, Conservative Central Office
- The Constitutional Year Book For 1894, Conservative Central Office
External links
- http://www.oireachtas.ie/members-hist/default.asp?housetype=0
- http://historical-debates.oireachtas.ie/en.toc.dail.html