South Cambridgeshire District Council election, 2011

Elections to South Cambridgeshire District Council took place on Thursday 5 May 2011, as part of the United Kingdom local elections, 2011. Nineteen seats, making up one third of South Cambridgeshire District Council, were up for election. Seats up for election in 2011 were last contested at the 2007 election. The Conservative Party retained their majority on the council.
Summary
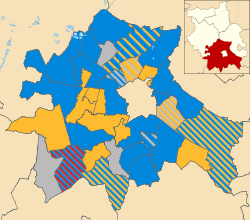
At this election, Conservatives were defending 11 seats, Liberal Democrats were defending six and independents were defending two seats. Two seats changed hands at this election, as the Conservatives gained both Duxford and Teversham wards from the Liberal Democrats, increasing their majority on the council. Teversham was won by the Conservatives in 2007, but had been gained by the Liberal Democrats in a 2008 by-election.[1]
In October 2011, independent councillor Alex Riley, Longstanton, joined the Conservatives, further increasing the number of Conservative councillors to 32.[2]
Results
| South Cambridgeshire District Council election, 2011[3] | |||||||
|---|---|---|---|---|---|---|---|
| Party | Seats | Popular vote | |||||
| Won | Not up | Total | ± | Votes | % | ||
| Conservative | 13 | 18 | 31 | +2 | 15,807 | 46.9 | |
| Liberal Democrats | 4 | 14 | 18 | −2 | 7,384 | 21.9 | |
| Labour | 0 | 1 | 1 | 0 | 6,140 | 18.2 | |
| Independent | 2 | 5 | 7 | 0 | 3,162 | 9.4 | |
| Green | 0 | 0 | 0 | 0 | 661 | 1.9 | |
| UKIP | 0 | 0 | 0 | 0 | 569 | 1.7 | |
| Total | 19 | 38 | 57 | – | 33,723 | – | |
| Turnout | 49.9 | ||||||
Results by ward
| Party | Candidate | Votes | % | ± | |
|---|---|---|---|---|---|
| Conservative | Richard Edwin George Barrett | 1,136 | 54.3 | −5.6 | |
| Liberal Democrat | Kerry Wilfred Cook | 590 | 28.2 | −8.1 | |
| Labour | Alex John Jacob | 277 | 13.3 | +9.5 | |
| UKIP | Timothy Mark Skottowe | 88 | 4.2 | N/A | |
| Majority | 546 | ||||
| Turnout | 57.5 | ||||
| Conservative hold | Swing | ||||
| Party | Candidate | Votes | % | ± | |
|---|---|---|---|---|---|
| Conservative | Roger Hall | 971 | 51.8 | −8.6 | |
| Labour | John Samuel Shepherd | 372 | 19.8 | +8.1 | |
| Liberal Democrat | Peter Robert Fane | 289 | 15.4 | +0.2 | |
| UKIP | Helene Yvette Davies | 244 | 13.0 | +0.3 | |
| Majority | 599 | ||||
| Turnout | 48.5 | ||||
| Conservative hold | Swing | ||||
| Party | Candidate | Votes | % | ± | |
|---|---|---|---|---|---|
| Conservative | Francis William Miles Burkitt | 774 | 73.5 | +23.1 | |
| Labour | Roger Tomlinson | 279 | 26.5 | +20.4 | |
| Majority | 495 | ||||
| Turnout | 55.2 | ||||
| Conservative hold | Swing | ||||
| Party | Candidate | Votes | % | ± | |
|---|---|---|---|---|---|
| Conservative | Alison Paula Elcox | 1,106 | 42.2 | −1.9 | |
| Independent | Roger Keith Hume | 582 | 22.2 | −19.7 | |
| Labour | Gavin John Clayton | 503 | 19.2 | +5.2 | |
| Liberal Democrat | Jon Hansford | 433 | 16.5 | N/A | |
| Majority | 524 | ||||
| Turnout | 41.3 | ||||
| Conservative hold | Swing | ||||
| Party | Candidate | Votes | % | ± | |
|---|---|---|---|---|---|
| Liberal Democrat | Stephen Harangozo | 558 | 52.7 | +4.5 | |
| Conservative | Tracy-Ann Neville | 397 | 37.5 | −6.7 | |
| Labour | Helen Mary Haugh | 104 | 9.8 | +2.2 | |
| Majority | 37 | ||||
| Turnout | 51.9 | ||||
| Liberal Democrat hold | Swing | ||||
| Party | Candidate | Votes | % | ± | |
|---|---|---|---|---|---|
| Conservative | Timothy John Wotherspoon | 1,453 | 48.1 | −8.9 | |
| Labour | Andrew Papworth | 723 | 23.9 | +14.0 | |
| Liberal Democrat | Alan John Leeks | 523 | 17.3 | −15.9 | |
| Green | Donald Allan McBride | 185 | 6.1 | N/A | |
| UKIP | Michael Eric Heaver | 139 | 4.6 | N/A | |
| Majority | 730 | ||||
| Turnout | 49.1 | ||||
| Conservative hold | Swing | ||||
| Party | Candidate | Votes | % | ± | |
|---|---|---|---|---|---|
| Conservative | Mick Martin | 574 | 47.6 | +6.7 | |
| Liberal Democrat | Clare Delderfield | 522 | 43.3 | −11.6 | |
| Labour | Dinah Elizabeth Pounds | 110 | 9.1 | +4.9 | |
| Majority | 52 | ||||
| Turnout | 57.7 | ||||
| Conservative gain from Liberal Democrat | Swing | ||||
| Party | Candidate | Votes | % | ± | |
|---|---|---|---|---|---|
| Independent | Deborah Patricia Roberts | 714 | 60.8 | +15.6 | |
| Conservative | Mark William Wykeham Howard | 320 | 27.2 | +5.9 | |
| Green | Colin Reynolds | 86 | 7.3 | N/A | |
| Labour | Angela Mary Patrick | 55 | 4.7 | +2.3 | |
| Majority | 394 | ||||
| Turnout | 62.1 | ||||
| Independent hold | Swing | ||||
| Party | Candidate | Votes | % | ± | |
|---|---|---|---|---|---|
| Independent | Neil John Scarr | 682 | 43.2 | +3.6 | |
| Conservative | Richard Michael Turner | 445 | 28.2 | +1.9 | |
| Labour | Tom Ruffles | 291 | 18.4 | +13.7 | |
| Liberal Democrat | Ian Douglas Wallace | 161 | 10.2 | −19.2 | |
| Majority | 237 | ||||
| Turnout | 45.8 | ||||
| Independent hold | Swing | ||||
| Party | Candidate | Votes | % | ± | |
|---|---|---|---|---|---|
| Liberal Democrat | Jim Stewart | 583 | 56.4 | −17.2 | |
| Conservative | John Edward Reynolds | 322 | 31.2 | +9.1 | |
| Labour | Norman Crowther | 128 | 12.4 | +8.2 | |
| Majority | 261 | ||||
| Turnout | 51.4 | ||||
| Liberal Democrat hold | Swing | ||||
| Party | Candidate | Votes | % | ± | |
|---|---|---|---|---|---|
| Liberal Democrat | Jonathan Peter Chatfield | 1,293 | 36.0 | −16.2 | |
| Independent | Neil Sinnett Davies | 1,184 | 33.0 | N/A | |
| Conservative | Steve Mastin | 635 | 17.7 | −22.5 | |
| Labour | Godson Lawal | 378 | 10.5 | +2.9 | |
| UKIP | Joe Webster | 98 | 2.7 | N/A | |
| Majority | 109 | ||||
| Turnout | 49.7 | ||||
| Liberal Democrat hold | Swing | ||||
| Party | Candidate | Votes | % | ± | |
|---|---|---|---|---|---|
| Liberal Democrat | Hazel Marion Smith | 807 | 54.3 | +2.9 | |
| Conservative | Gerda Ann Covell | 471 | 31.7 | −10.4 | |
| Labour | Alexandra Mayer | 209 | 14.1 | +7.5 | |
| Majority | 336 | ||||
| Turnout | 48.2 | ||||
| Liberal Democrat hold | Swing | ||||
| Party | Candidate | Votes | % | ± | |
|---|---|---|---|---|---|
| Conservative | Ted Ridgeway Watt | 534 | 56.9 | −26.3 | |
| Liberal Democrat | Anabela Pinto | 303 | 32.3 | N/A | |
| Labour | Susan Hailes | 101 | 10.8 | −5.9 | |
| Majority | 231 | ||||
| Turnout | 51.3 | ||||
| Conservative hold | Swing | ||||
| Party | Candidate | Votes | % | ± | |
|---|---|---|---|---|---|
| Conservative | Nicholas Ian Cecil Wright | 1,235 | 74.2 | 0.0 | |
| Labour | Peter Sarris | 429 | 25.8 | 0.0 | |
| Majority | 806 | ||||
| Turnout | 46.9 | ||||
| Conservative hold | Swing | ||||
| Party | Candidate | Votes | % | ± | |
|---|---|---|---|---|---|
| Conservative | David Roy Bard | 1,397 | 64.6 | −2.9 | |
| Labour | Martin Higgins | 767 | 35.4 | +20.3 | |
| Majority | 630 | ||||
| Turnout | 54.9 | ||||
| Conservative hold | Swing | ||||
| Party | Candidate | Votes | % | ± | |
|---|---|---|---|---|---|
| Conservative | Caroline Anne Hunt | 446 | 53.8 | +19.8 | |
| Liberal Democrat | Frances Aisha Roberts Amrani | 207 | 24.9 | −13.6 | |
| Labour | David Cornell | 176 | 21.2 | N/A | |
| Majority | 239 | ||||
| Turnout | 43.7 | ||||
| Conservative gain from Liberal Democrat | Swing | ||||
| Party | Candidate | Votes | % | ± | |
|---|---|---|---|---|---|
| Conservative | Tony Orgee | 782 | 81.9 | +0.7 | |
| Labour | Gill Taylor | 172 | 18.0 | N/A | |
| Majority | 610 | ||||
| Turnout | 54.7 | ||||
| Conservative hold | Swing | ||||
| Party | Candidate | Votes | % | ± | |
|---|---|---|---|---|---|
| Conservative | David Charles Whiteman-Downes | 1,503 | 49.1 | −5.1 | |
| Liberal Democrat | Michael Thomas Kilpatrick | 621 | 20.3 | −18.4 | |
| Labour | Mike Nettleton | 545 | 17.8 | +10.8 | |
| Green | Linda Whitebread | 390 | 12.8 | N/A | |
| Majority | 882 | ||||
| Turnout | 54.5 | ||||
| Conservative hold | Swing | ||||
| Party | Candidate | Votes | % | ± | |
|---|---|---|---|---|---|
| Conservative | Brian Roy Burling | 1,306 | 56.3 | +9.2 | |
| Labour | Ben Monks | 521 | 22.5 | +17.7 | |
| Liberal Democrat | Geoff Twiss | 494 | 21.3 | +0.3 | |
| Majority | 785 | ||||
| Turnout | 44.5 | ||||
| Conservative hold | Swing | ||||
References
- ↑ District Council By-Election: Teversham Ward - Thursday, 20 November 2008, South Cambridgeshire District Council
- ↑ http://www.scambs.gov.uk/documents/retrieve.htm?pk_document=905211
- ↑ District Council Election - Thursday, 5 May 2011, South Cambridgeshire District Council
- 1 2 3 4 5 6 7 8 9 10 11 12 13 14 15 16 17 18 19 "Election results by ward". South Cambridgeshire District Council. 2011-05-06. Retrieved 2011-05-07.
| Cambridgeshire County Council | |
|---|---|
| Peterborough City Council | |
| Cambridge City Council | |
| East Cambridgeshire District Council |
|
| Fenland District Council | |
| Huntingdonshire District Council | |
| South Cambridgeshire District Council | |
| Isle of Ely County Council |
|
| Huntingdon & Peterborough County Council |
|
| |