Walsall Metropolitan Borough Council election, 2011
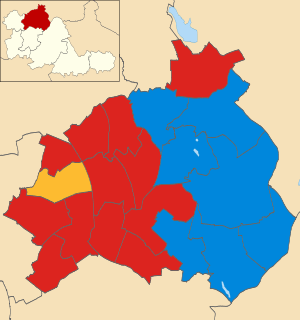
The 2011 Walsall Metropolitan Borough Council election took place on 5 May 2011 to elect members of Walsall Metropolitan Borough Council in the West Midlands, England. One third of the council was up for election and the Conservative party lost overall control of the council to no overall control.[1]
After the election, the composition of the council was
- Conservative 28
- Labour 26
- Liberal Democrats 5
- Independent 1[2]
Background
The council leader Mike Bird was one of the Conservatives who were defending seats at the election, along with a member of his cabinet Barbara McCracken.[3]
Election result
The results saw the Conservatives lose their majority on the council after Labour gained 8 seats, including 5 from the Conservatives.[4] This meant the Conservatives had 28 councillors compared to 26 for Labour, leaving the Liberal Democrats, down one on five seats, holding the balance.[4]
Following the election the Conservatives continued to run the council as a minority administration.[5]
| Walsall Local Election Result 2011[1][6] | ||||||||||
|---|---|---|---|---|---|---|---|---|---|---|
| Party | Seats | Gains | Losses | Net gain/loss | Seats % | Votes % | Votes | +/− | ||
| Labour | 12 | 8 | 0 | +8 | 57.1 | 40.6 | 31,104 | +9.3% | ||
| Conservative | 8 | 0 | 5 | -5 | 38.1 | 40.0 | 30,592 | +0.5% | ||
| Liberal Democrat | 1 | 0 | 1 | -1 | 4.8 | 7.1 | 5,430 | -9.0% | ||
| UKIP | 0 | 0 | 0 | 0 | 0 | 5.8 | 4,467 | +0.3% | ||
| Independent | 0 | 0 | 1 | -1 | 0 | 3.1 | 2,372 | -0.3% | ||
| Democratic Labour | 0 | 0 | 1 | -1 | 0 | 2.3 | 1,785 | +0.9% | ||
| BNP | 0 | 0 | 0 | 0 | 0 | 0.4 | 307 | -0.7% | ||
| Green | 0 | 0 | 0 | 0 | 0 | 0.3 | 255 | -1.1% | ||
| English Democrat | 0 | 0 | 0 | 0 | 0 | 0.3 | 210 | +0.3% | ||
Ward results
| Party | Candidate | Votes | % | ± | |
|---|---|---|---|---|---|
| Conservative | John Rochelle | 2,719 | |||
| Conservative | John Murray | 2,553 | |||
| Labour | Angus McGhee | 976 | |||
| Labour | Michael Johnson | 967 | |||
| Liberal Democrat | Roy Sheward | 632 | |||
| UKIP | Bruce Bennett | 552 | |||
| UKIP | Malcolm Ford | 378 | |||
| Turnout | 8,777 | 44.0 | -24.5 | ||
| Conservative hold | Swing | ||||
| Conservative hold | Swing | ||||
| Party | Candidate | Votes | % | ± | |
|---|---|---|---|---|---|
| Conservative | Mike Flower | 2,167 | 56.5 | +2.8 | |
| Labour | Bob Grainger | 1,094 | 28.5 | +6.5 | |
| BNP | Terence Majorwicz | 307 | 8.0 | +8.0 | |
| Liberal Democrat | Mark Greveson | 267 | 7.0 | -13.4 | |
| Majority | 1,073 | 28.0 | -3.7 | ||
| Turnout | 3,835 | 38.3 | -26.3 | ||
| Conservative hold | Swing | ||||
| Party | Candidate | Votes | % | ± | |
|---|---|---|---|---|---|
| Labour | Keith Chambers | 1,922 | 65.0 | +22.2 | |
| Conservative | Jeet Sohal | 572 | 19.4 | -10.6 | |
| UKIP | Annette Ford | 418 | 14.1 | +2.2 | |
| Democratic Labour | Alan Paddock | 43 | 1.5 | +0.6 | |
| Majority | 1,350 | 45.7 | +32.9 | ||
| Turnout | 2,955 | 32.1 | -23.5 | ||
| Labour hold | Swing | ||||
| Party | Candidate | Votes | % | ± | |
|---|---|---|---|---|---|
| Labour | Tim Oliver | 1,574 | 55.0 | +17.9 | |
| Conservative | Kamran Aftab | 961 | 33.6 | +0.1 | |
| Liberal Democrat | Roy Robinson | 167 | 5.8 | -6.9 | |
| Democratic Labour | Alan Davies | 158 | 5.5 | +2.7 | |
| Majority | 613 | 21.4 | +17.8 | ||
| Turnout | 2,860 | 30.3 | -20.4 | ||
| Labour hold | Swing | ||||
| Party | Candidate | Votes | % | ± | |
|---|---|---|---|---|---|
| Labour | Ann Young | 1,256 | 46.0 | +5.1 | |
| Democratic Labour | Peter Smith | 928 | 34.0 | +14.4 | |
| Conservative | Muhammed Afzal | 453 | 16.6 | -10.1 | |
| Liberal Democrat | Robert Pearce | 95 | 3.5 | -9.3 | |
| Majority | 328 | 12.0 | -2.2 | ||
| Turnout | 2,732 | 32.4 | -13.9 | ||
| Labour gain from Democratic Labour | Swing | ||||
| Party | Candidate | Votes | % | ± | |
|---|---|---|---|---|---|
| Labour | Shaun Fitzpatrick | 1,205 | 42.8 | +1.6 | |
| Conservative | Les Beeley | 1,191 | 42.3 | +6.5 | |
| UKIP | Alan Sheath | 229 | 8.1 | -2.1 | |
| Democratic Labour | Stephen Baggott | 107 | 3.8 | +0.0 | |
| Liberal Democrat | Chris Cockayne | 81 | 2.9 | -6.2 | |
| Majority | 14 | 0.5 | -4.9 | ||
| Turnout | 2,813 | 33.0 | -21.2 | ||
| Labour gain from Conservative | Swing | ||||
| Party | Candidate | Votes | % | ± | |
|---|---|---|---|---|---|
| Labour | Sue Fletcher-Hall | 1,438 | 45.2 | +10.1 | |
| Conservative | Des Pitt | 1,360 | 42.8 | +2.1 | |
| Democratic Labour | Michael Ross | 234 | 7.4 | +7.4 | |
| Liberal Democrat | Jeanette Pearce | 146 | 4.6 | -5.2 | |
| Majority | 78 | 2.5 | |||
| Turnout | 3,178 | 33.3 | -26.1 | ||
| Labour gain from Conservative | Swing | ||||
| Party | Candidate | Votes | % | ± | |
|---|---|---|---|---|---|
| Labour | Barbara Cassidy | 1,758 | 52.8 | +16.1 | |
| Conservative | Vivienne Aston | 1,279 | 38.4 | -2.9 | |
| Liberal Democrat | Ian Ryan | 219 | 6.6 | -10.5 | |
| Democratic Labour | Andrew Bradburn | 72 | 2.2 | +0.3 | |
| Majority | 479 | 14.4 | |||
| Turnout | 3,328 | 34.0 | -24.7 | ||
| Labour hold | Swing | ||||
| Party | Candidate | Votes | % | ± | |
|---|---|---|---|---|---|
| Labour | Douglas James | 1,205 | 41.5 | +7.1 | |
| Independent | Chris Bott | 1,112 | 38.3 | +2.3 | |
| Conservative | Michelle Martin | 334 | 11.5 | -8.3 | |
| Independent | Ashley Lovell | 138 | 4.8 | +4.8 | |
| Green | Tim Martin | 114 | 3.9 | +3.9 | |
| Majority | 93 | 3.2 | |||
| Turnout | 2,903 | 31.2 | -22.3 | ||
| Labour gain from Independent | Swing | ||||
| Party | Candidate | Votes | % | ± | |
|---|---|---|---|---|---|
| Conservative | Barbara McCracken | 2,124 | 41.8 | -1.1 | |
| Labour | Nasar Ali | 1,795 | 35.3 | +7.5 | |
| Independent | Barry Sanders | 570 | 11.2 | +2.0 | |
| UKIP | Derek Bennett | 471 | 9.3 | -0.1 | |
| Liberal Democrat | Abdul Malik | 119 | 2.3 | -8.4 | |
| Majority | 329 | 6.5 | -8.5 | ||
| Turnout | 5,079 | 52.8 | -18.6 | ||
| Conservative hold | Swing | ||||
| Party | Candidate | Votes | % | ± | |
|---|---|---|---|---|---|
| Labour | Allah Ditta | 3,008 | 60.2 | +10.0 | |
| Conservative | Mohammad Yasin | 1,755 | 35.1 | +4.2 | |
| Liberal Democrat | Sadat Hussain | 235 | 4.7 | -14.2 | |
| Majority | 1,253 | 25.1 | +5.8 | ||
| Turnout | 4,998 | 48.4 | -15.7 | ||
| Labour gain from Conservative | Swing | ||||
| Party | Candidate | Votes | % | ± | |
|---|---|---|---|---|---|
| Conservative | Marco Longhi | 2,085 | 57.3 | +11.4 | |
| Labour | Stephen Wade | 979 | 26.9 | +8.4 | |
| UKIP | Dorothy Sheath | 315 | 8.7 | +2.6 | |
| Liberal Democrat | Shirley Balgobin | 185 | 5.1 | +5.1 | |
| Democratic Labour | Derek Roddy | 77 | 2.1 | +0.9 | |
| Majority | 1,106 | 30.4 | +4.1 | ||
| Turnout | 3,641 | 41.0 | -25.9 | ||
| Conservative hold | Swing | ||||
| Party | Candidate | Votes | % | ± | |
|---|---|---|---|---|---|
| Conservative | Mike Bird | 1,782 | 48.3 | -1.8 | |
| Labour | Jack Kelly | 1,161 | 31.5 | +6.2 | |
| UKIP | Steven Grey | 429 | 11.6 | -1.6 | |
| English Democrat | Christopher Newey | 210 | 5.7 | +5.7 | |
| Liberal Democrat | Anne Willoughby | 104 | 2.8 | -8.6 | |
| Majority | 621 | 16.8 | -7.9 | ||
| Turnout | 3,686 | 42.4 | -26.2 | ||
| Conservative hold | Swing | ||||
| Party | Candidate | Votes | % | ± | |
|---|---|---|---|---|---|
| Labour | Khazar Hussain | 2,449 | 58.5 | +17.2 | |
| Conservative | Mushtaq Ahmed | 767 | 18.3 | -13.3 | |
| Independent | Mark Dabbs | 475 | 11.3 | +5.2 | |
| Liberal Democrat | Mohammed Yaqub | 331 | 7.9 | -6.4 | |
| Democratic Labour | Brian Powell | 166 | 4.0 | +4.0 | |
| Majority | 1,682 | 40.2 | +30.5 | ||
| Turnout | 4,188 | 43.8 | -16.3 | ||
| Labour gain from Conservative | Swing | ||||
| Party | Candidate | Votes | % | ± | |
|---|---|---|---|---|---|
| Conservative | Lorna Rattigan | 1,337 | 42.2 | -1.6 | |
| Labour | Richard Worrall | 1,309 | 41.3 | +14.3 | |
| UKIP | Timothy Melville | 273 | 8.6 | +0.4 | |
| Liberal Democrat | Roy Smitb | 159 | 5.0 | -12.8 | |
| Green | Mike Walters | 92 | 2.9 | -0.3 | |
| Majority | 28 | 0.9 | -15.9 | ||
| Turnout | 3,170 | 35.5 | -24.8 | ||
| Conservative hold | Swing | ||||
| Party | Candidate | Votes | % | ± | |
|---|---|---|---|---|---|
| Liberal Democrat | Daniel Barker | 924 | 31.3 | -6.9 | |
| Labour | Doug Cleaver | 813 | 27.5 | +5.2 | |
| Conservative | Theresa Smith | 805 | 27.2 | -1.5 | |
| UKIP | Darren Hazell | 287 | 9.7 | -1.0 | |
| Independent | Malcolm Moore | 77 | 2.6 | +2.6 | |
| Green | Leandra Gebrakedan | 49 | 1.7 | +1.7 | |
| Majority | 111 | 3.8 | -5.7 | ||
| Turnout | 2,955 | 32.9 | -26.4 | ||
| Liberal Democrat hold | Swing | ||||
| Party | Candidate | Votes | % | ± | |
|---|---|---|---|---|---|
| Labour | Eileen Russell | 1,984 | 47.2 | +11.4 | |
| Conservative | Gerry McCracken | 1,650 | 39.2 | -2.9 | |
| Liberal Democrat | Khosru Miah | 287 | 6.8 | -7.4 | |
| UKIP | Rita Oakley | 284 | 6.8 | +6.8 | |
| Majority | 334 | 7.9 | |||
| Turnout | 4,205 | 42.7 | -20.4 | ||
| Labour gain from Conservative | Swing | ||||
| Party | Candidate | Votes | % | ± | |
|---|---|---|---|---|---|
| Conservative | Gary Clarke | 2,897 | 60.6 | +0.4 | |
| Labour | Steven King | 1,200 | 25.1 | +7.3 | |
| UKIP | Paul Valdmanis | 391 | 8.2 | +1.3 | |
| Liberal Democrat | John Garfitt | 294 | 6.1 | -7.7 | |
| Majority | 1,697 | 35.5 | -6.9 | ||
| Turnout | 4,782 | 44.3 | -26.9 | ||
| Conservative hold | Swing | ||||
| Party | Candidate | Votes | % | ± | |
|---|---|---|---|---|---|
| Labour | Gareth Illmann-Walker | 1,012 | 30.9 | +8.9 | |
| Liberal Democrat | Peter Hughes | 943 | 28.8 | -4.1 | |
| Conservative | Abi Pitt | 875 | 26.8 | -2.0 | |
| UKIP | Liz Hazell | 440 | 13.5 | +7.1 | |
| Majority | 69 | 2.1 | |||
| Turnout | 3,270 | 34.6 | -27.1 | ||
| Labour gain from Liberal Democrat | Swing | ||||
| Party | Candidate | Votes | % | ± | |
|---|---|---|---|---|---|
| Labour | Carl Creaney | 1,999 | 63.1 | +18.0 | |
| Conservative | Clive Rudd | 926 | 29.2 | -0.1 | |
| Liberal Democrat | Uppal Singh | 242 | 7.6 | -15.3 | |
| Majority | 1,073 | 33.9 | +18.1 | ||
| Turnout | 3,167 | 29.7 | -24.6 | ||
| Labour hold | Swing | ||||
References
- 1 2 "England council elections". BBC News Online. 10 May 2011. Retrieved 24 September 2011.
- ↑ "Election results 2011: English council summary results". guardian.co.uk. 6 May 2011. Retrieved 24 September 2011.
- ↑ Henwood, Chris (6 April 2011). "Walsall and Dudley leaders up for re-election as Black Country councils go to the polls". Birmingham Post. Retrieved 24 September 2011.
- 1 2 "Labour gains seats on Birmingham City Council". BBC News Online. 6 May 2011. Retrieved 24 September 2011.
- ↑ "Walsall Council opts for minority administration". BBC News Online. 26 May 2011. Retrieved 24 September 2011.
- 1 2 3 4 5 6 7 8 9 10 11 12 13 14 15 16 17 18 19 20 21 "Election results 2011 - Local election Live". Walsall Council. Retrieved 24 September 2011.
- 1 2 3 4 5 6 7 8 9 10 11 12 13 14 15 16 17 18 19 20 "Walsall Council local elections: Ward by ward results". Birmingham Mail. 6 May 2011. Retrieved 24 September 2011.