Leeds City Council election, 1984
The Leeds City Council elections were held on Thursday, 3 May 1984, with one third of the council to be elected. In the interim there had been a by-election in Armley, to replace the incumbent councillor Michael Meadowcroft after he was elected the Leeds West MP, resulting in an Alliance hold.
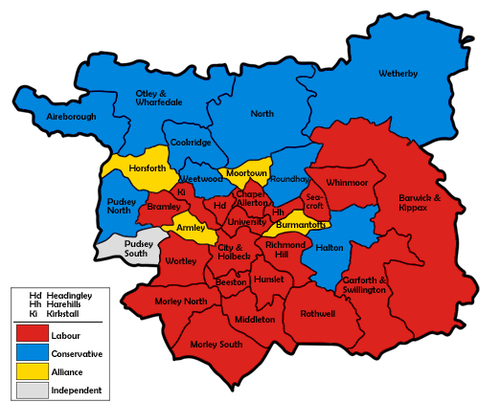
The Conservative's downward trend continued after last year's respite to a new party low, resulting in a 3% swing to Labour. In contrast, the Alliance support stabilised after the prior year's fall to retain a healthy proportion of their initial 1982 surge. Despite the swing towards them, Labour finished the night with a net loss, as the Alliance won the only remaining Burmantofts seat they didn't hold from them. The Alliance also gained in Moortown, winning their first seat in the ward from the Conservatives - who lost another in Pudsey South to their former incumbent turn Independent, achieving the feat of first elected Independent onto the council.[1]
Election result
| Leeds Local Election Result 1984 | ||||||||||
|---|---|---|---|---|---|---|---|---|---|---|
| Party | Seats | Gains | Losses | Net gain/loss | Seats % | Votes % | Votes | +/− | ||
| Labour | 19 | 0 | 1 | -1 | 57.6 | 42.7 | 91,314 | +2.6% | ||
| Conservative | 9 | 1 | 2 | -1 | 27.3 | 33.0 | 70,431 | -3.3% | ||
| SDP–Liberal Alliance | 4 | 2 | 1 | +1 | 12.1 | 22.6 | 48,335 | -0.4% | ||
| Independent | 1 | 1 | 0 | +1 | 3.0 | 1.3 | 2,770 | +1.1% | ||
| Ecology | 0 | 0 | 0 | 0 | 0.0 | 0.2 | 531 | +0.1% | ||
| Communist | 0 | 0 | 0 | 0 | 0.0 | 0.1 | 308 | -0.1% | ||
This result has the following consequences for the total number of seats on the council after the elections:
| Party | Previous council | New council | |||
|---|---|---|---|---|---|
| Labour | 54 | 53 | |||
| Conservatives | 34 | 33 | |||
| Alliance | 11 | 12 | |||
| Independent | 0 | 1 | |||
| Total | 99 | 99 | |||
| Working majority | 9 | 7 | |||
Ward results
| Party | Candidate | Votes | % | ± | |
|---|---|---|---|---|---|
| Conservative | W. Hudson | 3,515 | 42.7 | -0.5 | |
| Labour | M. Dunn | 2,550 | 31.0 | +3.4 | |
| SDP–Liberal Alliance (Liberal) | M. Cooksey | 2,167 | 26.3 | -2.9 | |
| Majority | 965 | 11.7 | -2.3 | ||
| Turnout | 8,232 | ||||
| Conservative hold | Swing | -1.9 | |||
| Party | Candidate | Votes | % | ± | |
|---|---|---|---|---|---|
| SDP–Liberal Alliance (Liberal) | A. Melville | 3,328 | 55.9 | +10.1 | |
| Labour | J. Appleyard | 1,756 | 29.5 | -3.3 | |
| Conservative | H. Hinchliffe | 872 | 14.6 | -6.0 | |
| Majority | 1,572 | 26.4 | +13.4 | ||
| Turnout | 5,956 | ||||
| SDP–Liberal Alliance hold | Swing | +6.7 | |||
| Party | Candidate | Votes | % | ± | |
|---|---|---|---|---|---|
| Labour | F. Flatters | 3,802 | 50.3 | +0.8 | |
| Conservative | J. Tweddle | 2,971 | 39.3 | -0.5 | |
| SDP–Liberal Alliance (Social Democratic) | N. Snowdon | 793 | 10.5 | -0.2 | |
| Majority | 831 | 11.0 | +1.3 | ||
| Turnout | 7,566 | ||||
| Labour hold | Swing | +0.6 | |||
| Party | Candidate | Votes | % | ± | |
|---|---|---|---|---|---|
| Labour | A. Beevers | 3,102 | 62.6 | +8.3 | |
| Conservative | W. Birch | 1,400 | 28.3 | -4.2 | |
| SDP–Liberal Alliance (Social Democratic) | L. Shaffner | 417 | 8.4 | -4.8 | |
| Independent | A. Ali | 35 | 0.7 | +0.7 | |
| Majority | 1,702 | 34.4 | +12.5 | ||
| Turnout | 4,954 | ||||
| Labour hold | Swing | +6.2 | |||
| Party | Candidate | Votes | % | ± | |
|---|---|---|---|---|---|
| Labour | A. Siantonas | 2,939 | 53.2 | +1.5 | |
| SDP–Liberal Alliance (Liberal) | C. Pearson | 1,856 | 33.6 | +2.5 | |
| Conservative | P. Netzel | 731 | 13.2 | -4.0 | |
| Majority | 1,083 | 19.6 | -1.0 | ||
| Turnout | 5,526 | ||||
| Labour hold | Swing | -0.5 | |||
| Party | Candidate | Votes | % | ± | |
|---|---|---|---|---|---|
| SDP–Liberal Alliance (Liberal) | N. Mackie | 3,730 | 50.5 | +4.9 | |
| Labour | S. Armitage | 3,244 | 43.9 | +1.4 | |
| Conservative | S. Temple | 416 | 5.6 | -4.6 | |
| Majority | 486 | 6.6 | +3.4 | ||
| Turnout | 7,390 | ||||
| SDP–Liberal Alliance gain from Labour | Swing | +1.7 | |||
| Party | Candidate | Votes | % | ± | |
|---|---|---|---|---|---|
| Labour | J. Frankland | 3,555 | 59.8 | -0.3 | |
| Conservative | J. Moore | 1,590 | 26.8 | -0.1 | |
| SDP–Liberal Alliance (Liberal) | C. Smith | 717 | 12.1 | -1.0 | |
| Communist | J. Rodgers | 78 | 1.3 | +1.3 | |
| Majority | 1,965 | 33.1 | -0.1 | ||
| Turnout | 5,940 | ||||
| Labour hold | Swing | -0.1 | |||
| Party | Candidate | Votes | % | ± | |
|---|---|---|---|---|---|
| Labour | B. Sanderson | 3,354 | 69.2 | +4.8 | |
| SDP–Liberal Alliance (Liberal) | K. Hawkins | 959 | 19.8 | -0.7 | |
| Conservative | H. Woodhead | 534 | 11.0 | -4.1 | |
| Majority | 2,395 | 49.4 | +5.5 | ||
| Turnout | 4,847 | ||||
| Labour hold | Swing | +2.7 | |||
| Party | Candidate | Votes | % | ± | |
|---|---|---|---|---|---|
| Conservative | K. Loudon | 3,619 | 48.7 | -7.2 | |
| SDP–Liberal Alliance (Liberal) | P. Kelley | 2,241 | 30.2 | +4.5 | |
| Labour | C. Ashley | 1,569 | 21.1 | +2.7 | |
| Majority | 1,387 | 18.5 | -11.8 | ||
| Turnout | 7,429 | ||||
| Conservative hold | Swing | -5.8 | |||
| Party | Candidate | Votes | % | ± | |
|---|---|---|---|---|---|
| Labour | G. Moakes | 4,235 | 51.6 | +7.5 | |
| Conservative | N. May | 3,070 | 37.4 | -5.3 | |
| SDP–Liberal Alliance (Social Democratic) | P. Wilson | 896 | 10.9 | -2.2 | |
| Majority | 1,165 | 14.2 | +12.9 | ||
| Turnout | 8,201 | ||||
| Labour hold | Swing | +6.4 | |||
| Party | Candidate | Votes | % | ± | |
|---|---|---|---|---|---|
| Conservative | M. Dodgson | 3,823 | 53.2 | -6.0 | |
| Labour | E. McGee | 2,504 | 34.9 | +9.8 | |
| SDP–Liberal Alliance (Social Democratic) | D. Mortimer | 855 | 11.9 | -3.8 | |
| Majority | 1,319 | 18.4 | -15.8 | ||
| Turnout | 7,182 | ||||
| Conservative hold | Swing | -7.9 | |||
| Party | Candidate | Votes | % | ± | |
|---|---|---|---|---|---|
| Labour | L. Cohen | 3,252 | 64.2 | -0.9 | |
| Conservative | M. Cohen | 1,194 | 23.6 | +0.8 | |
| SDP–Liberal Alliance (Liberal) | J. Foster | 623 | 12.3 | +0.2 | |
| Majority | 2,058 | 40.6 | -1.7 | ||
| Turnout | 5,069 | ||||
| Labour hold | Swing | -0.8 | |||
| Party | Candidate | Votes | % | ± | |
|---|---|---|---|---|---|
| Labour | A. Larsen | 3,480 | 56.8 | +3.2 | |
| Conservative | D. Flowers | 1,688 | 27.5 | -4.7 | |
| SDP–Liberal Alliance (Social Democratic) | K. Lee | 691 | 11.3 | -0.8 | |
| Ecology | G. Rainford | 213 | 3.5 | +3.5 | |
| Communist | I. Dixon | 58 | 0.9 | -1.1 | |
| Majority | 1,792 | 29.2 | +7.8 | ||
| Turnout | 6,130 | ||||
| Labour hold | Swing | +3.9 | |||
| Party | Candidate | Votes | % | ± | |
|---|---|---|---|---|---|
| SDP–Liberal Alliance (Liberal) | S. Cooksey | 4,037 | 48.9 | +4.9 | |
| Conservative | J. Stevens | 3,451 | 41.8 | -4.0 | |
| Labour | L. Smith | 762 | 9.2 | -0.9 | |
| Majority | 586 | 7.1 | +5.3 | ||
| Turnout | 8,250 | ||||
| SDP–Liberal Alliance hold | Swing | +4.4 | |||
| Party | Candidate | Votes | % | ± | |
|---|---|---|---|---|---|
| Labour | G. Driver | 3,379 | 82.8 | -0.7 | |
| SDP–Liberal Alliance (Liberal) | S. Gillen | 369 | 9.0 | +2.2 | |
| Conservative | H. Lavery | 333 | 8.2 | -1.5 | |
| Majority | 3,010 | 73.8 | -0.1 | ||
| Turnout | 4,081 | ||||
| Labour hold | Swing | -1.4 | |||
| Party | Candidate | Votes | % | ± | |
|---|---|---|---|---|---|
| Labour | E. Nash | 3,418 | 54.9 | -1.3 | |
| Conservative | A. Walkington | 1,415 | 22.7 | -4.5 | |
| SDP–Liberal Alliance (Liberal) | P. Meadowcroft | 1,322 | 21.3 | +5.9 | |
| Communist | B. Jackson | 66 | 1.1 | -0.1 | |
| Majority | 2,003 | 32.2 | +3.2 | ||
| Turnout | 6,221 | ||||
| Labour hold | Swing | +1.6 | |||
| Party | Candidate | Votes | % | ± | |
|---|---|---|---|---|---|
| Labour | J. Kitchen | 2,946 | 74.8 | +1.0 | |
| Conservative | A. Larvin | 612 | 15.5 | -1.5 | |
| SDP–Liberal Alliance (Liberal) | D. Howard | 381 | 9.7 | +0.5 | |
| Majority | 2,334 | 59.3 | +2.6 | ||
| Turnout | 3,939 | ||||
| Labour hold | Swing | +1.2 | |||
| Party | Candidate | Votes | % | ± | |
|---|---|---|---|---|---|
| SDP–Liberal Alliance (Social Democratic) | M. Harris | 3,355 | 45.0 | +10.3 | |
| Conservative | C. Thomas | 2,967 | 39.8 | -8.0 | |
| Labour | C. Dews | 1,129 | 15.2 | -2.3 | |
| Majority | 388 | 5.2 | -7.9 | ||
| Turnout | 7,451 | ||||
| SDP–Liberal Alliance gain from Conservative | Swing | +9.1 | |||
| Party | Candidate | Votes | % | ± | |
|---|---|---|---|---|---|
| Labour | P. Jones | 3,521 | 51.1 | +9.3 | |
| Conservative | R. Halpin | 2,845 | 41.3 | -5.2 | |
| SDP–Liberal Alliance (Liberal) | E. Ayres | 527 | 7.6 | -4.0 | |
| Majority | 676 | 9.8 | +5.1 | ||
| Turnout | 6,893 | ||||
| Labour hold | Swing | +7.2 | |||
| Party | Candidate | Votes | % | ± | |
|---|---|---|---|---|---|
| Labour | B. North | 3,723 | 60.9 | +10.7 | |
| Conservative | A. Grayson | 1,682 | 27.5 | -4.5 | |
| SDP–Liberal Alliance (Liberal) | H. Smith | 709 | 11.6 | +1.7 | |
| Majority | 2,041 | 33.4 | +15.3 | ||
| Turnout | 6,114 | ||||
| Labour hold | Swing | +7.6 | |||
| Party | Candidate | Votes | % | ± | |
|---|---|---|---|---|---|
| Conservative | A. O'Brien | 3,128 | 51.6 | -9.9 | |
| SDP–Liberal Alliance (Social Democratic) | G. Shaffner | 1,681 | 27.7 | +6.0 | |
| Labour | J. Langan | 1,255 | 20.7 | +3.8 | |
| Majority | 1,447 | 23.9 | -15.9 | ||
| Turnout | 6,064 | ||||
| Conservative hold | Swing | -7.9 | |||
| Party | Candidate | Votes | % | ± | |
|---|---|---|---|---|---|
| Conservative | C. Hindle | 4,108 | 43.6 | +5.7 | |
| SDP–Liberal Alliance (Liberal) | H. Morgan | 3,871 | 41.1 | -10.2 | |
| Labour | M. Attwood | 1,303 | 13.8 | +5.3 | |
| Ecology | A. Laurence | 138 | 1.5 | -0.8 | |
| Majority | 237 | 2.5 | -10.8 | ||
| Turnout | 9,420 | ||||
| Conservative gain from SDP–Liberal Alliance | Swing | +7.9 | |||
| Party | Candidate | Votes | % | ± | |
|---|---|---|---|---|---|
| Conservative | A. Carter | 4,402 | 51.1 | +1.0 | |
| Labour | J. Hodgson | 3,188 | 37.0 | +6.6 | |
| SDP–Liberal Alliance (Social Democratic) | J. Stott | 1,021 | 11.9 | -7.6 | |
| Majority | 1,214 | 14.1 | -5.6 | ||
| Turnout | 8,611 | ||||
| Conservative hold | Swing | -2.8 | |||
| Party | Candidate | Votes | % | ± | |
|---|---|---|---|---|---|
| Independent | P. Kersting | 2,735 | 36.7 | +36.7 | |
| Labour | R. Lewis | 2,340 | 31.4 | -8.0 | |
| Conservative | H. Gill | 1,582 | 21.2 | -15.4 | |
| SDP–Liberal Alliance (Liberal) | A. Booker | 791 | 10.6 | -13.4 | |
| Majority | 395 | 5.3 | +2.5 | ||
| Turnout | 7,448 | ||||
| Independent gain from Conservative | Swing | ||||
| Party | Candidate | Votes | % | ± | |
|---|---|---|---|---|---|
| Labour | M. Lyons | 3,853 | 56.2 | +5.9 | |
| SDP–Liberal Alliance (Liberal) | K. Norman | 2,618 | 38.2 | -2.9 | |
| Conservative | D. Boynton | 381 | 5.6 | -1.8 | |
| Majority | 1,235 | 18.0 | +8.8 | ||
| Turnout | 6,852 | ||||
| Labour hold | Swing | +4.4 | |||
| Party | Candidate | Votes | % | ± | |
|---|---|---|---|---|---|
| Labour | R. Lund | 3,871 | 68.3 | +9.3 | |
| Conservative | M. Dalton | 1,234 | 21.8 | -5.5 | |
| SDP–Liberal Alliance (Social Democratic) | S. Browning | 564 | 9.9 | -3.0 | |
| Majority | 2,637 | 46.5 | +14.7 | ||
| Turnout | 5,669 | ||||
| Labour hold | Swing | +7.4 | |||
| Party | Candidate | Votes | % | ± | |
|---|---|---|---|---|---|
| Conservative | P. Crotty | 4,045 | 61.0 | -2.5 | |
| SDP–Liberal Alliance (Liberal) | L. Thackray | 1,358 | 20.5 | +0.4 | |
| Labour | F. Hamilton | 1,230 | 18.5 | +2.1 | |
| Majority | 2,687 | 40.5 | -2.9 | ||
| Turnout | 6,633 | ||||
| Conservative hold | Swing | -1.4 | |||
| Party | Candidate | Votes | % | ± | |
|---|---|---|---|---|---|
| Labour | G. Mudie | 3,459 | 72.0 | +4.1 | |
| Conservative | B. Caro | 963 | 20.0 | -0.9 | |
| SDP–Liberal Alliance (Social Democratic) | S. Richmond | 381 | 7.9 | -3.2 | |
| Majority | 2,496 | 52.0 | +5.1 | ||
| Turnout | 4,803 | ||||
| Labour hold | Swing | +2.5 | |||
| Party | Candidate | Votes | % | ± | |
|---|---|---|---|---|---|
| Labour | W. Kilgallon | 3,149 | 70.7 | +4.7 | |
| Conservative | M. Killick | 639 | 14.4 | -4.1 | |
| SDP–Liberal Alliance (Liberal) | J. Staines | 558 | 12.5 | -1.0 | |
| Communist | R. Honey | 106 | 2.4 | +0.4 | |
| Majority | 2,510 | 56.4 | +8.9 | ||
| Turnout | 4,452 | ||||
| Labour hold | Swing | +4.4 | |||
| Party | Candidate | Votes | % | ± | |
|---|---|---|---|---|---|
| Conservative | A. Lodge | 2,955 | 41.1 | -4.9 | |
| Labour | J. Page | 2,759 | 38.3 | +3.9 | |
| SDP–Liberal Alliance (Social Democratic) | J. MacArthur | 1,301 | 18.1 | -1.5 | |
| Ecology | C. Nash | 180 | 2.5 | +2.5 | |
| Majority | 196 | 2.7 | -8.8 | ||
| Turnout | 7,195 | ||||
| Conservative hold | Swing | -4.4 | |||
| Party | Candidate | Votes | % | ± | |
|---|---|---|---|---|---|
| Conservative | H. Gardiner | 4,624 | 70.3 | +1.5 | |
| SDP–Liberal Alliance (Liberal) | T. Burgess | 1,129 | 17.2 | -3.3 | |
| Labour | R. Bishop | 820 | 12.5 | +1.7 | |
| Majority | 3,495 | 53.2 | +4.9 | ||
| Turnout | 6,573 | ||||
| Conservative hold | Swing | +2.4 | |||
| Party | Candidate | Votes | % | ± | |
|---|---|---|---|---|---|
| Labour | F. Stringer | 2,992 | 53.5 | +5.2 | |
| Conservative | J. Howard | 1,977 | 35.4 | -1.4 | |
| SDP–Liberal Alliance (Social Democratic) | M. Lance | 620 | 11.1 | -3.7 | |
| Majority | 1,015 | 18.2 | +6.6 | ||
| Turnout | 5,589 | ||||
| Labour hold | Swing | +3.3 | |||
| Party | Candidate | Votes | % | ± | |
|---|---|---|---|---|---|
| Labour | W. Thurlow | 2,875 | 41.0 | -2.5 | |
| SDP–Liberal Alliance (Liberal) | A. Gilchrist | 2,469 | 35.2 | +7.5 | |
| Conservative | A. Stephenson | 1,665 | 23.8 | -5.1 | |
| Majority | 406 | 5.8 | -8.8 | ||
| Turnout | 7,009 | ||||
| Labour hold | Swing | -5.0 | |||
References
| Metropolitan boroughs |
|
|---|---|
| District councils (England) |
|
| District councils (Scotland) |
|
| |
| City of Bradford Metropolitan District Council | |
|---|---|
| Calderdale Metropolitan Borough Council | |
| Kirklees Metropolitan Borough Council | |
| Leeds City Council | |
| Wakefield Metropolitan District Council | |
| West Yorkshire County Council | |
| West Riding County Council | |
| |