Kirklees Metropolitan Borough Council election, 2012
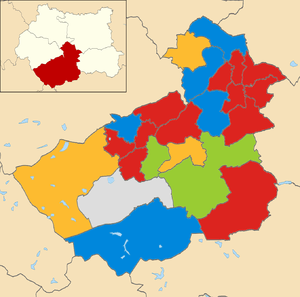
2012 local election results in Kirklees
The 2012 Kirklees Metropolitan Borough Council election took place on 3 May 2012 to elect members of Kirklees Metropolitan Borough Council in West Yorkshire, England.[1] This was on the same day as other United Kingdom local elections, 2012.
Ward results
Spoilt votes not included below.
Almondbury ward
| Party | Candidate | Votes | % | ± | |
|---|---|---|---|---|---|
| Liberal Democrat | Phil Scott | 1,423 | 33.2 | −1.9 | |
| Conservative | Janice Thomas | 1,161 | 27.1 | −2.5 | |
| Labour | Mus Khan | 1,121 | 26.1 | +15.0 | |
| Green | Benjamin Wrightman | 585 | 13.6 | +4.2 | |
| Majority | 262 | 6.1 | |||
| Turnout | 4,290 | 31 | −5 | ||
| Liberal Democrat hold | Swing | ||||
Ashbrow ward
| Party | Candidate | Votes | % | ± | |
|---|---|---|---|---|---|
| Labour | Ken Smith | 2,363 | 53.2 | +12.9 | |
| Conservative | Bill Armer | 1,383 | 31.1 | −6.5 | |
| Green | Tracy Morris | 371 | 8.3 | +3.7 | |
| Liberal Democrat | Manjit Singh | 328 | 7.4 | +1.0 | |
| Majority | 980 | 22.0 | |||
| Turnout | 4,445 | 32 | −3 | ||
| Labour hold | Swing | ||||
Batley East ward
| Party | Candidate | Votes | % | ± | |
|---|---|---|---|---|---|
| Labour | Hanif Mayet | 3,876 | 73.0 | +18.3 | |
| Conservative | Derrick Yates | 740 | 13.9 | −0.8 | |
| Independent | Mark Griffin | 462 | 8.7 | N/A | |
| Liberal Democrat | Jon Bloom | 230 | 4.3 | −7.3 | |
| Majority | 3,136 | 59.1 | |||
| Turnout | 5,308 | 41 | −5 | ||
| Labour hold | Swing | ||||
Batley West ward
| Party | Candidate | Votes | % | ± | |
|---|---|---|---|---|---|
| Labour | Shabir Pandor | 3,163 | 69.0 | +23.7 | |
| Conservative | Lyndsey Hall | 798 | 17.4 | −10.7 | |
| Green | Cass Whittingham | 392 | 8.6 | +5.2 | |
| Liberal Democrat | Stephen Leach | 230 | 5.0 | +1.6 | |
| Majority | 2,365 | 51.6 | |||
| Turnout | 4,583 | 35 | −7 | ||
| Labour hold | Swing | ||||
Birstall & Birkenshaw ward
| Party | Candidate | Votes | % | ± | |
|---|---|---|---|---|---|
| Conservative | Andrew Palfreeman | 2,081 | 53.4 | −1.4 | |
| Labour | Simon Alvy | 1,348 | 34.6 | +16.2 | |
| Green | Garry Kitchin | 309 | 7.9 | +3.0 | |
| Liberal Democrat | Megan Scholefield-Nicholson | 160 | 4.1 | −2.2 | |
| Majority | 733 | 18.8 | |||
| Turnout | 3,898 | 31 | −7 | ||
| Conservative hold | Swing | ||||
Cleckheaton ward
| Party | Candidate | Votes | % | ± | |
|---|---|---|---|---|---|
| Liberal Democrat | Kathryn Pinnock | 2,015 | 48.7 | +0.4 | |
| Labour | Dan Howard | 1,299 | 31.4 | +23.3 | |
| Conservative | David Pinder | 821 | 19.9 | −1.1 | |
| Majority | 716 | 17.3 | |||
| Turnout | 4,135 | 32 | −9 | ||
| Liberal Democrat hold | Swing | ||||
Colne Valley ward
| Party | Candidate | Votes | % | ± | |
|---|---|---|---|---|---|
| Liberal Democrat | David Ridgway | 1,644 | 34.9 | −3.4 | |
| Conservative | David Hill | 980 | 20.8 | −4.8 | |
| Labour | Barbara Jones | 944 | 20.0 | +8.2 | |
| Green | Lesley Hedges | 574 | 12.2 | +2.0 | |
| UKIP | Melanie Roberts | 570 | 12.1 | N/A | |
| Majority | 664 | 14.1 | |||
| Turnout | 4,712 | 35 | −3 | ||
| Liberal Democrat hold | Swing | ||||
Crosland Moor & Netherton ward
| Party | Candidate | Votes | % | ± | |
|---|---|---|---|---|---|
| Labour | Molly Walton | 2,943 | 62.1 | +21.2 | |
| Conservative | Rod Bowles | 731 | 15.4 | −3.4 | |
| TUSC | Jackie Grunsell | 375 | 7.9 | N/A | |
| Green | Chas Ball | 333 | 7.0 | −0.3 | |
| Independent | Stephen Bradbury | 190 | 4.0 | N/A | |
| Liberal Democrat | Mike Moss | 169 | 3.6 | −4.7 | |
| Majority | 2,212 | 46.7 | |||
| Turnout | 4,741 | 36 | −5 | ||
| Labour hold | Swing | ||||
Dalton ward
| Party | Candidate | Votes | % | ± | |
|---|---|---|---|---|---|
| Labour | Naheed Mather | 1,799 | 48.0 | +17.5 | |
| Liberal Democrat | Rochelle Parchment | 818 | 21.8 | −12.5 | |
| Conservative | Chris Meadows | 473 | 12.6 | −6.8 | |
| Green | David Honour | 407 | 10.9 | +5.9 | |
| Independent | Robert Pepper | 252 | 6.7 | N/A | |
| Majority | 981 | 26.1 | |||
| Turnout | 3,749 | 29 | −5 | ||
| Labour gain from Liberal Democrat | Swing | ||||
Denby Dale ward
| Party | Candidate | Votes | % | ± | |
|---|---|---|---|---|---|
| Labour | Graham Turner | 2,128 | 42.6 | +10.9 | |
| Conservative | John Cook | 2,043 | 40.9 | −4.9 | |
| Green | Terry Sigsworth | 576 | 11.5 | +6.2 | |
| Liberal Democrat | Craig Armistead | 253 | 5.1 | −1.8 | |
| Majority | 85 | 1.7 | |||
| Turnout | 5,000 | 39 | −5 | ||
| Labour gain from Conservative | Swing | ||||
Dewsbury East ward
| Party | Candidate | Votes | % | ± | |
|---|---|---|---|---|---|
| Labour | Paul Kane | 2,320 | 50.8 | +11.4 | |
| Conservative | Mark Eastwood | 1,393 | 30.5 | +18.1 | |
| UKIP | Greg Burrows | 415 | 9.1 | N/A | |
| Liberal Democrat | Dennis Hullock | 282 | 6.2 | −14.3 | |
| Green | Tony Kelsall | 154 | 3.4 | N/A | |
| Majority | 927 | 20.3 | |||
| Turnout | 4,564 | 34 | −6 | ||
| Labour hold | Swing | ||||
Dewsbury South ward
| Party | Candidate | Votes | % | ± | |
|---|---|---|---|---|---|
| Labour | Abdul Patel | 3,341 | 54.7 | +30.5 | |
| Conservative | Khizar Iqbal | 1,784 | 29.2 | −22.0 | |
| English Democrat | Shaun Maddox | 566 | 9.3 | N/A | |
| Green | Adrian Cruden | 238 | 3.9 | +1.1 | |
| Liberal Democrat | Bernard Disken | 118 | 1.9 | −3.1 | |
| TUSC | Paul Wheelhouse | 63 | 1.0 | N/A | |
| Majority | 1,557 | 25.5 | |||
| Turnout | 6,110 | 47 | −3 | ||
| Labour gain from Conservative | Swing | ||||
Dewsbury West ward
| Party | Candidate | Votes | % | ± | |
|---|---|---|---|---|---|
| Labour | Karen Rowling | 2,536 | 46.5 | +18.6 | |
| Independent | Naz Hussain | 1,731 | 31.8 | N/A | |
| Liberal Democrat | Waheed Anwar | 764 | 14.0 | −37.3 | |
| Conservative | Chrisophe Walker | 265 | 4.9 | −1.4 | |
| Green | Peter Cunnington | 155 | 2.8 | =0.5 | |
| Majority | 805 | 14.8 | |||
| Turnout | 5,451 | 41 | −7 | ||
| Labour gain from Liberal Democrat | Swing | ||||
Golcar ward
| Party | Candidate | Votes | % | ± | |
|---|---|---|---|---|---|
| Labour | Paul Salveson | 1,729 | 39.7 | +19.6 | |
| Liberal Democrat | Christine Iredale | 1,584 | 36.4 | +2.8 | |
| Conservative | Clinton Simpson | 548 | 12.6 | −5.5 | |
| Green | Daniel Greenwood | 490 | 11.3 | +2.5 | |
| Majority | 145 | 3.3 | |||
| Turnout | 4,351 | 32 | −5 | ||
| Labour gain from Liberal Democrat | Swing | ||||
Greenhead ward
| Party | Candidate | Votes | % | ± | |
|---|---|---|---|---|---|
| Labour | Mehboob Khan | 3,838 | 70.9 | +7.9 | |
| Conservative | Katie Frank | 708 | 13.1 | −1.5 | |
| Green | John Philips | 663 | 12.3 | +4.6 | |
| Liberal Democrat | Balvinder Singh-Kang | 202 | 3.7 | +4.3 | |
| Majority | 3,130 | 57.8 | |||
| Turnout | 5,411 | 38 | −2 | ||
| Labour hold | Swing | ||||
Heckmondwike ward
| Party | Candidate | Votes | % | ± | |
|---|---|---|---|---|---|
| Labour | Steve Hall | 2,593 | 67.4 | +27.7 | |
| Conservative | Robert Thornton | 990 | 25.7 | +7.7 | |
| Liberal Democrat | Josie Pugsley | 265 | 6.9 | +0.5 | |
| Majority | 1,603 | 41.7 | |||
| Turnout | 3,848 | 30 | −13 | ||
| Labour hold | Swing | ||||
Holme Valley North ward
| Party | Candidate | Votes | % | ± | |
|---|---|---|---|---|---|
| Independent | Charles Greaves | 2,597 | 54.2 | N/A | |
| Conservative | Brenda Bodenham | 1,140 | 23.8 | −8.5 | |
| Labour | Anne Baldwin | 818 | 17.1 | +11.0 | |
| Liberal Democrat | Katie Turner | 238 | 5.0 | −16.0 | |
| Majority | 1,457 | 30.4 | |||
| Turnout | 4,793 | 38 | −7 | ||
| Independent gain from Conservative | Swing | ||||
Holme Valley South ward
| Party | Candidate | Votes | % | ± | |
|---|---|---|---|---|---|
| Conservative | Donald Firth | 2,435 | 48.5 | −6.8 | |
| Labour | Steven Morris | 1,476 | 29.4 | +14.3 | |
| Green | Peter Pankhurst | 630 | 12.5 | +2.2 | |
| Liberal Democrat | Oliver Constance | 480 | 9.6 | −3.4 | |
| Majority | 959 | 19.1 | |||
| Turnout | 5,021 | 35 | −6 | ||
| Conservative hold | Swing | ||||
Kirkburton ward
| Party | Candidate | Votes | % | ± | |
|---|---|---|---|---|---|
| Green | Robert Barraclough | 1,658 | 40.2 | +4.8 | |
| Conservative | Adrian Murphy | 1,635 | 39.6 | −8.0 | |
| Labour | Mike Greetham | 759 | 18.4 | +8.9 | |
| Liberal Democrat | Jatinder Singh | 74 | 1.8 | −1.9 | |
| Majority | 23 | 0.6 | |||
| Turnout | 4,126 | 32 | −8 | ||
| Green gain from Conservative | Swing | ||||
Lindley ward
| Party | Candidate | Votes | % | ± | |
|---|---|---|---|---|---|
| Conservative | Mark Hemingway | 1,783 | 36.3 | −1.2 | |
| Liberal Democrat | Christine Stanfield | 1,568 | 31.9 | −6.7 | |
| Labour | Douglas Morgan | 1,109 | 22.6 | +11.5 | |
| Green | Richard Plunkett | 453 | 9.2 | +4.3 | |
| Majority | 215 | 4.4 | |||
| Turnout | 4,913 | 35 | −6 | ||
| Conservative gain from Liberal Democrat | Swing | ||||
Liversedge & Gomersal ward
| Party | Candidate | Votes | % | ± | |
|---|---|---|---|---|---|
| Conservative | Margaret Bates | 2,021 | 49.1 | −3.7 | |
| Labour | Martin Race | 1,577 | 38.3 | +22.1 | |
| Green | David Brooks | 365 | 8.9 | +4.7 | |
| Liberal Democrat | Richard Farnhill | 155 | 3.8 | −4.0 | |
| Majority | 444 | 10.8 | |||
| Turnout | 4,118 | 30 | −7 | ||
| Conservative hold | Swing | ||||
Mirfield ward
| Party | Candidate | Votes | % | ± | |
|---|---|---|---|---|---|
| Conservative | Martyn Bolt | 2,775 | 53.5 | −2.3 | |
| Labour | Peter Sykes | 1,374 | 26.5 | +13.4 | |
| UKIP | Thomas Hirst | 596 | 11.5 | N/A | |
| Green | Jimmy McLeod | 239 | 4.6 | +2.2 | |
| Liberal Democrat | Brian Firth | 199 | 3.8 | −0.4 | |
| Majority | 1,401 | 27.0 | |||
| Turnout | 5,183 | 34 | −8 | ||
| Conservative hold | Swing | ||||
Newsome ward
| Party | Candidate | Votes | % | ± | |
|---|---|---|---|---|---|
| Green | Andrew Cooper | 2,354 | 53.0 | +6.1 | |
| Labour | Sadia Rehman | 1,552 | 34.9 | +12.8 | |
| Conservative | Mark Dodsworth | 344 | 7.7 | −7.8 | |
| TUSC | Ian Slattery | 119 | 2.7 | N/A | |
| Liberal Democrat | Rilwan Olateju | 76 | 1.7 | −4.5 | |
| Majority | 802 | 18.0 | |||
| Turnout | 4,445 | 31 | −1 | ||
| Green hold | Swing | ||||
References
- ↑ "Local elections 2012". BBC News. Retrieved 2012-04-30.
| City of Bradford Metropolitan District Council | |
|---|---|
| Calderdale Metropolitan Borough Council | |
| Kirklees Metropolitan Borough Council | |
| Leeds City Council | |
| Wakefield Metropolitan District Council | |
| West Yorkshire County Council | |
| West Riding County Council | |
| |
This article is issued from Wikipedia - version of the 12/4/2016. The text is available under the Creative Commons Attribution/Share Alike but additional terms may apply for the media files.