Bolton Metropolitan Borough Council election, 2002
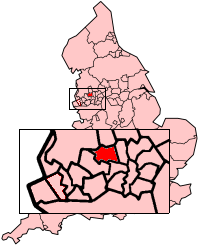
The Metropolitan Borough of Bolton shown within England.
Elections to Bolton Metropolitan Borough Council were held on 2 May 2002. One third of the council was up for election and the Labour party kept overall control of the council.[1]
21 seats were contested in the election with 2 seats being contested in the Burnden ward. 12 were won by the Labour Party, with 5 won by the Conservatives and 4 won by the Liberal Democrats
After the election, the composition of the council was
- Labour 31
- Conservative 16
- Liberal Democrat 13
Result
| Bolton Local Election Result 2002 | ||||||||||
|---|---|---|---|---|---|---|---|---|---|---|
| Party | Seats | Gains | Losses | Net gain/loss | Seats % | Votes % | Votes | +/− | ||
| Labour | 12 | 0 | 3 | -3 | 57.1 | 40.3 | 27,034 | +4.2% | ||
| Conservative | 5 | 1 | 0 | +1 | 23.8 | 33.7 | 22,580 | -5.6% | ||
| Liberal Democrat | 4 | 2 | 0 | +2 | 19.0 | 23.2 | 15,526 | +0.4% | ||
| Socialist Labour | 0 | 0 | 0 | 0 | 0 | 1.2 | 828 | +0.2% | ||
| Independent | 0 | 0 | 0 | 0 | 0 | 0.7 | 459 | +0.0% | ||
| Socialist Alliance | 0 | 0 | 0 | 0 | 0 | 0.6 | 425 | +0.6% | ||
| Green | 0 | 0 | 0 | 0 | 0 | 0.3 | 197 | +0.2% | ||
Council Composition
Prior to the election the composition of the council was:
| 34 | 15 | 11 |
| Labour | Conservative | Lib Dems |
After the election the composition of the council was:
| 31 | 16 | 13 |
| Labour | Conservative | Lib Dems |
Ward results
Astley Bridge ward
| Party | Candidate | Votes | % | ± | |
|---|---|---|---|---|---|
| Conservative | J Walsh | 2,103 | 53.7 | -10.4 | |
| Labour | S Murray | 1,358 | 34.7 | +7.4 | |
| Liberal Democrat | C McPhearson | 452 | 11.6 | +3.0 | |
| Majority | 745 | 19.0 | -17.8 | ||
| Turnout | 3,913 | 35.0 | +6.0 | ||
| Conservative hold | Swing | Con to Labour 8.9 | |||
Blackrod ward
| Party | Candidate | Votes | % | ± | |
|---|---|---|---|---|---|
| Labour | I Seddon | 1,255 | 38.1 | +3.8 | |
| Conservative | M Hollick | 1,193 | 36.3 | -2.9 | |
| Liberal Democrat | I Hamilton | 842 | 25.6 | -0.9 | |
| Majority | 62 | 1.8 | |||
| Turnout | 3,290 | 31.0 | +5.0 | ||
| Labour hold | Swing | Con to Labour 3.3 | |||
Bradshaw ward
| Party | Candidate | Votes | % | ± | |
|---|---|---|---|---|---|
| Conservative | P Brierley | 2,117 | 55.5 | -2.4 | |
| Labour | S Ward | 1,110 | 29.1 | -0.4 | |
| Liberal Democrat | S Howarth | 587 | 15.4 | +2.8 | |
| Majority | 1,007 | 26.4 | -2.0 | ||
| Turnout | 3,814 | 35.0 | +5.0 | ||
| Conservative hold | Swing | Con to LD 2.6 | |||
Breightmet ward
| Party | Candidate | Votes | % | ± | |
|---|---|---|---|---|---|
| Labour | M Murray | 1,329 | 46.5 | -2.8 | |
| Conservative | R Elliott | 1,173 | 41.1 | +0.2 | |
| Liberal Democrat | S Rock | 353 | 12.4 | +2.6 | |
| Majority | 156 | 5.4 | -3.0 | ||
| Turnout | 2,855 | 28.0 | +7.0 | ||
| Labour hold | Swing | Labour to LD 2.5 | |||
Bromley Cross ward
| Party | Candidate | Votes | % | ± | |
|---|---|---|---|---|---|
| Conservative | D Carr | 2,393 | 59.7 | +2.2 | |
| Labour | A Muscat | 1,050 | 26.2 | -0.4 | |
| Liberal Democrat | S Ball | 563 | 14.1 | -1.8 | |
| Majority | 1,343 | 33.5 | +2.6 | ||
| Turnout | 4,006 | 36.0 | -9.0 | ||
| Conservative hold | Swing | LD to Con 2.0 | |||
Burnden ward
| Party | Candidate | Votes | % | ± | |
|---|---|---|---|---|---|
| Labour | P Howarth | 1,280 | 22.3 | ||
| Labour | P Spencer | 1,159 | 20.2 | ||
| Conservative | M Idrees | 1,154 | 20.1 | ||
| Conservative | M Iqbal | 1,105 | 19.3 | ||
| Liberal Democrat | D Connor | 443 | 7.7 | ||
| Liberal Democrat | R Harasiwka | 340 | 5.9 | ||
| Socialist Labour | D Entwistle | 133 | 2.3 | ||
| Socialist Alliance | D Sumner | 115 | 2.0 | ||
| Turnout | 5,729 | 38.0 | +9.0 | ||
| Labour hold | Swing | ||||
| Labour hold | Swing | ||||
Central ward
| Party | Candidate | Votes | % | ± | |
|---|---|---|---|---|---|
| Labour | H Alli | 1,270 | 44.2 | -3.7 | |
| Conservative | H Simjee | 615 | 21.4 | -21.6 | |
| Independent | V Patel | 459 | 16.0 | +16.0 | |
| Liberal Democrat | M Eidlow | 278 | 9.7 | +3.1 | |
| Socialist Alliance | M Lowe | 144 | 5.0 | +5.0 | |
| Socialist Labour | M McLoughlin | 108 | 3.8 | +1.3 | |
| Majority | 655 | 22.8 | +17.9 | ||
| Turnout | 2,874 | 34.0 | +10.0 | ||
| Labour hold | Swing | Con to Ind 18.8 | |||
Daubhill ward
| Party | Candidate | Votes | % | ± | |
|---|---|---|---|---|---|
| Labour | G Harkin | 1,404 | 55.7 | +3.2 | |
| Conservative | J Groak | 690 | 27.4 | -6.7 | |
| Liberal Democrat | L Greensit | 428 | 17.0 | +3.6 | |
| Majority | 714 | 28.3 | +9.9 | ||
| Turnout | 2,522 | 28.0 | +7.0 | ||
| Labour hold | Swing | Con to LD 5.1 | |||
Deane-cum-Heaton ward
| Party | Candidate | Votes | % | ± | |
|---|---|---|---|---|---|
| Conservative | C Shaw | 2,607 | 55.4 | -4.8 | |
| Labour | J Gillatt | 1,199 | 25.5 | +0.1 | |
| Liberal Democrat | S Bromley | 902 | 19.2 | +4.8 | |
| Majority | 1,408 | 29.9 | -4.9 | ||
| Turnout | 4,708 | 34.0 | +5.0 | ||
| Conservative hold | Swing | Con to LD 4.8 | |||
Derby ward
| Party | Candidate | Votes | % | ± | |
|---|---|---|---|---|---|
| Labour | E Adia | 2,553 | 76.7 | +31.7 | |
| Conservative | G Peel | 384 | 11.5 | -36.2 | |
| Liberal Democrat | S McGeehan | 228 | 6.9 | +3.0 | |
| Socialist Labour | A Entwistle | 162 | 4.9 | +1.6 | |
| Majority | 2,169 | 65.2 | |||
| Turnout | 3,327 | 34.0 | +6.0 | ||
| Labour hold | Swing | Con to Labour 33.9 | |||
Farnworth ward
| Party | Candidate | Votes | % | ± | |
|---|---|---|---|---|---|
| Labour | J Lord | 1,141 | 59.0 | +3.1 | |
| Conservative | R O'Neill | 344 | 17.8 | -4.5 | |
| Liberal Democrat | A Higson | 317 | 16.4 | +1.0 | |
| Socialist Labour | W Kelly | 133 | 6.9 | +0.5 | |
| Majority | 797 | 41.2 | +7.6 | ||
| Turnout | 1,935 | 20.0 | -5.0 | ||
| Labour hold | Swing | Con to Labour 3.8 | |||
Halliwell ward
| Party | Candidate | Votes | % | ± | |
|---|---|---|---|---|---|
| Labour | A Zaman | 1,676 | 52.8 | +4.7 | |
| Conservative | J Coombs | 724 | 22.8 | -10.8 | |
| Liberal Democrat | M Cox | 511 | 16.1 | +5.3 | |
| Socialist Labour | H Broadbent | 169 | 5.3 | +0.6 | |
| Green | A Cartmel | 96 | 3.0 | +0.1 | |
| Majority | 952 | 30.0 | +15.5 | ||
| Turnout | 3,176 | 32.0 | +9.0 | ||
| Labour hold | Swing | Con to LD 8.0 | |||
Harper Green ward
| Party | Candidate | Votes | % | ± | |
|---|---|---|---|---|---|
| Labour | L Williamson | 1,295 | 57.3 | +3.8 | |
| Conservative | R Tyler | 506 | 22.4 | -8.0 | |
| Liberal Democrat | W Cooper | 338 | 14.9 | +3.5 | |
| Socialist Labour | W Kelly | 123 | 5.4 | +0.8 | |
| Majority | 789 | 34.9 | +11.8 | ||
| Turnout | 2,262 | 21.0 | +5.5 | ||
| Labour hold | Swing | Con to Lab 5.9 | |||
Horwich ward
| Party | Candidate | Votes | % | ± | |
|---|---|---|---|---|---|
| Liberal Democrat | R Ronson | 2,283 | 55.2 | -1.8 | |
| Labour | M Kilcoyne | 1,082 | 26.2 | +4.3 | |
| Conservative | O Fairhurst | 687 | 16.6 | -4.5 | |
| Socialist Alliance | R Ince | 85 | 2.1 | +2.1 | |
| Majority | 1,101 | 29.0 | -6.1 | ||
| Turnout | 4,137 | 36.0 | +7.0 | ||
| Liberal Democrat hold | Swing | Con to Labour 4.4 | |||
Hulton Park ward
| Party | Candidate | Votes | % | ± | |
|---|---|---|---|---|---|
| Conservative | A Morgan | 1,540 | 36.4 | -5.8 | |
| Liberal Democrat | J Cronnolley | 1,451 | 34.3 | +5.4 | |
| Labour | E Hyland | 1,236 | 29.2 | +0.4 | |
| Majority | 89 | 2.1 | -11.2 | ||
| Turnout | 4,227 | 28.0 | +7.0 | ||
| Conservative gain from Labour | Swing | Con to LD 5.6 | |||
Kearsley ward
| Party | Candidate | Votes | % | ± | |
|---|---|---|---|---|---|
| Liberal Democrat | W Collison | 1,357 | 48.4 | -5.3 | |
| Labour | D Burrows | 1,182 | 42.2 | +5.7 | |
| Conservative | S Kesler | 263 | 9.4 | -0.4 | |
| Majority | 175 | 6.2 | -11.0 | ||
| Turnout | 2,802 | 27.0 | +4.0 | ||
| Liberal Democrat gain from Labour | Swing | LD to Labour 5.5 | |||
Little Lever ward
| Party | Candidate | Votes | % | ± | |
|---|---|---|---|---|---|
| Labour | A Connell | 1,550 | 49.4 | +4.5 | |
| Conservative | J Tyler | 1,153 | 36.8 | -7.1 | |
| Liberal Democrat | B Crook | 351 | 11.2 | +0.0 | |
| Socialist Alliance | D Kemp | 81 | 2.6 | +2.6 | |
| Majority | 397 | 12.6 | +11.6 | ||
| Turnout | 3,135 | 34.0 | +8.0 | ||
| Labour hold | Swing | Con to Labour 5.8 | |||
Smithills ward
| Party | Candidate | Votes | % | ± | |
|---|---|---|---|---|---|
| Liberal Democrat | R Hayes | 1,836 | 59.0 | -5.4 | |
| Conservative | D Bagnall | 605 | 19.4 | -1.0 | |
| Labour | S Hynes | 572 | 18.4 | +3.2 | |
| Green | F Calvert | 101 | 3.2 | +3.2 | |
| Majority | 1,231 | 39.6 | -4.4 | ||
| Turnout | 3,114 | 36.0 | -6.5 | ||
| Liberal Democrat hold | Swing | LD to Labour 4.3 | |||
Tonge ward
| Party | Candidate | Votes | % | ± | |
|---|---|---|---|---|---|
| Labour | F White | 1,345 | 52.4 | +3.7 | |
| Conservative | N Ford | 879 | 34.3 | +7.7 | |
| Liberal Democrat | M Langdon | 342 | 13.3 | +6.1 | |
| Majority | 466 | 18.1 | -4.0 | ||
| Turnout | 2,566 | 32.0 | +5.5 | ||
| Labour hold | Swing | ||||
Westhoughton ward
| Party | Candidate | Votes | % | ± | |
|---|---|---|---|---|---|
| Liberal Democrat | J Silvester | 1,324 | 49.8 | -2.0 | |
| Labour | D Chadwick | 988 | 37.2 | +3.3 | |
| Conservative | J Batley | 345 | 13.0 | -1.2 | |
| Majority | 336 | 12.6 | -5.3 | ||
| Turnout | 2,657 | 28.0 | +6.0 | ||
| Liberal Democrat gain from Labour | Swing | LD to Labour 2.6 | |||
Sources
Notes
- ↑ "Bolton". BBC News Online. Retrieved 2009-12-16.
References
- Rallings, Colin; Thrasher, Michael. "Bolton Metropolitan Borough Council Election Results 1973–2012" (PDF). The Elections Centre. The Elections Centre, Plymouth University. Retrieved 12 July 2016.
| Mayor | |
|---|---|
| Bolton | |
| Bury | |
| Manchester | |
| Oldham | |
| Rochdale | |
| Salford | |
| Stockport | |
| Tameside | |
| Trafford | |
| Wigan | |
| County Council |
|
| |
This article is issued from Wikipedia - version of the 7/12/2016. The text is available under the Creative Commons Attribution/Share Alike but additional terms may apply for the media files.