Wigan Metropolitan Borough Council election, 1986
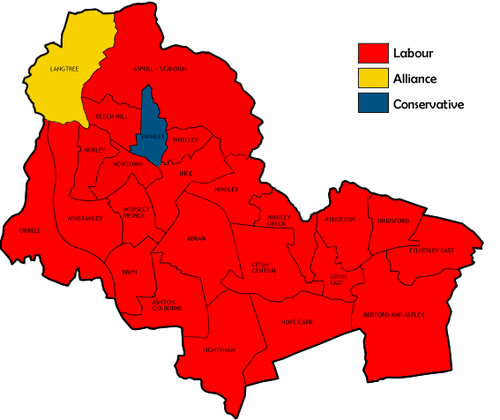
Elections to the Wigan council were held on Thursday, 8 May 1986, with one third of the seats scheduled for re-election. Since the previous election three by-elections had taken place, with Labour gaining the seat being fought in Orrell from the Conservatives as well as holding their seats in Bedford-Astley and Beech Hill. The election seen fewer contestants than any previous election since the council's creation in 1973, with a record of four seats (Abram, Hindley, Hindley Green and Leigh Central) unchallenged. Even amongst those contested there were no minor parties represented, the fewest Alliance candidates since the 1980 election and a record low of Conservative contenders at sixteen. The results were similarly record-breaking as Labour won twenty two seats, with the Conservative and Alliance majorities in their respective heartland wards - and only holds - of Swinley and Langtree reduced to slender majorities. Labour won a high of 65% share of the vote, conversely the Conservatives share fell to a low of 13.1%, with their actual vote dropping into four figures for the first time. Overall turnout rose from the preceding year's underwhelming figure of 29.2%, to a more commonplace 35.8%.[1]
Election result
| Wigan Local Election Result 1986 | ||||||||||
|---|---|---|---|---|---|---|---|---|---|---|
| Party | Seats | Gains | Losses | Net gain/loss | Seats % | Votes % | Votes | +/− | ||
| Labour | 22 | 3 | 0 | +3 | 91.7 | 65.0 | 45,205 | +2.8% | ||
| SDP–Liberal Alliance | 1 | 0 | 3 | -3 | 4.2 | 21.8 | 15,171 | +2.2% | ||
| Conservative | 1 | 0 | 0 | 0 | 4.2 | 13.1 | 9,136 | -4.9% | ||
This result had the following consequences for the total number of seats on the Council after the elections:
| Party | Previous council | New council | |||
|---|---|---|---|---|---|
| Labour | 61 | 64 | |||
| SDP-Liberal Alliance | 8 | 5 | |||
| Conservatives | 3 | 3 | |||
| Total | 72 | 72 | |||
| Working majority | 50 | 56 | |||
Ward results
| Party | Candidate | Votes | % | ± | |
|---|---|---|---|---|---|
| Labour | I. McCartney | Unopposed | N/A | N/A | |
| Labour hold | Swing | N/A | |||
| Party | Candidate | Votes | % | ± | |
|---|---|---|---|---|---|
| Labour | S. Lea | 2,124 | 72.7 | +6.4 | |
| Conservative | J. Wright | 441 | 15.1 | -2.3 | |
| SDP–Liberal Alliance | H. Crook | 358 | 12.2 | -4.1 | |
| Majority | 1,683 | 57.6 | +8.8 | ||
| Turnout | 2,923 | 30.2 | +0.8 | ||
| Labour hold | Swing | +4.3 | |||
| Party | Candidate | Votes | % | ± | |
|---|---|---|---|---|---|
| Labour | J. Hilton | 2,222 | 45.8 | +4.1 | |
| SDP–Liberal Alliance | G. Davies | 2,009 | 41.4 | -1.4 | |
| Conservative | K. Hart | 616 | 12.7 | -2.7 | |
| Majority | 213 | 4.4 | +2.0 | ||
| Turnout | 2,796 | 29.6 | -9.1 | ||
| Labour gain from SDP–Liberal Alliance | Swing | +2.7 | |||
| Party | Candidate | Votes | % | ± | |
|---|---|---|---|---|---|
| Labour | L. Sumner | 2,313 | 82.7 | +3.6 | |
| Conservative | M. Sharland | 483 | 17.3 | -3.6 | |
| Majority | 1,830 | 65.4 | +7.2 | ||
| Turnout | 2,796 | 29.6 | -9.1 | ||
| Labour hold | Swing | +3.6 | |||
| Party | Candidate | Votes | % | ± | |
|---|---|---|---|---|---|
| Labour | F. Walker | 2,051 | 67.6 | +13.1 | |
| SDP–Liberal Alliance | W. Shaw | 983 | 32.4 | +14.5 | |
| Majority | 1,068 | 35.2 | +8.4 | ||
| Turnout | 3,034 | 30.7 | -7.7 | ||
| Labour hold | Swing | -0.7 | |||
| Party | Candidate | Votes | % | ± | |
|---|---|---|---|---|---|
| Labour | J. Parkinson | 2,090 | 74.2 | +5.1 | |
| SDP–Liberal Alliance | R. Richardson | 430 | 15.2 | -1.7 | |
| Conservative | E. Nicholson | 297 | 10.5 | -3.4 | |
| Majority | 1,660 | 58.9 | +6.9 | ||
| Turnout | 2,817 | 31.9 | -0.2 | ||
| Labour hold | Swing | +3.4 | |||
| Party | Candidate | Votes | % | ± | |
|---|---|---|---|---|---|
| Labour | A. Melling | 2,649 | 78.8 | +6.1 | |
| Conservative | C. Michaels | 377 | 11.2 | -1.4 | |
| SDP–Liberal Alliance | D. Ramsdale | 337 | 10.0 | -4.8 | |
| Majority | 2,272 | 67.6 | +9.7 | ||
| Turnout | 3,363 | 33.9 | +0.9 | ||
| Labour hold | Swing | +3.7 | |||
| Party | Candidate | Votes | % | ± | |
|---|---|---|---|---|---|
| Labour | G. Green | Unopposed | N/A | N/A | |
| Labour hold | Swing | N/A | |||
| Party | Candidate | Votes | % | ± | |
|---|---|---|---|---|---|
| Labour | G. Green | Unopposed | N/A | N/A | |
| Labour hold | Swing | N/A | |||
| Party | Candidate | Votes | % | ± | |
|---|---|---|---|---|---|
| Labour | T. Wynn | Unopposed | N/A | N/A | |
| Labour hold | Swing | N/A | |||
| Party | Candidate | Votes | % | ± | |
|---|---|---|---|---|---|
| Labour | A. Wright | 2,216 | 73.3 | -8.6 | |
| SDP–Liberal Alliance | S. Jones | 806 | 26.7 | +26.7 | |
| Majority | 1,410 | 46.7 | -17.2 | ||
| Turnout | 3,022 | 28.4 | -0.9 | ||
| Labour hold | Swing | -17.6 | |||
| Party | Candidate | Votes | % | ± | |
|---|---|---|---|---|---|
| Labour | J. Hession | 2,211 | 66.1 | +5.3 | |
| Conservative | E. Manson | 1,135 | 33.9 | +2.6 | |
| Majority | 1,076 | 32.2 | +2.7 | ||
| Turnout | 3,346 | 34.4 | -3.0 | ||
| Labour hold | Swing | +1.3 | |||
| Party | Candidate | Votes | % | ± | |
|---|---|---|---|---|---|
| Labour | T. Davies | 2,357 | 88.9 | -0.3 | |
| SDP–Liberal Alliance | A. Robinson | 155 | 5.8 | -4.9 | |
| Conservative | A. Jackson | 138 | 5.2 | +5.2 | |
| Majority | 2,202 | 83.1 | +4.7 | ||
| Turnout | 2,650 | 33.4 | +5.2 | ||
| Labour hold | Swing | +2.3 | |||
| Party | Candidate | Votes | % | ± | |
|---|---|---|---|---|---|
| SDP–Liberal Alliance | R. Grayson | 2,376 | 46.9 | +1.7 | |
| Labour | T. O'Hagan | 2,201 | 43.5 | +4.6 | |
| Conservative | J. Wolstenholme | 485 | 9.6 | -6.3 | |
| Majority | 175 | 3.5 | -2.9 | ||
| Turnout | 5,062 | 47.3 | +3.6 | ||
| SDP–Liberal Alliance hold | Swing | -1.4 | |||
| Party | Candidate | Votes | % | ± | |
|---|---|---|---|---|---|
| Labour | P. Smith | Unopposed | N/A | N/A | |
| Labour hold | Swing | N/A | |||
| Party | Candidate | Votes | % | ± | |
|---|---|---|---|---|---|
| Labour | T. Harper | 2,068 | 74.1 | +10.1 | |
| Conservative | D. Angell | 723 | 25.9 | -1.8 | |
| Majority | 1,345 | 48.2 | +11.9 | ||
| Turnout | 2,791 | 27.7 | -2.1 | ||
| Labour hold | Swing | +5.9 | |||
| Party | Candidate | Votes | % | ± | |
|---|---|---|---|---|---|
| Labour | T. Sherratt | 2,955 | 67.5 | N/A | |
| Conservative | E. Morris | 807 | 18.4 | N/A | |
| SDP–Liberal Alliance | J. Wilson | 616 | 14.1 | N/A | |
| Majority | 2,148 | 49.1 | N/A | ||
| Turnout | 4,378 | 41.8 | N/A | ||
| Labour hold | Swing | N/A | |||
| Party | Candidate | Votes | % | ± | |
|---|---|---|---|---|---|
| Labour | K. Pye | 2,376 | 84.0 | +3.9 | |
| Conservative | J. Lawson | 243 | 8.6 | -4.4 | |
| SDP–Liberal Alliance | P. Gwyn | 209 | 7.4 | +0.5 | |
| Majority | 2,133 | 75.4 | +8.4 | ||
| Turnout | 2,828 | 31.5 | +1.6 | ||
| Labour hold | Swing | +4.1 | |||
| Party | Candidate | Votes | % | ± | |
|---|---|---|---|---|---|
| Labour | N. Turner | 2,499 | 88.2 | -0.0 | |
| SDP–Liberal Alliance | P. Coleman | 191 | 6.7 | +1.0 | |
| Conservative | E. Bispham | 143 | 5.0 | -1.0 | |
| Majority | 2,308 | 81.5 | -0.7 | ||
| Turnout | 2,833 | 35.4 | +2.2 | ||
| Labour hold | Swing | -0.5 | |||
| Party | Candidate | Votes | % | ± | |
|---|---|---|---|---|---|
| Labour | G. Seaward | 1,898 | 46.7 | +3.1 | |
| SDP–Liberal Alliance | H. Evans | 1,281 | 31.5 | +14.1 | |
| Conservative | J. Grimshaw | 889 | 21.9 | -17.2 | |
| Majority | 617 | 15.2 | +10.7 | ||
| Turnout | 4,068 | 39.6 | +4.0 | ||
| Labour hold | Swing | -5.5 | |||
| Party | Candidate | Votes | % | ± | |
|---|---|---|---|---|---|
| Conservative | C. Giles | 1,637 | 38.2 | -5.7 | |
| Labour | S. Turner | 1,567 | 36.6 | -0.8 | |
| SDP–Liberal Alliance | C. Rhys | 1,079 | 25.2 | +6.5 | |
| Majority | 70 | 1.6 | -4.8 | ||
| Turnout | 4,283 | 47.5 | +6.5 | ||
| Conservative hold | Swing | -2.4 | |||
| Party | Candidate | Votes | % | ± | |
|---|---|---|---|---|---|
| Labour | B. Wilson | 2,496 | 61.6 | +14.6 | |
| SDP–Liberal Alliance | G. Pickthall | 1,557 | 38.4 | -3.8 | |
| Majority | 939 | 23.2 | +18.3 | ||
| Turnout | 4,053 | 39.3 | -3.3 | ||
| Labour gain from SDP–Liberal Alliance | Swing | +9.2 | |||
| Party | Candidate | Votes | % | ± | |
|---|---|---|---|---|---|
| Labour | W. Pendleton | 2,499 | 79.9 | +3.4 | |
| SDP–Liberal Alliance | J. Kearsley | 364 | 11.6 | -4.0 | |
| Conservative | F. Sidebotham | 263 | 8.4 | +0.6 | |
| Majority | 2,135 | 68.3 | +4.3 | ||
| Turnout | 3,126 | 35.5 | +2.7 | ||
| Labour hold | Swing | +3.7 | |||
| Party | Candidate | Votes | % | ± | |
|---|---|---|---|---|---|
| Labour | W. Evans | 2,104 | 46.2 | +2.6 | |
| SDP–Liberal Alliance | J. Fitzpatrick | 1,988 | 43.7 | +1.1 | |
| Conservative | F. Fairbairn | 459 | 10.1 | -3.7 | |
| Majority | 116 | 2.5 | +1.5 | ||
| Turnout | 4,551 | 40.0 | +2.1 | ||
| Labour gain from SDP–Liberal Alliance | Swing | +0.7 | |||
| Party | Candidate | Votes | % | ± | |
|---|---|---|---|---|---|
| Labour | H. Milligan | 2,309 | 84.2 | +10.1 | |
| SDP–Liberal Alliance | A. Meal | 432 | 15.8 | +0.0 | |
| Majority | 1,877 | 68.5 | +10.1 | ||
| Turnout | 2,741 | 27.7 | -1.5 | ||
| Labour hold | Swing | +5.0 | |||
References
| London boroughs |
|
|---|---|
| Metropolitan boroughs |
|
| District councils (England) |
|
| Regional councils (Scotland) | |
| LEAs | |
| Mayor | |
|---|---|
| Bolton | |
| Bury | |
| Manchester | |
| Oldham | |
| Rochdale | |
| Salford | |
| Stockport | |
| Tameside | |
| Trafford | |
| Wigan | |
| County Council |
|
| |