Manchester City Council election, 2007
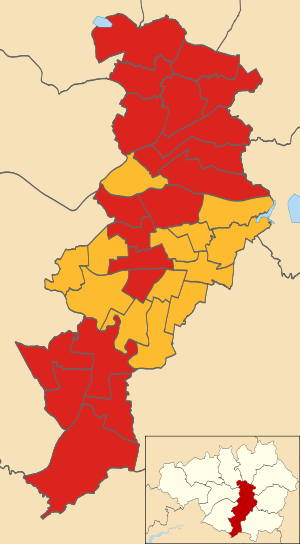
Map of the results of the 2007 Manchester council election. Labour in red and the Liberal Democrats in yellow.
Elections to Manchester City Council took place on 3 May 2007. One third of the council was up for election, with each successful candidate to serve a four-year term of office, expiring in 2011. The council stayed under Labour Party control, on a reduced turnout of 28.3%.[1][2]
Election result
| Manchester Council Election Result 2007 | ||||||||||
|---|---|---|---|---|---|---|---|---|---|---|
| Party | Seats | Gains | Losses | Net gain/loss | Seats % | Votes % | Votes | +/− | ||
| Labour | 19 | 0 | 1 | -1 | 59.4 | 45.4 | 41,213 | +0.6% | ||
| Liberal Democrat | 13 | 1 | 0 | +1 | 40.6 | 31.8 | 28,898 | +0.2% | ||
| Conservative | 0 | 0 | 0 | 0 | 0.0 | 11.0 | 9,975 | +0.5% | ||
| Green | 0 | 0 | 0 | 0 | 0.0 | 8.4 | 7,623 | -0.9% | ||
| UKIP | 0 | 0 | 0 | 0 | 0.0 | 1.1 | 1,041 | -0.1% | ||
| BNP | 0 | 0 | 0 | 0 | 0.0 | 1.1 | 972 | +0.4% | ||
| Respect | 0 | 0 | 0 | 0 | 0.0 | 0.6 | 535 | -0.1% | ||
| Socialist Alternative | 0 | 0 | 0 | 0 | 0.0 | 0.3 | 251 | +0.1% | ||
| Independent | 0 | 0 | 0 | 0 | 0.0 | 0.2 | 190 | -0.7% | ||
| United Socialist | 0 | 0 | 0 | 0 | 0.0 | 0.1 | 56 | +0.1% | ||
After the election, the composition of the council was:[3]
| Party | Seats | +/- | |
|---|---|---|---|
| Labour | 60 | -1 | |
| Liberal Democrats | 35 | +1 | |
| Green Party | 1 | 0 | |
| Labour hold | |||
Ward results
Below is a list of the 32 individual wards with the candidates standing in those wards and the number of votes the candidates acquired. The winning candidate per ward is in bold.
Ancoats and Clayton
| Party | Candidate | Votes | % | ± | |
|---|---|---|---|---|---|
| Labour | Mick Loughman* | 1,518 | 64.6 | +16.3 | |
| Liberal Democrat | Daniel Valentine | 473 | 20.1 | -20.6 | |
| Green | Victoria Album | 148 | 6.3 | +2.1 | |
| Conservative | David Hopps | 135 | 5.7 | +1.2 | |
| Independent | John Hulse | 76 | 3.2 | +0.9 | |
| Majority | 1,045 | 44.5 | +37.0 | ||
| Turnout | 2,350 | 24.4 | -8.5 | ||
| Labour hold | Swing | +18.4 | |||
Ardwick
| Party | Candidate | Votes | % | ± | |
|---|---|---|---|---|---|
| Labour | Bernard Priest* | 1,219 | 57.4 | -4.0 | |
| Liberal Democrat | Jawaid Chaudhry | 526 | 24.8 | +4.9 | |
| Green | Justine Hall | 224 | 10.6 | 0 | |
| Conservative | Kashif Ali | 155 | 7.3 | -0.7 | |
| Majority | 693 | 32.6 | -8.8 | ||
| Turnout | 2,124 | 21.5 | -0.2 | ||
| Labour hold | Swing | -4.4 | |||
Baguley
| Party | Candidate | Votes | % | ± | |
|---|---|---|---|---|---|
| Labour Co-op | Paul Andrews* | 1,268 | 52.6 | +3.6 | |
| Conservative | John Leaning | 481 | 20.0 | -0.2 | |
| Socialist Alternative | Lynn Worthington | 251 | 10.4 | +1.7 | |
| Liberal Democrat | William Fisher | 233 | 9.7 | -3.4 | |
| Green | Karen Duffy | 176 | 7.3 | -1.6 | |
| Majority | 787 | 32.7 | +4.0 | ||
| Turnout | 2,409 | 23.0 | -0.9 | ||
| Labour hold | Swing | +1.9 | |||
Bradford
| Party | Candidate | Votes | % | ± | |
|---|---|---|---|---|---|
| Labour | Rosa Battle | 1,476 | 70.8 | +1.0 | |
| Liberal Democrat | James Guise | 288 | 13.8 | -0.7 | |
| Conservative | Rodney Keller | 190 | 9.1 | +0.5 | |
| Green | Christopher Waldon | 131 | 6.3 | -0.8 | |
| Majority | 1,188 | 57.0 | +1.7 | ||
| Turnout | 2,085 | 22.3 | -3.0 | ||
| Labour hold | Swing | +0.8 | |||
Brooklands
| Party | Candidate | Votes | % | ± | |
|---|---|---|---|---|---|
| Labour | Sue Cooley* | 1,460 | 50.3 | +8.2 | |
| Conservative | Marie Raynor | 958 | 33.0 | +3.8 | |
| Liberal Democrat | David Kierman | 342 | 11.8 | -12.3 | |
| Green | Tamisin MacCarthy-Morrogh | 140 | 4.8 | +0.2 | |
| Majority | 502 | 17.3 | +4.3 | ||
| Turnout | 2,900 | 29.1 | -4.3 | ||
| Labour hold | Swing | +2.2 | |||
Burnage
| Party | Candidate | Votes | % | ± | |
|---|---|---|---|---|---|
| Liberal Democrat | Iain Donaldson* | 1,825 | 54.3 | +6.8 | |
| Labour | Frank Duffy | 1,209 | 36.0 | -2.0 | |
| Conservative | Peter Schofield | 194 | 5.8 | -2.4 | |
| Green | Joseph Gair | 132 | 3.9 | -0.9 | |
| Majority | 616 | 18.3 | +8.8 | ||
| Turnout | 3,360 | 32.0 | +2.2 | ||
| Liberal Democrat hold | Swing | +4.4 | |||
Charlestown
| Party | Candidate | Votes | % | ± | |
|---|---|---|---|---|---|
| Labour | Basil Curley* | 1,542 | 59.0 | +4.7 | |
| Conservative | Kim Glasspole | 419 | 16.0 | +1.3 | |
| Liberal Democrat | Ann Rodgers | 268 | 10.3 | -2.9 | |
| UKIP | Andrea Ritchie | 238 | 9.1 | -2.7 | |
| Green | Helen Dolan | 148 | 5.7 | -0.3 | |
| Majority | 1,123 | 42.9 | +3.3 | ||
| Turnout | 2,615 | 27.8 | -1.4 | ||
| Labour hold | Swing | +1.7 | |||
Cheetham
| Party | Candidate | Votes | % | ± | |
|---|---|---|---|---|---|
| Labour | Mohammed Khan* | 2,340 | 64.6 | +19.0 | |
| Liberal Democrat | Sham Raja | 571 | 15.8 | -27.2 | |
| Conservative | Wajid Ali | 380 | 10.5 | +5.4 | |
| Green | Jackie Smith | 332 | 9.2 | +2.9 | |
| Majority | 1,769 | 48.8 | +46.2 | ||
| Turnout | 3,623 | 31.5 | -4.7 | ||
| Labour hold | Swing | +23.1 | |||
Chorlton
| Party | Candidate | Votes | % | ± | |
|---|---|---|---|---|---|
| Liberal Democrat | Paul Ankers | 1,823 | 41.3 | +1.9 | |
| Labour | Angela Gallagher* | 1,781 | 40.4 | -1.6 | |
| Green | Brian Candeland | 544 | 12.3 | -1.7 | |
| Conservative | Claire McLauchlin | 264 | 6.0 | +1.4 | |
| Majority | 42 | 1.0 | -1.6 | ||
| Turnout | 4,412 | 43.3 | +0.3 | ||
| Liberal Democrat gain from Labour | Swing | +1.7 | |||
Chorlton Park
| Party | Candidate | Votes | % | ± | |
|---|---|---|---|---|---|
| Liberal Democrat | Tony Bethell* | 1,751 | 55.4 | +0.7 | |
| Labour Co-op | John Hacking | 739 | 23.4 | -1.9 | |
| Green | Kathryn Brownbridge | 394 | 12.5 | -0.2 | |
| Conservative | Robert Chilton | 279 | 8.8 | +1.5 | |
| Majority | 1,012 | 32.0 | +2.6 | ||
| Turnout | 3,163 | 31.0 | -1.1 | ||
| Liberal Democrat hold | Swing | +1.3 | |||
City Centre
| Party | Candidate | Votes | % | ± | |
|---|---|---|---|---|---|
| Liberal Democrat | Kenneth Dobson* | 498 | 32.8 | -5.2 | |
| Labour | Kathy Crotty | 391 | 25.8 | -1.0 | |
| Conservative | Rob Adlard | 343 | 22.6 | +0.3 | |
| Green | Birgit Vollm | 171 | 11.3 | -1.7 | |
| Independent | Kin Cheng | 114 | 7.5 | +7.5 | |
| Majority | 107 | 7.1 | -4.1 | ||
| Turnout | 1,517 | 16.0 | -0.4 | ||
| Liberal Democrat hold | Swing | -2.1 | |||
Crumpsall
| Party | Candidate | Votes | % | ± | |
|---|---|---|---|---|---|
| Labour | Con Keegan* | 1,832 | 60.1 | +10.5 | |
| Conservative | Adrian Glasspole | 564 | 18.5 | +4.3 | |
| Liberal Democrat | Muhammad Shahbaz | 398 | 13.1 | -8.8 | |
| Green | John Cummings | 254 | 8.3 | +1.7 | |
| Majority | 1,268 | 41.6 | +14.0 | ||
| Turnout | 3,048 | 29.9 | -3.9 | ||
| Labour hold | Swing | +3.1 | |||
Didsbury East
| Party | Candidate | Votes | % | ± | |
|---|---|---|---|---|---|
| Liberal Democrat | Helen Fisher* | 1,856 | 45.9 | +0.6 | |
| Labour | Geoff Bridson | 1,301 | 32.2 | -2.1 | |
| Conservative | David Fairclough | 526 | 13.0 | +4.0 | |
| Green | Gerry Gee | 359 | 8.9 | -2.6 | |
| Majority | 555 | 13.7 | +2.7 | ||
| Turnout | 4,042 | 39.1 | 0 | ||
| Liberal Democrat hold | Swing | +1.3 | |||
Didsbury West
| Party | Candidate | Votes | % | ± | |
|---|---|---|---|---|---|
| Liberal Democrat | Neil Trafford* | 1,328 | 45.7 | +2.8 | |
| Labour | David Ellison | 712 | 24.5 | -0.5 | |
| Conservative | Peter Caddick | 414 | 14.3 | -3.2 | |
| Green | James Alden | 389 | 13.4 | +1.5 | |
| UKIP | Robert Gutfreund-Walmsley | 61 | 2.1 | -0.6 | |
| Majority | 616 | 21.2 | +3.3 | ||
| Turnout | 2,904 | 29.2 | +1.2 | ||
| Liberal Democrat hold | Swing | +1.6 | |||
Fallowfield
| Party | Candidate | Votes | % | ± | |
|---|---|---|---|---|---|
| Labour | Peter Morrison* | 1,215 | 55.9 | +9.5 | |
| Liberal Democrat | John-Paul Wilkins | 478 | 22.0 | -15.2 | |
| Green | Rachel Sills | 251 | 11.6 | +5.9 | |
| Conservative | Ashton Cull | 230 | 10.6 | +4.7 | |
| Majority | 737 | 33.9 | +24.6 | ||
| Turnout | 2,174 | 20.0 | -8.1 | ||
| Labour hold | Swing | +12.3 | |||
Gorton North
| Party | Candidate | Votes | % | ± | |
|---|---|---|---|---|---|
| Liberal Democrat | Wendy Helsby* | 1,753 | 52.3 | +16.2 | |
| Labour | John Hughes | 1,365 | 40.7 | +1.0 | |
| Conservative | Joyce Kaye | 126 | 3.8 | -0.8 | |
| Green | Rachel Wilson | 107 | 3.2 | +0.7 | |
| Majority | 388 | 11.6 | +8.0 | ||
| Turnout | 3,351 | 31.6 | +0.2 | ||
| Liberal Democrat hold | Swing | +7.6 | |||
Gorton South
| Party | Candidate | Votes | % | ± | |
|---|---|---|---|---|---|
| Liberal Democrat | Simon Ashley* | 1,600 | 52.1 | +4.3 | |
| Labour | Julie Reid | 1,150 | 37.5 | +1.7 | |
| Green | Barnaby Wolfram | 134 | 4.4 | -4.1 | |
| Conservative | Lawrie Clapham | 130 | 4.2 | -3.7 | |
| United Socialist | Sabrina Jones | 56 | 1.8 | +1.8 | |
| Majority | 450 | 14.7 | +2.7 | ||
| Turnout | 3,070 | 26.9 | 0 | ||
| Liberal Democrat hold | Swing | +1.3 | |||
Harpurhey
| Party | Candidate | Votes | % | ± | |
|---|---|---|---|---|---|
| Labour | Joanne Green* | 1,497 | 58.9 | +3.6 | |
| Liberal Democrat | Robert Brettle | 355 | 14.0 | +1.5 | |
| Conservative | Harriet Holder | 294 | 11.6 | -0.2 | |
| UKIP | Roger P Bullock | 264 | 10.4 | -1.7 | |
| Green | Katherine Smith | 133 | 5.2 | -3.2 | |
| Majority | 1,142 | 44.9 | +2.1 | ||
| Turnout | 2,543 | 20.8 | -1.3 | ||
| Labour hold | Swing | +1.0 | |||
Higher Blackley
| Party | Candidate | Votes | % | ± | |
|---|---|---|---|---|---|
| Labour | Harold Lyons* | 1,449 | 48.4 | -8.6 | |
| BNP | Joseph Finnon | 716 | 23.9 | +23.9 | |
| Conservative | Vivienne Clarke | 372 | 12.4 | -7.1 | |
| Liberal Democrat | Brian Newton | 268 | 9.0 | -5.8 | |
| Green | Michael Shaw | 108 | 3.6 | -5.1 | |
| UKIP | Shirley Reeve | 82 | 2.7 | +2.7 | |
| Majority | 733 | 24.5 | -13.0 | ||
| Turnout | 2,995 | 29.7 | +3.2 | ||
| Labour hold | Swing | -16.2 | |||
Hulme
| Party | Candidate | Votes | % | ± | |
|---|---|---|---|---|---|
| Labour | Mary Murphy* | 969 | 50.1 | +12.2 | |
| Green | Steven Durrant | 630 | 32.6 | +7.6 | |
| Liberal Democrat | Oliver West | 213 | 11.0 | -15.7 | |
| Conservative | Andrew Binns | 122 | 6.3 | +1.7 | |
| Majority | 339 | 17.5 | +6.4 | ||
| Turnout | 1,934 | 20.9 | -3.2 | ||
| Labour hold | Swing | +2.3 | |||
Levenshulme
| Party | Candidate | Votes | % | ± | |
|---|---|---|---|---|---|
| Liberal Democrat | John Commons* | 1,388 | 51.2 | +1.1 | |
| Labour | Dermot Zafar | 742 | 27.4 | -0.5 | |
| Green | Peter Thompson | 334 | 12.3 | -2.0 | |
| Conservative | Anne Carroll | 248 | 9.1 | +1.3 | |
| Majority | 646 | 23.8 | +1.5 | ||
| Turnout | 2,712 | 27.0 | -1.4 | ||
| Liberal Democrat hold | Swing | +0.8 | |||
Longsight
| Party | Candidate | Votes | % | ± | |
|---|---|---|---|---|---|
| Liberal Democrat | Abid Latif Chohan* | 1,506 | 47.5 | +22.4 | |
| Labour | Sajjid Hussain | 1,188 | 37.5 | -17.1 | |
| Green | Spencer Fitzgibbon | 320 | 10.1 | -4.3 | |
| Conservative | Jane L'Anson | 157 | 5.0 | -0.9 | |
| Majority | 318 | 10.0 | -20.0 | ||
| Turnout | 3,171 | 31.4 | -0.9 | ||
| Liberal Democrat hold | Swing | +19.7 | |||
Miles Platting and Newton Heath
| Party | Candidate | Votes | % | ± | |
|---|---|---|---|---|---|
| Labour | June Hitchin* | 1,331 | 42.6 | -0.9 | |
| Liberal Democrat | Damien O'Connor | 1,270 | 40.6 | +13.8 | |
| BNP | Derek Adams | 256 | 8.2 | -8.7 | |
| Conservative | Heather Grant | 124 | 4.0 | -0.5 | |
| Green | Anthony Quinn | 75 | 2.4 | -0.8 | |
| UKIP | Lisa Duffy | 69 | 2.2 | -2.8 | |
| Majority | 61 | 2.0 | -14.7 | ||
| Turnout | 3,125 | 30.6 | +1.5 | ||
| Labour hold | Swing | -7.3 | |||
Moss Side
| Party | Candidate | Votes | % | ± | |
|---|---|---|---|---|---|
| Labour | Sameen Ali | 1,660 | 67.2 | +3.5 | |
| Liberal Democrat | Zeke Ukairo | 384 | 15.6 | -3.1 | |
| Green | George Czernuszka | 222 | 9.0 | +0.4 | |
| Conservative | Peter Young | 204 | 8.3 | +4.0 | |
| Majority | 1,276 | 51.7 | +6.7 | ||
| Turnout | 2,470 | 24.4 | -3.4 | ||
| Labour hold | Swing | +3.3 | |||
Moston
| Party | Candidate | Votes | % | ± | |
|---|---|---|---|---|---|
| Labour | Henry Cooper* | 1,760 | 55.5 | +2.4 | |
| Conservative | Tony Pinder | 637 | 20.1 | -2.5 | |
| UKIP | Peter Reeve | 327 | 10.3 | +10.3 | |
| Liberal Democrat | Timothy Hartley | 314 | 9.9 | -5.3 | |
| Green | Robin Goater | 132 | 4.2 | -4.8 | |
| Majority | 1,123 | 35.4 | +4.9 | ||
| Turnout | 3,170 | 29.2 | -2.0 | ||
| Labour hold | Swing | +2.4 | |||
Northenden
| Party | Candidate | Votes | % | ± | |
|---|---|---|---|---|---|
| Labour | Sandra Bracegirdle | 1,458 | 44.6 | -2.3 | |
| Liberal Democrat | Martin Eakins | 1,352 | 41.3 | +5.5 | |
| Conservative | Nathan Cruddas | 279 | 8.5 | -4.3 | |
| Green | Lance Crookes | 182 | 5.6 | +1.1 | |
| Majority | 106 | 3.2 | -7.9 | ||
| Turnout | 3,271 | 31.3 | +2.0 | ||
| Labour hold | Swing | -3.9 | |||
Old Moat
| Party | Candidate | Votes | % | ± | |
|---|---|---|---|---|---|
| Labour | Jeffrey Smith* | 1,382 | 53.7 | -0.7 | |
| Liberal Democrat | Richard Wilson | 748 | 29.1 | +2.2 | |
| Green | Alice Coren | 230 | 8.9 | -2.1 | |
| Conservative | Andrew Perfect | 215 | 8.4 | +0.7 | |
| Majority | 634 | 24.6 | 3.0 | ||
| Turnout | 2,575 | 25.5 | -3.7 | ||
| Labour hold | Swing | -1.4 | |||
Rusholme
| Party | Candidate | Votes | % | ± | |
|---|---|---|---|---|---|
| Liberal Democrat | Abu Chowdhury* | 1,241 | 42.3 | +2.4 | |
| Labour | Atiha Chaudry | 746 | 25.4 | -2.3 | |
| Respect | Nahella Ashraf | 535 | 18.2 | -3.0 | |
| Green | Penny Collins | 224 | 7.6 | +1.1 | |
| Conservative | Daniel Valentine | 190 | 6.5 | +1.8 | |
| Majority | 495 | 16.9 | +4.7 | ||
| Turnout | 2,936 | 30.7 | -0.8 | ||
| Liberal Democrat hold | Swing | +2.3 | |||
Sharston
| Party | Candidate | Votes | % | ± | |
|---|---|---|---|---|---|
| Labour Co-op | Joyce Keller* | 1,242 | 52.5 | -2.5 | |
| Conservative | Jimmy McCullough | 604 | 25.5 | +7.8 | |
| Liberal Democrat | Tina Dunican | 290 | 12.3 | -3.3 | |
| Green | Amanda Collins | 229 | 9.7 | -1.8 | |
| Majority | 638 | 27.0 | -10.3 | ||
| Turnout | 2,365 | 21.8 | +0.4 | ||
| Labour hold | Swing | -5.1 | |||
Whalley Range
| Party | Candidate | Votes | % | ± | |
|---|---|---|---|---|---|
| Liberal Democrat | Faraz Bhatti* | 2,030 | 50.2 | +17.6 | |
| Labour | Kath Fry | 1,418 | 35.0 | -11.1 | |
| Green | Mary Candeland | 393 | 9.7 | -3.4 | |
| Conservative | Tim Langley | 206 | 5.1 | -3.0 | |
| Majority | 612 | 15.1 | +1.6 | ||
| Turnout | 4,047 | 39.0 | +4.5 | ||
| Liberal Democrat hold | Swing | +14.3 | |||
Withington
| Party | Candidate | Votes | % | ± | |
|---|---|---|---|---|---|
| Liberal Democrat | Alison Firth* | 1,346 | 60.7 | +12.9 | |
| Labour | Andrew Simcock | 499 | 22.5 | -5.1 | |
| Green | Felicity Paris | 216 | 9.7 | -5.6 | |
| Conservative | Adele Douglas | 157 | 7.1 | -2.2 | |
| Majority | 847 | 38.2 | +17.9 | ||
| Turnout | 2,218 | 21.5 | -0.8 | ||
| Liberal Democrat hold | Swing | +9.0 | |||
Woodhouse Park
| Party | Candidate | Votes | % | ± | |
|---|---|---|---|---|---|
| Labour | Barbara O'Neil* | 1,354 | 65.3 | +3.8 | |
| Conservative | Stephen Heath | 378 | 18.2 | +2.4 | |
| Liberal Democrat | Joseph Podbylski | 182 | 8.8 | -5.2 | |
| Green | Jody Bradford | 161 | 7.8 | -0.9 | |
| Majority | 976 | 47.0 | +1.3 | ||
| Turnout | 2,075 | 21.2 | -0.6 | ||
| Labour hold | Swing | +0.7 | |||
By-elections between 2007 and 2008
| Party | Candidate | Votes | % | ± | |
|---|---|---|---|---|---|
| Labour | Veronica Kirkpatrick | 1373 | 54.7 | -4.3 | |
| BNP | Joseph G M Finnon | 628 | 25.0 | +25.0 | |
| Liberal Democrat | Carol Connell | 239 | 9.5 | -0.8 | |
| Conservative | Kim E Glasspole | 188 | 7.5 | -8.5 | |
| Green | Jackie Smith | 81 | 3.2 | -2.5 | |
| Majority | 745 | 29.6 | -13.3 | ||
| Turnout | 2,509 | 26.5 | -1.3 | ||
| Labour hold | Swing | -14.6 | |||
References
- 1 2 3 4 5 6 7 8 9 10 11 12 13 14 15 16 17 18 19 20 21 22 23 24 25 26 27 28 29 30 31 32 33 "Local Election Results 2007". manchester.gov.uk. Retrieved 2012-01-18.
- 1 2 3 4 5 6 7 8 9 10 11 12 13 14 15 16 17 18 19 20 21 22 23 24 25 26 27 28 29 30 31 32 33 "Local Election Archive: 2007 - Manchester". andrewteale.me.uk. Retrieved 2012-01-18.
- ↑ "Vote 2007: Manchester". BBC. Retrieved 2012-01-18.
- ↑ "By-election results: 2006-2011". manchester.gov.uk. Retrieved 2012-01-19.
| Mayor | |
|---|---|
| Bolton | |
| Bury | |
| Manchester | |
| Oldham | |
| Rochdale | |
| Salford | |
| Stockport | |
| Tameside | |
| Trafford | |
| Wigan | |
| County Council |
|
| |
This article is issued from Wikipedia - version of the 9/26/2014. The text is available under the Creative Commons Attribution/Share Alike but additional terms may apply for the media files.