Windsor—Tecumseh (provincial electoral district)
For the federal electoral district, see Windsor—Tecumseh.
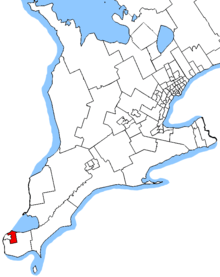 Windsor—Tecumseh in relation to the other southwestern Ontario ridings | |||
| Provincial electoral district | |||
| Legislature | Legislative Assembly of Ontario | ||
| MPP |
| ||
| District created |
2006 (Windsor—Tecumseh) 1996 (Windsor—St. Clair) | ||
| First contested | 1999 | ||
| Last contested | 2014 | ||
| Demographics | |||
| Population (2011) | 115,528 | ||
| Electors (2013) | 84,998 | ||
| Area (km²) | 174 | ||
| Pop. density (per km²) | 664 | ||
| Census divisions | Essex | ||
| Census subdivisions | Windsor, Tecumseh | ||
Windsor—Tecumseh is a provincial electoral district in Ontario, Canada, that has been represented in the Legislative Assembly of Ontario since the 2007 provincial election and as Windsor—St. Clair for the 1999 provincial election and 2003 provincial elections.
It was created in 1996 from parts of Windsor—Riverside and Windsor—Walkerville.
It consists of the Town of Tecumseh, and the part of the City of Windsor lying east and north of a line drawn from the U.S. border southeast along Langlois Avenue, east along Tecumseh Road East, and southeast along Pillette Road to the southern city limit.
Members of Provincial Parliament
| Windsor—St. Clair | ||||
|---|---|---|---|---|
| Assembly | Years | Member | Party | |
| Riding created from Windsor—Riverside and Windsor—Walkerville | ||||
| 37th | 1999–2003 | Dwight Duncan | Liberal | |
| 38th | 2003–2007 | |||
| Riding renamed — Windsor—Tecumseh | ||||
| 39th | 2007–2011 | Dwight Duncan | Liberal | |
| 40th | 2011–2013 | |||
| 2013–2014 | Percy Hatfield | New Democratic | ||
| 41st | 2014–Present | |||
Election results
Windsor—Tecumseh
| Ontario general election, 2014 | ||||||||
|---|---|---|---|---|---|---|---|---|
| Party | Candidate | Votes | % | ∆% | ||||
| New Democratic | Percy Hatfield | 22,826 | 62.11 | +0.84 | ||||
| Liberal | Jason Dupuis | 5,605 | 15.25 | +3.31 | ||||
| Progressive Conservative | Brandon Wright | 5,485 | 14.93 | -5.18 | ||||
| Green | Adam Wright | 2,144 | 5.83 | +4.38 | ||||
| Libertarian | Timothy Joel Marshall | 688 | 1.87 | +0.31 | ||||
| Total valid votes | 36,748 | 100.0 | ||||||
| New Democratic hold | Swing | -1.24 | ||||||
| Source: Elections Ontario[1] | ||||||||
| Ontario provincial by-election, August 1, 2013 Resignation of Dwight Duncan | ||||||||
|---|---|---|---|---|---|---|---|---|
| Party | Candidate | Votes | % | ∆% | ||||
| New Democratic | Percy Hatfield | 15,682 | 61.27 | +28.43 | ||||
| Progressive Conservative | Robert de Verteuil | 5,147 | 20.11 | -0.71 | ||||
| Liberal | Jeewen Gill | 3,057 | 11.94 | -30.89 | ||||
| Green | Adam Wright | 942 | 3.68 | +1.45 | ||||
| Libertarian | Dan Dominato | 400 | 1.56 | +0.28 | ||||
| Family Coalition | Lee Watson | 241 | 0.94 | |||||
| Freedom | Andrew Brannan | 124 | 0.48 | |||||
| Total valid votes | 25,593 | 100.00 | ||||||
| Total rejected, unmarked and declined ballots | 225 | 0.87 | ||||||
| Turnout | 25,818 | 30.35 | ||||||
| Eligible voters | 85,075 | |||||||
| New Democratic gain from Liberal | Swing | +14.57 | ||||||
| Source: Elections Ontario[2] | ||||||||
| Ontario general election, 2011 | ||||||||
|---|---|---|---|---|---|---|---|---|
| Party | Candidate | Votes | % | ∆% | ||||
| Liberal | Dwight Duncan | 15,946 | 42.83 | -6.51 | ||||
| New Democratic | Andrew McAvoy | 12,228 | 32.84 | +8.48 | ||||
| Progressive Conservative | Robert de Verteuil | 7,751 | 20.82 | +3.98 | ||||
| Green | Justin Levesque | 830 | 2.23 | -5.20 | ||||
| Libertarian | Dan Dominato | 476 | 1.28 | |||||
| Total valid votes | 37,231 | 100.00 | ||||||
| Total rejected, unmarked and declined ballots | 222 | 0.59 | ||||||
| Turnout | 37,453 | 44.69 | ||||||
| Eligible voters | 83,807 | |||||||
| Liberal hold | Swing | -7.50 | ||||||
| Source:Elections Ontario[3] | ||||||||
| Ontario general election, 2007 | ||||||||
|---|---|---|---|---|---|---|---|---|
| Party | Candidate | Votes | % | ∆% | ||||
| Liberal | Dwight Duncan | 17,894 | 49.34 | -4.31 | ||||
| New Democratic | Helmi Charif | 8,836 | 24.36 | -4.78 | ||||
| Progressive Conservative | Kristine Robinson | 6,106 | 16.84 | +4.81 | ||||
| Green | Andrew McAvoy | 2,696 | 7.43 | |||||
| Family Coalition | John Curtin | 735 | 2.03 | |||||
| Total valid votes | 36,267 | 100.0 | ||||||
| Difference | 9,058 | 24.98 | ||||||
| Total rejected ballots | 383 | 1.05 | ||||||
| Turnout | 36,650 | 44.04 | ||||||
| Liberal hold | Swing | +0.23 | ||||||
Source:[4]
^ Change is based on redistributed results.[5]
Windsor—St. Clair
| Ontario general election, 2003 | ||||||||
|---|---|---|---|---|---|---|---|---|
| Party | Candidate | Votes | % | ∆% | ||||
| Liberal | Dwight Duncan | 19,692 | 54.92 | +9.83 | ||||
| New Democratic | Madeline Crnec | 10,433 | 29.10 | -5.06 | ||||
| Progressive Conservative | Matt Bufton | 4,162 | 11.61 | -7.17 | ||||
| Green | Chris Holt | 1,315 | 3.67 | +2.79 | ||||
| Ontario general election, 1999 | ||||||||
|---|---|---|---|---|---|---|---|---|
| Party | Candidate | Votes | % | |||||
| Liberal | Dwight Duncan | 17,383 | 45.09 | |||||
| New Democratic | Wayne Lessard | 13,171 | 34.16 | |||||
| Progressive Conservative | Mike Rohrer | 7,241 | 18.78 | |||||
| Green | Darren Brown | 339 | 0.88 | |||||
| Total valid votes | 38,134 | 100.0 | ||||||
2007 electoral reform referendum
| Ontario electoral reform referendum, 2007 | |||
|---|---|---|---|
| Side | Votes | % | |
| First Past the Post | 22,717 | 64.5 | |
| Mixed member proportional | 12,482 | 35.5 | |
| Total valid votes | 35,199 | 100.0 | |
Sources
- ↑ Elections Ontario (2014). "General Election Results by District, 102 Windsor-Tecumseh". Retrieved 13 June 2014.
- ↑ Elections Ontario (2013). "2013 By-election results - Windsor—Tecumseh". Retrieved 2 June 2014.
- ↑ Elections Ontario (2011). "Official return from the records / Rapport des registres officiels - Windsor—Tecumseh" (PDF). Retrieved 2 June 2014.
- ↑ http://www.elections.on.ca/NR/rdonlyres/DB6BC6BC-592B-4AD0-AD30-005D8EA16753/0/102WindsorTecumsehpollbypoll.pdf
- ↑ http://www.electionprediction.org/2007_on/riding/102.php
Coordinates: 42°17′35″N 82°54′00″W / 42.293°N 82.900°W
This article is issued from Wikipedia - version of the 6/13/2016. The text is available under the Creative Commons Attribution/Share Alike but additional terms may apply for the media files.