Bruce—Grey—Owen Sound (provincial electoral district)
Bruce—Grey—Owen Sound Ontario electoral district Ontario electoral district |
|---|
|
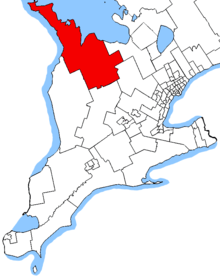
Bruce—Grey—Owen Sound in relation to other southwestern Ontario electoral districts |
| Provincial electoral district |
|---|
| Legislature |
Legislative Assembly of Ontario |
|---|
| MPP |
Bill Walker
Progressive Conservative |
|---|
| District created |
1999 |
|---|
| First contested |
1999 |
|---|
| Last contested |
2014 |
|---|
| Demographics |
|---|
| Population (2006) |
105,947 |
|---|
| Electors (2007) |
68,722 |
|---|
| Area (km²) |
6,447 |
|---|
| Pop. density (per km²) |
16.4 |
|---|
| Census divisions |
Bruce County, Ontario, Grey County, Ontario |
|---|
| Census subdivisions |
West Grey, Hanover, Chatsworth, Meaford, Owen Sound, Georgian Bluffs, Arran-Elderslie, South Bruce Peninsula, Northern Bruce Peninsula, Neyaashiinigmiing, Saugeen 29, Southgate, Grey Highlands |
|---|
Bruce—Grey—Owen Sound is a provincial electoral district in western Ontario, Canada. It elects one member to the Legislative Assembly of Ontario.
It was created in 1999 from parts of Bruce and Grey when ridings in Ontario were redistributed to match their federal counterparts.
The riding from 1999 to 2007 included the municipalities of West Grey, Hanover, Chatsworth, Meaford, Owen Sound, Georgian Bluffs, Arran-Elderslie, South Bruce Peninsula, Northern Bruce Peninsula, Neyaashiinigmiing, Saugeen 29, plus the eastern half of Brockton and South Bruce plus the northern third of Grey Highlands.
In 2007, the riding gained the municipality of Southgate, the rest of Grey Highlands, but lost the parts of Brockton and South Bruce in the riding.
The riding is notable for running a Green Party of Ontario candidate who received 33.1% of the popular vote in the 2007 election, the largest share of the popular vote the party has ever received in a single riding.
Members
Election results
| Ontario general election, 2011 |
| Party |
Candidate |
Votes | % | ∆% |
|
Progressive Conservative | Bill Walker | 19,567 | 47.37 | +0.76 |
|
Liberal | Kevin Eccles | 10,889 | 26.36 | +11.43 |
|
New Democratic | Paul Johnstone | 6,133 | 14.85 | +11.06 |
|
Green | Don Marshall | 2,654 | 6.43 | -26.71 |
|
Independent | Shane Jolley | 1,478 | 3.58 | -29.56 |
|
Family Coalition | Joel Kidd | 339 | 0.82 | -0.39 |
|
Libertarian | Jay Miller | 246 | 0.60 | |
| Total valid votes |
41,306 | 100.00 |
| Total rejected, unmarked and declined ballots |
164 | 0.40 |
| Turnout |
41,470 | 54.70 |
| Eligible voters |
75,809 |
|
Progressive Conservative hold |
Swing |
-5.34
|
| Source: Elections Ontario[2] |
2007 electoral reform referendum
Sources
|
|---|
|
| Northern | |
|---|
|
| Eastern | |
|---|
|
| Central | |
|---|
|
| Midwestern | |
|---|
|
| Southwestern | |
|---|
|
Brampton, Mississauga
& Oakville | |
|---|
|
Hamilton, Burlington
& Niagara | |
|---|
|
| Ottawa | |
|---|
|
| South Durham, York | |
|---|
|
| Toronto | |
|---|
|
|
Coordinates: 44°N 81°W / 44°N 81°W / 44; -81