Glengarry—Prescott—Russell (provincial electoral district)
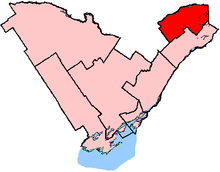 Glengarry—Prescott—Russell in relation to other eastern Ontario electoral districts | |||
| Provincial electoral district | |||
| Legislature | Legislative Assembly of Ontario | ||
| MPP |
| ||
| District created | 1996 | ||
| First contested | 1999 | ||
| Last contested | 2014 | ||
| Demographics | |||
| Population (2011) | 112,212 | ||
| Electors (2007) | 73,422 | ||
| Area (km²) | 3,049 | ||
| Pop. density (per km²) | 36.8 | ||
| Census divisions | Ottawa, Prescott and Russell United Counties, United Counties of Stormont, Dundas and Glengarry | ||
| Census subdivisions | Clarence-Rockland, Russell, Alfred and Plantagenet, the Nation, Casselman, Hawkesbury, Champlain, North Glengarry, South Glengarry, Ottawa | ||
Glengarry—Prescott—Russell is a provincial electoral district in eastern Ontario, Canada. It elects one member to the Legislative Assembly of Ontario.
It was created in 1996 from parts of Prescott and Russell and Stormont, Dundas and Glengarry when ridings were redistributed to match their federal counterparts.
From 1996 to 2005 the riding included the municipalities of Clarence-Rockland, Township of Russell, Alfred and Plantagenet, the Nation, Casselman, Hawkesbury, Champlain, North Glengarry and the eastern half of South Glengarry plus that part of Ottawa located in the former municipality of Cumberland, Ontario except for that part of Cumberland north of Innes Road and west of Trim Road.
In 2005, the riding lost the eastern half of South Glengarry and it also lost that part of the riding between Innes Road and Wall Road west of Trim Road.
Members of Provincial Parliament
| Glengarry—Prescott—Russell | ||||
|---|---|---|---|---|
| Assembly | Years | Member | Party | |
| Riding created from Prescott and Russell and Stormont, Dundas and Glengarry |
||||
| 37th | 1999–2003 | Jean-Marc Lalonde | Liberal | |
| 38th | 2003–2007 | |||
| 39th | 2007–2011 | |||
| 40th | 2011–2014 | Grant Crack | ||
| 41st | 2014–Present | |||
Election results
| Ontario general election, 2014 | ||||||||
|---|---|---|---|---|---|---|---|---|
| Party | Candidate | Votes | % | ∆% | ||||
| Liberal | Grant Crack | 23,565 | 49.74 | +6.56 | ||||
| Progressive Conservative | Roxane Villeneuve Robertson | 15,429 | 32.57 | −7.19 | ||||
| New Democratic | Isabelle Sabourin | 5,902 | 12.46 | −1.88 | ||||
| Green | Raymond St. Martin | 1,528 | 3.23 | +1.31 | ||||
| Libertarian | Darcy Neal Donnelly | 422 | 0.89 | +0.39 | ||||
| Independent | Marc-Antoine Gagnier | 296 | 0.62 | – | ||||
| Freedom | Carl Leduc | 233 | 0.49 | +0.08 | ||||
| Total valid votes | 47,375 | 100.0 | +17.74 | |||||
| Liberal hold | Swing | +6.88 | ||||||
Source(s)
Elections Ontario (2014). "Official result from the records – 026, Glengarry—Prescott—Russell" (PDF). Retrieved 27 June 2015. | ||||||||
| Ontario general election, 2011 | ||||||||
|---|---|---|---|---|---|---|---|---|
| Party | Candidate | Votes | % | ∆% | Expenditures | |||
| Liberal | Grant Crack | 17,345 | 43.18 | −17.33 | $ 59,831.34 | |||
| Progressive Conservative | Marilissa Gosselin | 15,973 | 39.76 | +12.60 | 59,115.64 | |||
| New Democratic | Bonnie Jean-Louis | 5,721 | 14.24 | +8.57 | 4,615.13 | |||
| Green | Taylor Howarth | 770 | 1.92 | −3.91 | 250.88 | |||
| Libertarian | Phil Miller | 199 | 0.50 | 0.00 | ||||
| Freedom | Carl Leduc | 164 | 0.41 | 0.00 | ||||
| Total valid votes / Expense limit | 40,172 | 100.0 | −0.15 | $ 100,656.15 | ||||
| Total rejected, unmarked and declined ballots | 269 | 0.67 | +0.02 | |||||
| Turnout | 40,441 | 47.81 | −4.99 | |||||
| Eligible voters | 84,584 | +10.27 | ||||||
| Liberal hold | Swing | −14.97 | ||||||
Source(s) | ||||||||
| Ontario general election, 2007 | ||||||||
|---|---|---|---|---|---|---|---|---|
| Party | Candidate | Votes | % | ∆% | Expenditures | |||
| Liberal | Jean-Marc Lalonde | 24,345 | 60.51 | −5.46 | $ 54,480.27 | |||
| Progressive Conservative | Denis Pommainville | 10,927 | 27.16 | +2.28 | 50,740.94 | |||
| Green | Karolyne Pickett | 2,344 | 5.83 | +2.47 | 3,894.85 | |||
| New Democratic | Josée Blanchette | 2,281 | 5.67 | −0.13 | 2,947.31 | |||
| Family Coalition | Vicki Gunn | 337 | 0.84 | 0.00 | ||||
| Total valid votes/Expense limit | 40,234 | 100.0 | −8.33 | $ 82,841.40 | ||||
| Total rejected ballots | 263 | 0.65 | −0.22 | |||||
| Turnout | 40,497 | 52.80 | −4.80 | |||||
| Eligible voters | 76,705 | −0.20 | ||||||
Source(s) | ||||||||
| Ontario general election, 2003 | ||||||||
|---|---|---|---|---|---|---|---|---|
| Party | Candidate | Votes | % | ∆% | Expenditures | |||
| Liberal | Jean-Marc Lalonde | 28,956 | 65.97 | +10.59 | $ 56,674.18 | |||
| Progressive Conservative | Albert Bourdeau | 10,921 | 24.88 | −14.26 | 55,702.93 | |||
| New Democratic | Guy Belle-Isle | 2,544 | 5.80 | +1.28 | 3,885.05 | |||
| Green | Louise Pattington | 1,471 | 3.35 | 1,726.57 | ||||
| Total valid votes/Expense limit | 43,892 | 100.0 | −1.06 | $ 73,787.52 | ||||
| Total rejected ballots | 383 | 0.87 | −0.16 | |||||
| Turnout | 44,275 | 57.60 | −2.65 | |||||
| Eligible voters | 76,862 | +3.31 | ||||||
| Ontario general election, 1999 | ||||||||
|---|---|---|---|---|---|---|---|---|
| Party | Candidate | Votes | % | Expenditures | ||||
| Liberal | Jean-Marc Lalonde | 24,568 | 55.38 | $ 50,867.45 | ||||
| Progressive Conservative | Alain Lalonde | 17,364 | 39.14 | 69,298.00 | ||||
| New Democratic | Stéphane Landry | 2,007 | 4.52 | 9,669.52 | ||||
| Natural Law | Mary Glasser | 425 | 0.96 | 0.00 | ||||
| Total valid votes/Expense limit | 44,364 | 100.0 | $ 71,424.96 | |||||
| Total rejected ballots | 460 | 1.03 | ||||||
| Turnout | 44,824 | 60.25 | ||||||
| Eligible voters | 74,401 | |||||||
2007 electoral reform referendum
| Ontario electoral reform referendum, 2007 | |||
|---|---|---|---|
| Side | Votes | % | |
| First Past the Post | 28,549 | 73.8 | |
| Mixed Member Proportional | 10,108 | 26.2 | |
| Total valid votes | 38,657 | 100.0 | |
Coordinates: 45°25′N 75°08′W / 45.42°N 75.13°W