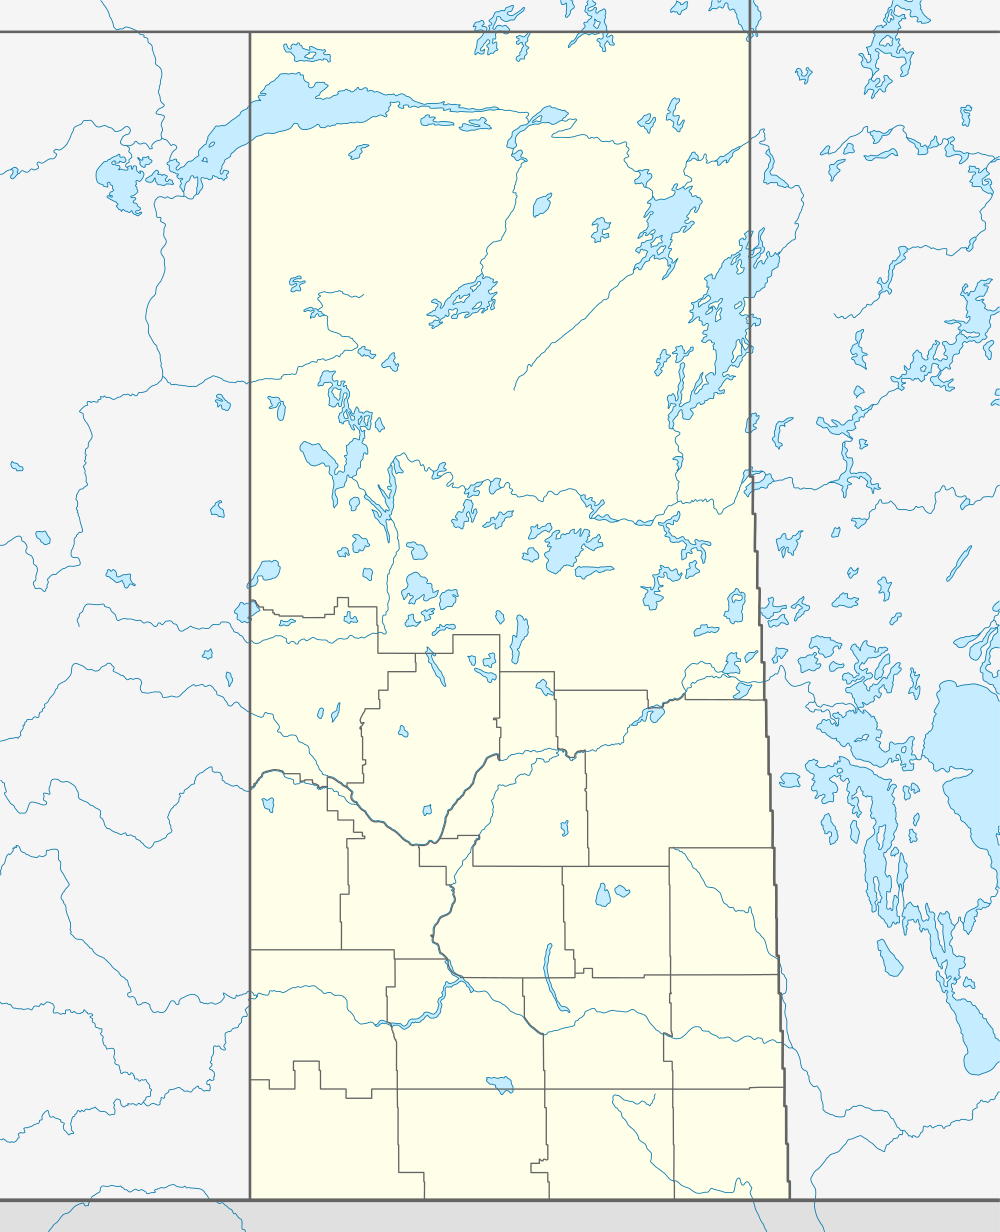
Wapella, Saskatchewan
For other uses, see Wapella.
| Town of Wapella | |
|---|---|
| Town | |
 Town of Wapella 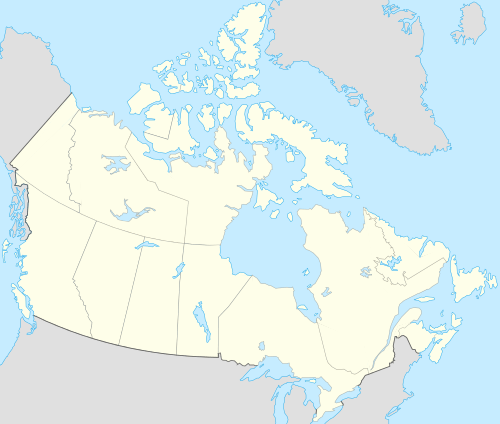 Town of Wapella | |
| Coordinates: 50°15′04″N 101°58′44″W / 50.251083°N 101.978966°WCoordinates: 50°15′04″N 101°58′44″W / 50.251083°N 101.978966°W | |
| Country | Canada |
| Province | Saskatchewan |
| Region | Southeast Saskatchewan |
| Census division | 5 |
| Rural Municipality | Martin |
| Government | |
| • Mayor | Sandy Hintz |
| • Town Administrator | Lila Sippola |
| • Governing body | Wapella Town Council |
| Area | |
| • Total | 838.836 km2 (323.876 sq mi) |
| Elevation | 587 m (1,926 ft) |
| Population (2001) | |
| • Total | 354 |
| Time zone | CST |
| Postal code | S0G 4Z0 |
| Area code(s) | 306 |
| Highways | Highway |
| [1][2][3][4] | |
Wapella is a town of 354 located northwest of Moosomin on the Trans-Canada Highway.
Demographics
| Canada census – Wapella, Saskatchewan community profile | |||
|---|---|---|---|
| 2001 | |||
| Population: | 354 (-8.5% from 1996) | ||
| Land area: | 2.57 km2 (0.99 sq mi) | ||
| Population density: | 138.0/km2 (357/sq mi) | ||
| Median age: | 36.6 (M: 35.4, F: 38.0) | ||
| Total private dwellings: | 170 | ||
| Median household income: | $38,244 | ||
| References: 2001[5] | |||
Notable people
- Brett Clark - professional hockey player in NHL. He has played in the Canadian National team program, as well as for Montreal Canadiens, Atlanta Thrashers, Colorado Avalanche, Tampa Bay Lightning, and now with the Minnesota Wild.
- Bud Holloway, a professional hockey player. He currently plays (2015/2016 season) for the St. John's IceCaps in the AHL. He has previously played for SC Bern in the National League A, it is the top tier of the Swiss hockey league system, for the Skellefteå AIK in the SHL and for the Manchester Monarchs, the AHL affiliate of the Los Angeles Kings.
- Cyril Edel Leonoff is the grandson of Edel Brotman, a homesteader and rabbi of the Wapella, Saskatchewan, farm colony, 1889-1906.[6]
Climate
| Climate data for Wapella | |||||||||||||
|---|---|---|---|---|---|---|---|---|---|---|---|---|---|
| Month | Jan | Feb | Mar | Apr | May | Jun | Jul | Aug | Sep | Oct | Nov | Dec | Year |
| Record high °C (°F) | 8 (46) |
9 (48) |
21 (70) |
32.5 (90.5) |
36.5 (97.7) |
35.5 (95.9) |
38 (100) |
37.5 (99.5) |
33.5 (92.3) |
29.5 (85.1) |
22.5 (72.5) |
12 (54) |
38 (100) |
| Average high °C (°F) | −10.5 (13.1) |
−6.7 (19.9) |
−0.3 (31.5) |
10 (50) |
17.8 (64) |
21.8 (71.2) |
24.4 (75.9) |
24 (75) |
17.6 (63.7) |
10 (50) |
−1.3 (29.7) |
−8.6 (16.5) |
8.2 (46.8) |
| Daily mean °C (°F) | −15.8 (3.6) |
−11.4 (11.5) |
−5.2 (22.6) |
3.9 (39) |
11 (52) |
15.5 (59.9) |
18.1 (64.6) |
17.3 (63.1) |
11.4 (52.5) |
4.6 (40.3) |
−5.5 (22.1) |
−13.4 (7.9) |
2.5 (36.5) |
| Average low °C (°F) | −21 (−6) |
−16.2 (2.8) |
−10.2 (13.6) |
−2.2 (28) |
4.2 (39.6) |
9.2 (48.6) |
11.6 (52.9) |
10.6 (51.1) |
5 (41) |
−0.9 (30.4) |
−9.7 (14.5) |
−18.1 (−0.6) |
−3.1 (26.4) |
| Record low °C (°F) | −42 (−44) |
−41 (−42) |
−35.5 (−31.9) |
−23.5 (−10.3) |
−11.5 (11.3) |
−2 (28) |
2 (36) |
−3.5 (25.7) |
−7.5 (18.5) |
−21 (−6) |
−36.5 (−33.7) |
−42 (−44) |
−42 (−44) |
| Average precipitation mm (inches) | 19.8 (0.78) |
16.9 (0.665) |
21.8 (0.858) |
21.1 (0.831) |
49.5 (1.949) |
70.5 (2.776) |
69.7 (2.744) |
66 (2.6) |
47.9 (1.886) |
27.8 (1.094) |
18.5 (0.728) |
16.4 (0.646) |
445.7 (17.547) |
| Source: Environment Canada[7] | |||||||||||||
See also
External links
- 2001 Community Profiles
- Saskatchewan Roman Catholic Churches ~ Online Parish Registers ~ History >> Moosomin - Wapella.
- Wapella Town Council
Footnotes
- ↑ National Archives, Archivia Net, Post Offices and Postmasters
- ↑ Government of Saskatchewan, MRD Home, Municipal Directory System, archived from the original on November 21, 2008
- ↑ Canadian Textiles Institute. (2005), CTI Determine your provincial constituency
- ↑ Commissioner of Canada Elections, Chief Electoral Officer of Canada (2005), Elections Canada On-line
- ↑ "2001 Community Profiles". Canada 2001 Census. Statistics Canada. February 17, 2012.
- ↑ Cyril E. Leonoff fonds , Jewish Historical Society of British Columbia
- ↑ Environment Canada - Canadian Climate Normals 1971-2000—Canadian Climate Normals 1971–2000, accessed 23 December 2010
 |
Esterhazy | | ||
| Whitewood | |
Moosomin | ||
| ||||
| | ||||
| Kelso |
This article is issued from Wikipedia - version of the 9/10/2016. The text is available under the Creative Commons Attribution/Share Alike but additional terms may apply for the media files.