Meath County Council election, 2009
Meath County Council election, 2009

|
|
|
|
|
|
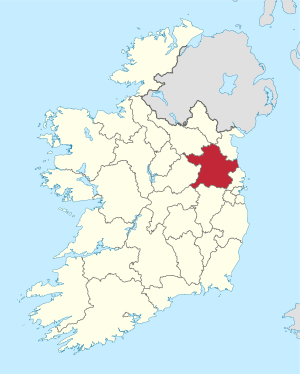
| Map showing the area of Meath County Council |
|
Council control after election
TBD
|
|
|
An election to Meath County Council took place on 5 June 2009 as part of that year's Irish local elections. 29 councillors were elected from five electoral divisions by PR-STV voting for a five-year term of office.
Results by party
Results by Electoral Area
Dunshaughlin
| Dunshaughlin - 7 seats |
| Party | Candidate | % 1st Pref | Count 1 | Count 2 | Count 3 | Count 4 | Count 5 | Count 6 | Count 7 | Count 8 | Count 9 | Count 10 | Count 11 | Count 12 | Count 13 | Count 14 |
|
Independent |
Brian Fitzgerald* |
14.27 |
2,410 |
|
|
|
|
|
|
|
|
|
|
|
|
|
|
Fianna Fáil |
Nick Killian* |
12.33 |
2,066 |
2,090 |
2,102 |
2,121 |
|
|
|
|
|
|
|
|
|
|
|
Fine Gael |
Regina Doherty |
9.69 |
1,636 |
1,671 |
1,706 |
1,724 |
1,738 |
1,770 |
1,912 |
1,972 |
2,346 |
|
|
|
|
|
|
Independent |
Joe Bonner* |
9.32 |
1,574 |
1,587 |
1,619 |
1,667 |
1,755 |
1,783 |
2,095 |
2,132 |
|
|
|
|
|
|
|
Fianna Fáil |
Noel Leonard* |
6.33 |
1,070 |
1,106 |
1,121 |
1,137 |
1,140 |
1,167 |
1,189 |
1,541 |
1,563 |
1,575 |
1,580 |
1,583 |
1,639 |
1,666 |
|
Fine Gael |
Maria Murphy |
6.22 |
1,050 |
1,078 |
1,093 |
1,101 |
1,102 |
1,184 |
1,213 |
1,233 |
1,285 |
1,382 |
1,383 |
1,383 |
1,881 |
1,999 |
|
Fine Gael |
Gerry O'Connor |
6.22 |
1,050 |
1,070 |
1,092 |
1,107 |
1,108 |
1,142 |
1,173 |
1,286 |
1,336 |
1,371 |
1,374 |
1,377 |
|
|
|
Labour Party |
Niamh McGowan |
5.61 |
947 |
961 |
980 |
1,021 |
1,244 |
1,580 |
1,684 |
1,733 |
1,949 |
2,018 |
2,025 |
2,026 |
2,350 |
|
|
Fianna Fáil |
Conor Tormey |
5.55 |
938 |
943 |
947 |
959 |
982 |
983 |
1,031 |
1,150 |
1,365 |
1,386 |
1,390 |
1,392 |
1,424 |
1,438 |
|
Fianna Fáil |
Oliver Brooks* |
5.27 |
890 |
920 |
956 |
969 |
970 |
989 |
1,014 |
|
|
|
|
|
|
|
|
Fine Gael |
John Fanning |
5.19 |
876 |
883 |
889 |
892 |
975 |
983 |
1,061 |
1,079 |
|
|
|
|
|
|
|
Independent |
Charles Bobbett* |
4.42 |
746 |
772 |
810 |
850 |
871 |
887 |
|
|
|
|
|
|
|
|
|
Labour Party |
Michael McLoughlin |
3.15 |
532 |
551 |
569 |
607 |
646 |
|
|
|
|
|
|
|
|
|
|
Labour Party |
John King |
2.88 |
486 |
493 |
503 |
516 |
|
|
|
|
|
|
|
|
|
|
|
Sinn Féin |
Micheal O Gallachoir |
1.90 |
321 |
328 |
352 |
|
|
|
|
|
|
|
|
|
|
|
|
Independent |
Patrick Long |
0.93 |
157 |
175 |
|
|
|
|
|
|
|
|
|
|
|
|
|
Green Party |
Seán O Buachalla |
0.84 |
142 |
150 |
|
|
|
|
|
|
|
|
|
|
|
|
| Electorate: 33,513 Valid: 16,891 (50.40%) Spoilt: 133 Quota: 2,112 Turnout: 17,024 (50.80%) |
Kells
| Kells - 5 seats |
| Party | Candidate | % 1st Pref | Count 1 | Count 2 | Count 3 | Count 4 | Count 5 |
|
Fine Gael |
Catherine Yore |
12.87 |
1,751 |
1,805 |
2,086 |
2,357 |
|
|
Fine Gael |
Eugene Cassidy* |
12.71 |
1,730 |
1,907 |
2,104 |
2,119 |
2,136 |
|
Fine Gael |
John V. Farrelly* |
12.41 |
1,688 |
1,761 |
2,027 |
2,209 |
2,246 |
|
Fianna Fáil |
Oliver Fox |
11.67 |
1,588 |
1,681 |
1,717 |
1,999 |
2,221 |
|
Fianna Fáil |
Bryan Reilly* |
11.36 |
1,545 |
1,965 |
2,128 |
2,598 |
|
|
Sinn Féin |
Michael Gallagher* |
10.75 |
1,462 |
1,591 |
1,754 |
1,852 |
1,874 |
|
Fianna Fáil |
Liz McCormack* |
10.29 |
1,400 |
1,555 |
1,616 |
|
|
|
Labour Party |
Brian Collins |
8.99 |
1,223 |
1,259 |
|
|
|
|
Fianna Fáil |
Dominic Moran |
8.96 |
1,219 |
|
|
|
|
| Electorate: 23,078 Valid: 13,606 (58.96%) Spoilt: 222 Quota: 2,268 Turnout: 13,828 (59.92%) |
Navan
| Navan - 7 seats |
| Party | Candidate | % 1st Pref | Count 1 | Count 2 | Count 3 | Count 4 | Count 5 | Count 6 | Count 7 | Count 8 | Count 9 | Count 10 | Count 11 | Count 12 | Count 13 | Count 14 |
|
Independent |
Francis Deane |
11.58 |
1,813 |
1,830 |
1,882 |
1,968 |
|
|
|
|
|
|
|
|
|
|
|
Sinn Féin |
Joe Reilly* |
10.30 |
1,612 |
1,654 |
1,688 |
1,710 |
1,753 |
1,849 |
1,876 |
1,925 |
2,474 |
|
|
|
|
|
|
Fine Gael |
Jim Holloway* |
8.63 |
1,351 |
1,361 |
1,393 |
1,402 |
1,428 |
1,455 |
1,488 |
1,866 |
1,920 |
1,952 |
1,954 |
2,064 |
|
|
|
Fianna Fáil |
Tommy Reilly* |
7.82 |
1,225 |
1,249 |
1,257 |
1,359 |
1,388 |
1,428 |
1,543 |
1,562 |
1,590 |
1,611 |
1,611 |
1,629 |
1,630 |
1,711 |
|
Fine Gael |
Suzanne Jamal |
7.58 |
1,187 |
1,196 |
1,278 |
1,320 |
1,352 |
1,379 |
1,421 |
1,580 |
1,623 |
1,662 |
1,664 |
1,783 |
1,846 |
2,218 |
|
Fianna Fáil |
Shane Cassells* |
6.76 |
1,059 |
1,077 |
1,094 |
1,176 |
1,219 |
1,269 |
1,416 |
1,452 |
1,492 |
1,509 |
1,511 |
1,544 |
1,547 |
1,626 |
|
Labour Party |
Jenny McHugh |
5.25 |
822 |
833 |
858 |
862 |
885 |
925 |
957 |
998 |
1,051 |
1,125 |
1,125 |
1,653 |
1,671 |
1,775 |
|
Sinn Féin |
Peadar Toibin |
5.25 |
822 |
830 |
842 |
847 |
867 |
885 |
903 |
929 |
|
|
|
|
|
|
|
Fine Gael |
John Duffy |
5.01 |
785 |
794 |
805 |
807 |
816 |
877 |
884 |
|
|
|
|
|
|
|
|
Fine Gael |
Patsy O'Neill* |
4.94 |
773 |
779 |
791 |
798 |
894 |
909 |
944 |
982 |
1,002 |
1,024 |
1,025 |
1,051 |
1,058 |
|
|
Labour Party |
Eileen Drew |
4.72 |
739 |
741 |
783 |
810 |
829 |
887 |
908 |
947 |
978 |
1,022 |
1,024 |
|
|
|
|
Fianna Fáil |
Paddy Fitzsimons |
4.71 |
738 |
743 |
750 |
785 |
804 |
838 |
980 |
1,012 |
1,041 |
1,061 |
1,062 |
1,078 |
1,079 |
1,117 |
|
Fianna Fáil |
Marguerite Fitzpatrick |
3.61 |
565 |
572 |
585 |
636 |
673 |
693 |
|
|
|
|
|
|
|
|
|
Independent |
Adrian O'Donnell |
3.27 |
512 |
520 |
527 |
532 |
|
|
|
|
|
|
|
|
|
|
|
Fianna Fáil |
Jimmy Mangan* |
3.25 |
509 |
514 |
525 |
|
|
|
|
|
|
|
|
|
|
|
|
Independent |
Stephen Ball |
3.21 |
503 |
547 |
561 |
565 |
634 |
|
|
|
|
|
|
|
|
|
|
Green Party |
Fergal O'Byrne |
2.51 |
393 |
399 |
|
|
|
|
|
|
|
|
|
|
|
|
|
Independent |
Daithi Stephens |
1.59 |
249 |
|
|
|
|
|
|
|
|
|
|
|
|
|
| Electorate: 27,418 Valid: 13,816 (50.39%) Spoilt: 310 Quota: 1,728 Turnout: 14,126 (51.52%) |
Slane
| Slane - 6 seats |
| Party | Candidate | % 1st Pref | Count 1 | Count 2 | Count 3 | Count 4 | Count 5 | Count 6 | Count 7 | Count 8 | Count 9 | Count 10 | Count 11 |
|
Labour Party |
Eoin Holmes* |
16.24 |
2,088 |
|
|
|
|
|
|
|
|
|
|
|
Fine Gael |
Sirena Campbell |
13.94 |
1,793 |
1,852 |
|
|
|
|
|
|
|
|
|
|
Independent |
Jimmy Cudden* |
8.77 |
1,128 |
1,142 |
1,143 |
1,177 |
1,253 |
1,307 |
1,397 |
1,581 |
1,719 |
1,923 |
|
|
Fianna Fáil |
Wayne Harding |
7.88 |
1,014 |
1,018 |
1,018 |
1,025 |
1,104 |
1,129 |
1,140 |
1,155 |
1,369 |
1,425 |
1,432 |
|
Independent |
Seamus O'Neill |
7.05 |
907 |
925 |
926 |
959 |
1,012 |
1,063 |
1,193 |
1,282 |
1,419 |
1,597 |
1,648 |
|
Fine Gael |
Ann Dillon-Gallagher* |
6.84 |
880 |
892 |
895 |
910 |
979 |
1,019 |
1,334 |
1,392 |
1,429 |
1,580 |
1,602 |
|
Fianna Fáil |
Sinead Moore |
6.55 |
842 |
855 |
855 |
902 |
949 |
981 |
1,032 |
|
|
|
|
|
Fianna Fáil |
Patrick Boshell* |
6.39 |
822 |
832 |
833 |
870 |
879 |
982 |
996 |
1,063 |
1,311 |
1,416 |
1,421 |
|
Sinn Féin |
Sinead Burke |
5.91 |
760 |
785 |
786 |
857 |
885 |
924 |
965 |
1,067 |
1,128 |
|
|
|
Independent |
James Carey |
5.71 |
734 |
748 |
749 |
793 |
807 |
839 |
864 |
|
|
|
|
|
Fine Gael |
Pat O'Brien |
4.77 |
614 |
639 |
643 |
664 |
693 |
749 |
|
|
|
|
|
|
Green Party |
Tom Kelly* |
3.62 |
466 |
493 |
493 |
540 |
564 |
|
|
|
|
|
|
|
Independent |
Hugh Gough |
3.25 |
418 |
425 |
425 |
456 |
|
|
|
|
|
|
|
|
Independent |
Joanne Finnegan |
3.06 |
394 |
416 |
418 |
|
|
|
|
|
|
|
|
| Electorate: 26,608 Valid: 12,860 (48.33%) Spoilt: 138 Quota: 1,838 Turnout: 12,998 (48.85%) |
Trim
| Trim - 4 seats |
| Party | Candidate | % 1st Pref | Count 1 | Count 2 | Count 3 | Count 4 | Count 5 |
|
Fine Gael |
Ray Butler |
19.73 |
1,933 |
2,013 |
|
|
|
|
Fianna Fáil |
Jimmy Fegan* |
16.51 |
1,618 |
1,656 |
1,738 |
2,472 |
|
|
Fine Gael |
Willie Carey* |
15.16 |
1,486 |
1,535 |
1,635 |
1,799 |
1,915 |
|
Fianna Fáil |
Seamus Murray* |
12.54 |
1,229 |
1,260 |
1,288 |
|
|
|
Labour Party |
Tracy McElhinney |
12.50 |
1,225 |
1,360 |
1,500 |
1,679 |
1,801 |
|
Independent |
Trevor Golden |
10.82 |
1,060 |
1,179 |
1,413 |
1,494 |
1,563 |
|
Independent |
Phil Cantwell* |
6.46 |
633 |
718 |
|
|
|
|
Sinn Féin |
Caroli Ni Loinsigh |
4.89 |
479 |
|
|
|
|
|
Independent |
Eoghan Farrell |
1.39 |
136 |
|
|
|
|
| Electorate: 20,557 Valid: 9,799 (47.67%) Spoilt: 120 Quota: 1,960 Turnout: 9,919 (48.25%) |
External links