Galway County Council election, 2009
Galway County Council election, 2009

|
|
|
|
|
|
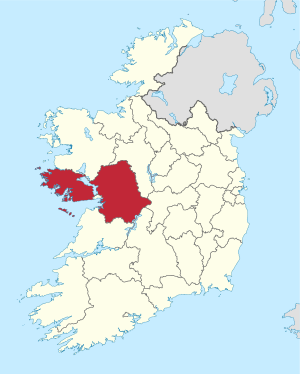
| Map showing the area of Galway County Council |
|
Council control after election
TBD
|
|
|
An election to Galway County Council took place on 5 June 2009 as part of that year's Irish local elections. 30 councillors were elected from five electoral divisions by PR-STV voting for a five-year term of office.
Results by party
Results by Electoral Area
Ballinasloe
| Ballinasloe - 5 seats |
| Party | Candidate | % 1st Pref | Count 1 | Count 2 | Count 3 | Count 4 | Count 5 |
|
Fine Gael |
Paul Connaughton, Jnr |
18.80 |
2,563 |
|
|
|
|
|
Fianna Fáil |
Tomás Mannion* |
14.78 |
2,015 |
2,074 |
2,091 |
2,159 |
2,196 |
|
Independent |
Tim Broderick |
14.52 |
1,979 |
2,013 |
2,115 |
2,262 |
2,437 |
|
Fine Gael |
Michael Mullins* |
13.93 |
1,899 |
1,978 |
2,239 |
2,904 |
|
|
Sinn Féin |
Dermot Connolly* |
12.75 |
1,738 |
1,757 |
1,850 |
2,047 |
2,160 |
|
Fianna Fáil |
James Joyce* |
10.88 |
1,483 |
1,489 |
1,699 |
1,788 |
1,847 |
|
Fine Gael |
Michael Finnerty |
8.10 |
1,104 |
1,169 |
1,308 |
|
|
|
Fine Gael |
John Goode |
5.81 |
792 |
817 |
|
|
|
|
Christian Solidarity |
Clare Flynn |
0.44 |
60 |
63 |
|
|
|
| Electorate: 22,702 Valid: 13,633 (60.05%) Spoilt: 195 Quota: 2,273 Turnout: 13,828 (60.91%) |
Connemara
| Connemara - 7 seats |
| Party | Candidate | % 1st Pref | Count 1 | Count 2 | Count 3 | Count 4 | Count 5 | Count 6 | Count 7 | Count 8 |
|
Independent |
Thomas Welby, Jnr* |
15.69 |
2,584 |
|
|
|
|
|
|
|
|
Fine Gael |
Seán Kyne* |
11.70 |
1,927 |
2,061 |
|
|
|
|
|
|
|
Fine Gael |
Eileen Mannion-Mullen |
9.12 |
1,501 |
1,565 |
1,588 |
1,749 |
1,771 |
1,843 |
2,263 |
|
|
Fianna Fáil |
Seán O Tuairisg* |
8.91 |
1,467 |
1,491 |
1,571 |
1,581 |
1,884 |
1,982 |
2,115 |
|
|
Republican Sinn Féin |
Tomas O Curraoin |
8.42 |
1,387 |
1,416 |
1,501 |
1,522 |
1,576 |
1,754 |
1,976 |
2,050 |
|
Fianna Fáil |
Josie Conneely* |
7.22 |
1,189 |
1,217 |
1,247 |
1,373 |
1,435 |
1,488 |
1,506 |
1,513 |
|
Fine Gael |
Seosamh O Laoi |
7.16 |
1,178 |
1,189 |
1,212 |
1,220 |
1,297 |
1,390 |
|
|
|
Independent |
Seosamh O Cuaig* |
6.92 |
1,140 |
1,160 |
1,195 |
1,221 |
1,320 |
1,702 |
1,974 |
2,067 |
|
Fianna Fáil |
Seamus Walsh* |
6.58 |
1,083 |
1,194 |
1,381 |
1,410 |
1,554 |
1,617 |
1,717 |
1,738 |
|
Sinn Féin |
Trevor O Clochartaigh |
5.42 |
893 |
906 |
915 |
1,193 |
1,267 |
|
|
|
|
Fianna Fáil |
Connie Ní Fhatharta* |
4.90 |
806 |
817 |
896 |
906 |
|
|
|
|
|
Sinn Féin |
Kenneth Coyne |
4.29 |
706 |
748 |
764 |
|
|
|
|
|
|
Fianna Fáil |
Louise O'Connor |
3.22 |
530 |
556 |
|
|
|
|
|
|
|
Independent |
Chris Walsh |
0.44 |
73 |
85 |
|
|
|
|
|
|
| Electorate: 30,414 Valid: 16,464 (54.13%) Spoilt: 296 Quota: 2,059 Turnout: 16,760 (55.11%) |
Loughrea
| Loughrea - 7 seats |
| Party | Candidate | % 1st Pref | Count 1 | Count 2 | Count 3 | Count 4 | Count 5 | Count 6 | Count 7 | Count 8 |
|
Independent |
Michael (Stroke) Fahy* |
12.28 |
2,247 |
2,262 |
2,287 |
|
|
|
|
|
|
Independent |
Pat Hynes* |
10.86 |
1,987 |
2,004 |
2,051 |
2,091 |
2,237 |
2,425 |
|
|
|
Fine Gael |
Jimmy McClearn |
10.25 |
1,875 |
1,880 |
1,899 |
1,909 |
1,938 |
1,985 |
1,991 |
2,144 |
|
Fine Gael |
Bridie Willers* |
9.79 |
1,791 |
1,826 |
1,930 |
2,063 |
2,104 |
2,250 |
2,272 |
2,354 |
|
Fine Gael |
Peter Feeney* |
9.75 |
1,784 |
1,856 |
1,900 |
1,940 |
1,967 |
2,159 |
2,170 |
2,218 |
|
Fine Gael |
Michael 'Mogie' Maher* |
8.94 |
1,635 |
1,655 |
1,697 |
1,712 |
1,795 |
1,909 |
1,924 |
2,039 |
|
Fianna Fáil |
Gerry Finnerty |
8.09 |
1,480 |
1,483 |
1,488 |
1,598 |
1,780 |
1,824 |
1,829 |
2,399 |
|
Independent |
Willie Burke* |
6.92 |
1,265 |
1,276 |
1,304 |
1,335 |
1,368 |
1,455 |
1,507 |
1,630 |
|
Fianna Fáil |
Michael Regan* |
6.10 |
1,116 |
1,123 |
1,133 |
1,137 |
1,328 |
1,388 |
1,392 |
|
|
Fianna Fáil |
Gabriel Burke |
4.44 |
813 |
821 |
828 |
830 |
|
|
|
|
|
Independent |
Lorraine Higgins |
4.42 |
809 |
890 |
987 |
1,143 |
1,187 |
|
|
|
|
Independent |
Adrian Feeney |
2.97 |
543 |
587 |
649 |
|
|
|
|
|
|
Labour Party |
P.J. McDonnell |
2.61 |
477 |
584 |
|
|
|
|
|
|
|
Green Party |
Patrick Creed |
2.09 |
382 |
|
|
|
|
|
|
|
|
Independent |
Enda Glynn |
0.48 |
88 |
|
|
|
|
|
|
|
| Electorate: 30,971 Valid: 18,292 (59.06%) Spoilt: 216 Quota: 2,287 Turnout: 18,508 (59.76%) |
Oranmore
| Oranmore- 4 seats |
| Party | Candidate | % 1st Pref | Count 1 | Count 2 | Count 3 | Count 4 | Count 5 | Count 6 | Count 7 | Count 8 | Count 9 |
|
Independent |
Jim Cuddy* |
17.45 |
1,614 |
1,654 |
1,751 |
1,859 |
|
|
|
|
|
|
Fine Gael |
Jarlath McDonagh* |
14.43 |
1,335 |
1,341 |
1,543 |
1,575 |
1,757 |
1,950 |
|
|
|
|
Fianna Fáil |
Malachy Noone |
12.92 |
1,195 |
1,203 |
1,273 |
1,625 |
1,839 |
1,919 |
|
|
|
|
Fine Gael |
Liam Carroll |
9.56 |
884 |
897 |
988 |
1,062 |
1,134 |
1,524 |
1,589 |
1,608 |
1,612 |
|
Labour Party |
Enda O'Rourke |
9.27 |
858 |
901 |
944 |
1,029 |
1,321 |
1,549 |
1,583 |
1,605 |
1,609 |
|
Labour Party |
Josette Farrell |
9.06 |
838 |
869 |
935 |
972 |
|
|
|
|
|
|
Fine Gael |
Michael Eames |
9.00 |
833 |
848 |
934 |
993 |
1,058 |
|
|
|
|
|
Fianna Fáil |
Dolores Kilroe |
8.43 |
780 |
786 |
802 |
|
|
|
|
|
|
|
Fine Gael |
Eamon Fox |
7.47 |
691 |
697 |
|
|
|
|
|
|
|
|
Sinn Féin |
Anna Marley |
1.93 |
179 |
|
|
|
|
|
|
|
|
|
Independent |
Eamon Coyle |
0.48 |
44 |
|
|
|
|
|
|
|
|
| Electorate: 17,575 Valid: 9,251 (52.64%) Spoilt: 97 Quota: 1,851 Turnout: 9,348 (53.19%) |
Tuam
| Tuam - 7 seats |
| Party | Candidate | % 1st Pref | Count 1 | Count 2 | Count 3 | Count 4 | Count 5 | Count 6 | Count 7 | Count 8 | Count 9 |
|
Independent |
Seán Canney* |
17.43 |
3,273 |
|
|
|
|
|
|
|
|
|
Fine Gael |
Tom McHugh* |
15.15 |
2,845 |
|
|
|
|
|
|
|
|
|
Labour Party |
Colm Keaveney* |
13.42 |
2,519 |
|
|
|
|
|
|
|
|
|
Fine Gael |
Tiernan Walsh* |
10.55 |
1,980 |
2,023 |
2,153 |
2,166 |
2,203 |
2,343 |
2,594 |
|
|
|
Fianna Fáil |
Mary Hoade* |
9.93 |
1,864 |
2,033 |
2,053 |
2,064 |
2,097 |
2,605 |
|
|
|
|
Fine Gael |
Pete Roche |
9.17 |
1,722 |
1,921 |
2,057 |
2,092 |
2,212 |
2,606 |
|
|
|
|
Fianna Fáil |
Michael Connolly* |
8.89 |
1,668 |
1,777 |
1,824 |
1,836 |
1,889 |
1,917 |
1,919 |
1,985 |
2,013 |
|
Fianna Fáil |
Tom Reilly* |
6.98 |
1,311 |
1,511 |
1,601 |
1,652 |
1,702 |
1,727 |
1,733 |
1,812 |
1,836 |
|
Fine Gael |
Michael Carey* |
5.93 |
1,113 |
1,223 |
1,275 |
1,290 |
1,334 |
|
|
|
|
|
Sinn Féin |
Grainne Morahan |
1.51 |
283 |
321 |
335 |
356 |
|
|
|
|
|
|
Independent |
Seán Hehir |
1.04 |
195 |
253 |
262 |
276 |
|
|
|
|
|
| Electorate: 31,011 Valid: 18,773 (60.54%) Spoilt: 209 Quota: 2,347 Turnout: 18,982 (61.21%) |
External links