Dublin City Council election, 2009
Dublin City Council election, 2009

|
|
|
|
|
|
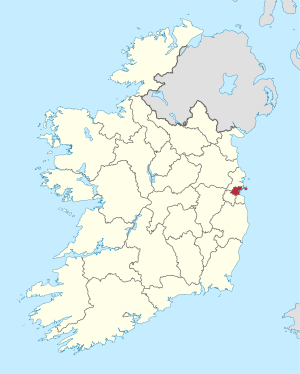
| Map showing the area of Dublin City Council |
|
|
An election to Dublin City Council took place on 5 June 2009 as part of that year's Irish local elections. 52 councillors were elected from thirteen electoral divisions by PR-STV voting for a five-year term of office.
Results by party
Results by Electoral Area
Artane-Whitehall
| Artane-Whitehall - 5 seats |
| Party | Candidate | % 1st Pref | Count 1 | Count 2 | Count 3 | Count 4 | Count 5 | Count 6 | Count 7 | Count 8 |
|
Sinn Féin |
Larry O'Toole* |
16.62 |
2,702 |
2,819 |
|
|
|
|
|
|
|
Labour Party |
Andrew Montague* |
15.60 |
2,535 |
2,640 |
2,647 |
2,776 |
|
|
|
|
|
Fine Gael |
Declan Flanagan* |
14.58 |
2,370 |
2,426 |
2,427 |
2,506 |
2,669 |
2,678 |
2,679 |
2,905 |
|
Labour Party |
Paddy Bourke* |
11.24 |
1,827 |
1,913 |
1,921 |
2,036 |
2,676 |
2,713 |
|
|
|
Fianna Fáil |
Seán Paul Mahon* |
8.90 |
1,447 |
1,462 |
1,466 |
1,507 |
1,542 |
1,543 |
1,543 |
|
|
Fianna Fáil |
Julia Carmichael* |
8.86 |
1,440 |
1,460 |
1,462 |
1,503 |
1,540 |
1,544 |
1,545 |
2,515 |
|
Fine Gael |
Noel Rock |
7.90 |
1,284 |
1,337 |
1,341 |
1,408 |
1,542 |
1,558 |
1,560 |
1,659 |
|
Labour Party |
Sinead Seery |
5.96 |
968 |
1,058 |
1,074 |
1,222 |
|
|
|
|
|
Sinn Féin |
Denise Mitchell |
5.73 |
931 |
1,002 |
1,043 |
|
|
|
|
|
|
People Before Profit |
Martin O'Sullivan |
2.41 |
391 |
|
|
|
|
|
|
|
|
Independent |
Anna Harvey |
2.20 |
358 |
|
|
|
|
|
|
|
| Electorate: 32,989 Valid: 16,253 (49.27%) Spoilt: 309 Quota: 2,709 Turnout: 16,562 (50.20%) |
Ballyfermot-Drimnagh
| Ballyfermot-Drimnagh - 4 seats |
| Party | Candidate | % 1st Pref | Count 1 | Count 2 | Count 3 | Count 4 | Count 5 | Count 6 | Count 7 | Count 8 |
|
Labour Party |
Michael Conaghan* |
19.41 |
2,341 |
2,377 |
2,430 |
|
|
|
|
|
|
People Before Profit |
Bríd Smith |
18.80 |
2,269 |
2,307 |
2,375 |
2,392 |
2,500 |
|
|
|
|
Independent |
Vincent Jackson* |
15.92 |
1,922 |
1,949 |
1,982 |
2,040 |
2,197 |
2,225 |
2,301 |
2,556 |
|
Sinn Féin |
Louise Minihan* |
13.67 |
1,650 |
1,661 |
1,712 |
1,727 |
1,820 |
1,828 |
1,892 |
2,021 |
|
Fine Gael |
Philip Nolan |
6.49 |
783 |
797 |
806 |
822 |
923 |
930 |
1,496 |
1,692 |
|
Fine Gael |
Peter O'Neill |
6.32 |
763 |
797 |
808 |
816 |
878 |
886 |
|
|
|
Fianna Fáil |
David Gaynor |
5.72 |
691 |
701 |
712 |
1,067 |
1,108 |
1,112 |
1,149 |
|
|
Labour Party |
Paul Comiskey-O'Keeffe |
5.13 |
619 |
645 |
669 |
686 |
|
|
|
|
|
Fianna Fáil |
Ben Doyle |
4.12 |
497 |
507 |
516 |
|
|
|
|
|
|
Workers' Party |
Andrew McGuinness |
2.46 |
297 |
304 |
|
|
|
|
|
|
|
Green Party |
Stephen Wall |
1.97 |
238 |
|
|
|
|
|
|
|
| Electorate: 27,942 Valid: 12,070 (43.20%) Spoilt: 230 Quota: 2,415 Turnout: 12,300 (44.02%) |
Ballymun-Finglas
| Ballymun-Finglas - 5 seats |
| Party | Candidate | % 1st Pref | Count 1 | Count 2 | Count 3 | Count 4 | Count 5 | Count 6 | Count 7 | Count 8 | Count 9 |
|
Labour Party |
John Lyons* |
22.22 |
3,721 |
|
|
|
|
|
|
|
|
|
Sinn Féin |
Dessie Ellis* |
19.49 |
3,263 |
|
|
|
|
|
|
|
|
|
Fine Gael |
Dr. Bill Tormey* |
12.77 |
2,139 |
2,267 |
2,312 |
2,343 |
2,374 |
2,414 |
2,471 |
2,615 |
2,918 |
|
Labour Party |
John Redmond |
9.34 |
1,564 |
1,989 |
2,040 |
2,058 |
2,107 |
2,205 |
2,348 |
2,440 |
2,808 |
|
Sinn Féin |
Ray Corcoran* |
7.11 |
1,190 |
1,278 |
1,526 |
1,538 |
1,557 |
1,661 |
1,740 |
1,782 |
1,943 |
|
Fianna Fáil |
Paul McAuliffe |
6.83 |
1,144 |
1,187 |
1,203 |
1,348 |
1,366 |
1,376 |
1,390 |
2,103 |
2,349 |
|
Fianna Fáil |
Liam Kelly* |
6.66 |
1,116 |
1,144 |
1,162 |
1,254 |
1,258 |
1,272 |
1,282 |
|
|
|
Independent |
Conor Sludds |
6.63 |
1,110 |
1,188 |
1,210 |
1,223 |
1,253 |
1,306 |
1,543 |
1,624 |
|
|
Independent |
John O'Neill |
2.76 |
462 |
498 |
522 |
527 |
597 |
705 |
|
|
|
|
Workers' Party |
Owen Martin |
2.09 |
350 |
381 |
409 |
416 |
|
|
|
|
|
|
Workers' Party |
John Dunne |
2.05 |
343 |
398 |
413 |
418 |
567 |
|
|
|
|
|
Fianna Fáil |
Niall McCullagh |
2.05 |
344 |
361 |
365 |
|
|
|
|
|
|
| Electorate: 36,984 Valid: 16,746 (45.28%) Spoilt: 302 Quota: 2,792 Turnout: 17,048 (46.10%) |
Cabra-Glasnevin
| Cabra-Glasnevin - 5 seats |
| Party | Candidate | % 1st Pref | Count 1 | Count 2 | Count 3 | Count 4 | Count 5 | Count 6 | Count 7 | Count 8 | Count 9 |
|
Fianna Fáil |
Mary Fitzpatrick* |
18.14 |
3,088 |
|
|
|
|
|
|
|
|
|
Labour Party |
Aine Clancy* |
15.40 |
2,621 |
2,648 |
2,690 |
3,126 |
|
|
|
|
|
|
Independent |
Ciaran Perry |
14.75 |
2,510 |
2,535 |
2,577 |
2,703 |
2,728 |
3,067 |
|
|
|
|
Fine Gael |
Mary O'Shea* |
9.74 |
1,657 |
1,683 |
2,185 |
2,323 |
2,374 |
2,766 |
2,846 |
|
|
|
Sinn Féin |
Seamus McGrattan* |
9.59 |
1,633 |
1,644 |
1,656 |
1,691 |
1,699 |
1,883 |
1,939 |
1,944 |
2,243 |
|
Fianna Fáil |
Maurice Ahern* |
8.35 |
1,422 |
1,474 |
1,481 |
1,534 |
1,554 |
1,605 |
1,620 |
1,621 |
2,230 |
|
Fianna Fáil |
Seaghan Kearney |
7.71 |
1,313 |
1,380 |
1,389 |
1,454 |
1,476 |
1,589 |
1,611 |
1,614 |
|
|
Labour Party |
Mick Deegan |
6.13 |
1,044 |
1,059 |
1,106 |
1,209 |
1,372 |
|
|
|
|
|
Green Party |
Gary Fitzgerald |
6.08 |
1,035 |
1,054 |
1,065 |
|
|
|
|
|
|
|
Fine Gael |
Harry McNab |
4.10 |
697 |
706 |
|
|
|
|
|
|
|
| Electorate: 31,882 Valid: 17,020 (53.38%) Spoilt: 239 Quota: 2,837 Turnout: 17,259 (54.13%) |
Clontarf
| Clontarf - 5 seats |
| Party | Candidate | % 1st Pref | Count 1 | Count 2 | Count 3 | Count 4 | Count 5 | Count 6 |
|
Independent |
Damian O'Farrell |
20.38 |
4,194 |
|
|
|
|
|
|
Fine Gael |
Gerry Breen* |
16.74 |
3,445 |
|
|
|
|
|
|
Labour Party |
Aodhán Ó Ríordáin* |
16.45 |
3,387 |
3,607 |
|
|
|
|
|
Fianna Fáil |
Deirdre Heney* |
13.25 |
2,728 |
2,812 |
2,826 |
2,915 |
2,980 |
3,995 |
|
Fine Gael |
Naoise O Muiri* |
13.01 |
2,677 |
2,832 |
2,903 |
3,058 |
3,183 |
3,363 |
|
Fianna Fáil |
Ronan Callely |
7.05 |
1,451 |
1,486 |
1,500 |
1,547 |
1,600 |
|
|
Independent |
Bronwen Maher* |
6.23 |
1,283 |
1,467 |
1,512 |
1,739 |
2,091 |
2,227 |
|
Sinn Féin |
Helen McCormack |
3.90 |
803 |
846 |
862 |
899 |
|
|
|
Green Party |
Donna Cooney |
2.99 |
616 |
658 |
674 |
|
|
|
| Electorate: 37,082 Valid: 20,584 (55.51%) Spoilt: 212 Quota: 3,431 Turnout: 20,796 (56.08%) |
Crumlin-Kimmage
| Crumlin-Kimmage - 4 seats |
| Party | Candidate | % 1st Pref | Count 1 | Count 2 | Count 3 | Count 4 | Count 5 | Count 6 |
|
Labour Party |
Eric Byrne* |
25.34 |
3,652 |
|
|
|
|
|
|
People Before Profit |
Joan Collins* |
17.43 |
2,512 |
2,647 |
2,827 |
3,356 |
|
|
|
Labour Party |
Henry Upton |
14.35 |
2,068 |
2,449 |
2,854 |
3,166 |
|
|
|
Fianna Fáil |
Charlie Ardagh* |
13.18 |
1,899 |
1,940 |
2,111 |
2,211 |
2,265 |
2,294 |
|
Fine Gael |
Ruairi McGinley* |
13.14 |
1,894 |
2,005 |
2,240 |
2,338 |
2,473 |
2,603 |
|
Sinn Féin |
Ray McHugh* |
8.69 |
1,253 |
1,296 |
1,355 |
|
|
|
|
Green Party |
Tony McDermott |
6.87 |
990 |
1,045 |
|
|
|
|
|
Christian Solidarity |
Colm Callanan |
0.99 |
143 |
146 |
|
|
|
|
| Electorate: 30,163 Valid: 14,411 (47.78%) Spoilt: 175 Quota: 2,883 Turnout: 14,586 (48.36%) |
Donaghmede
| Donaghmede - 4 seats |
| Party | Candidate | % 1st Pref | Count 1 | Count 2 | Count 3 | Count 4 | Count 5 | Count 6 | Count 7 |
|
Labour Party |
Seán Kenny* |
24.78 |
4,119 |
|
|
|
|
|
|
|
Sinn Féin |
Killian Forde* |
16.07 |
2,671 |
2,734 |
2,778 |
2,832 |
2,914 |
3,283 |
3,312 |
|
Fianna Fáil |
Tom Brabazon* |
14.82 |
2,464 |
2,516 |
2,558 |
2,580 |
3,273 |
3,465 |
|
|
Fine Gael |
Patrick Crimmins* |
12.85 |
2,137 |
2,224 |
2,254 |
2,655 |
2,831 |
3,024 |
3,072 |
|
Labour Party |
Brian McDowell |
10.49 |
1,744 |
2,207 |
2,264 |
2,393 |
2,464 |
2,900 |
2,937 |
|
Independent |
Brian Byrne |
7.23 |
1,202 |
1,238 |
1,509 |
1,555 |
1,602 |
|
|
|
Fianna Fáil |
Martin McGettigan |
6.69 |
1,112 |
1,139 |
1,159 |
1,181 |
|
|
|
|
Fine Gael |
Dave O'Connor |
4.11 |
684 |
719 |
729 |
|
|
|
|
|
Independent |
John Clare |
2.96 |
492 |
522 |
|
|
|
|
|
| Electorate: 33,098 Valid: 16,625 (50.23%) Spoilt: 259 Quota: 3,326 Turnout: 16,884 (51.01%) |
North Inner City
| North Inner City - 6 seats |
| Party | Candidate | % 1st Pref | Count 1 | Count 2 | Count 3 | Count 4 | Count 5 | Count 6 | Count 7 | Count 8 | Count 9 | Count 10 | Count 11 |
|
Independent |
Maureen O'Sullivan* |
24.03 |
2,859 |
|
|
|
|
|
|
|
|
|
|
|
Labour Party |
Emer Costello* |
17.52 |
2,084 |
|
|
|
|
|
|
|
|
|
|
|
Sinn Féin |
Christy Burke* |
12.92 |
1,537 |
1,832 |
|
|
|
|
|
|
|
|
|
|
Independent |
Nial Ring |
8.41 |
1,000 |
1,188 |
1,209 |
1,232 |
1,244 |
1,263 |
1,291 |
1,326 |
1,420 |
1,453 |
1,509 |
|
Fine Gael |
Ray McAdam |
7.82 |
930 |
1,024 |
1,070 |
1,078 |
1,089 |
1,106 |
1,119 |
1,137 |
1,176 |
1,225 |
1,363 |
|
Labour Party |
Claire O'Regan |
7.50 |
892 |
1,106 |
1,304 |
1,318 |
1,319 |
1,369 |
1,442 |
1,507 |
1,620 |
1,662 |
2,024 |
|
Fianna Fáil |
Tom Stafford* |
4.46 |
530 |
603 |
619 |
627 |
642 |
645 |
652 |
664 |
680 |
950 |
1,016 |
|
Green Party |
David Geary |
4.36 |
519 |
589 |
627 |
636 |
639 |
660 |
693 |
736 |
773 |
826 |
|
|
Fianna Fáil |
Ray McAdam |
4.06 |
483 |
514 |
525 |
529 |
534 |
535 |
537 |
546 |
563 |
|
|
|
Sinn Féin |
Ruadhan MacAodhain |
2.68 |
319 |
340 |
362 |
398 |
404 |
411 |
445 |
|
|
|
|
|
Workers' Party |
Malachy Steenson |
2.36 |
281 |
344 |
353 |
370 |
379 |
391 |
460 |
507 |
|
|
|
|
People Before Profit |
Colm Stephens |
1.77 |
210 |
276 |
285 |
292 |
303 |
335 |
|
|
|
|
|
|
Independent |
Patrick Tatlhego Maphoso |
1.29 |
154 |
188 |
199 |
203 |
206 |
|
|
|
|
|
|
|
Christian Solidarity |
Paul O'Loughlin |
0.82 |
98 |
108 |
111 |
113 |
|
|
|
|
|
|
|
| Electorate: 32,072 Valid: 11,896 (37.09%) Spoilt: 178 Quota: 1,700 Turnout: 12,074 (37.65%) |
Pembroke-Rathmines
| Pembroke-Rathmines - 6 seats |
| Party | Candidate | % 1st Pref | Count 1 | Count 2 | Count 3 | Count 4 | Count 5 | Count 6 | Count 7 | Count 8 | Count 9 | Count 10 |
|
Fine Gael |
Eoghan Murphy |
15.00 |
2,637 |
|
|
|
|
|
|
|
|
|
|
Labour Party |
Oisin Quinn* |
11.30 |
1,986 |
1,993 |
2,008 |
2,033 |
2,057 |
2,116 |
2,239 |
2,530 |
|
|
|
Labour Party |
Dermot Lacey* |
10.48 |
1,843 |
1,850 |
1,858 |
1,878 |
1,898 |
1,930 |
2,033 |
2,173 |
2,282 |
2,379 |
|
Labour Party |
Mary Freehill* |
10.17 |
1,788 |
1,795 |
1,800 |
1,820 |
1,856 |
1,877 |
2,069 |
2,376 |
2,565 |
|
|
Fine Gael |
Edie Wynne* |
9.69 |
1,704 |
1,712 |
1,745 |
1,759 |
1,783 |
1,827 |
1,867 |
2,032 |
2,149 |
2,240 |
|
Fine Gael |
Paddy McCartan* |
9.49 |
1,668 |
1,675 |
1,719 |
1,727 |
1,743 |
1,785 |
1,828 |
1,900 |
2,004 |
2,061 |
|
Fianna Fáil |
Michael Donnelly* |
7.87 |
1,384 |
1,389 |
1,391 |
1,395 |
1,403 |
1,561 |
1,579 |
1,646 |
|
|
|
Fianna Fáil |
Jim O'Callaghan |
7.71 |
1,356 |
1,359 |
1,364 |
1,374 |
1,386 |
1,720 |
1,736 |
1,830 |
2,757 |
|
|
Green Party |
Dave Robbins |
6.13 |
1,077 |
1,088 |
1,093 |
1,131 |
1,162 |
1,200 |
1,375 |
|
|
|
|
Fianna Fáil |
Garrett Tubridy |
4.45 |
782 |
784 |
789 |
798 |
810 |
|
|
|
|
|
|
People Before Profit |
Bryce Evans |
3.64 |
639 |
654 |
655 |
735 |
859 |
875 |
|
|
|
|
|
Sinn Féin |
Oisin O'Dubhlain |
1.73 |
304 |
308 |
308 |
|
|
|
|
|
|
|
|
Independent |
Erik Eblana |
1.62 |
285 |
320 |
322 |
361 |
|
|
|
|
|
|
|
Independent |
Emmanuel Sweeney |
0.71 |
125 |
|
|
|
|
|
|
|
|
|
| Electorate: 39,363 Valid: 17,578 (44.66%) Spoilt: 143 Quota: 2,512 Turnout: 17,721 (45.02%) |
South-East Inner City
| South-East Inner City - 4 seats |
| Party | Candidate | % 1st Pref | Count 1 | Count 2 | Count 3 | Count 4 | Count 5 | Count 6 |
|
Labour Party |
Kevin Humphreys* |
27.46 |
2,598 |
|
|
|
|
|
|
Independent |
Mannix Flynn |
14.60 |
1,381 |
1,460 |
1,509 |
1,527 |
1,791 |
2,003 |
|
Fine Gael |
Catherine Noone |
13.04 |
1,234 |
1,310 |
1,317 |
1,337 |
1,476 |
1,655 |
|
Sinn Féin |
Daithí Doolan* |
11.87 |
1,123 |
1,202 |
1,223 |
1,251 |
1,299 |
1,411 |
|
Labour Party |
Maria Parodi |
10.64 |
1,007 |
1,348 |
1,362 |
1,379 |
1,642 |
1,822 |
|
Fianna Fáil |
Sarah Ryan* |
8.34 |
789 |
822 |
830 |
1,027 |
1,148 |
|
|
Green Party |
Claire Wheeler |
5.75 |
544 |
580 |
591 |
610 |
|
|
|
Fianna Fáil |
Vicky Crosby |
3.38 |
320 |
334 |
341 |
|
|
|
|
Independent |
Esther Uzell |
3.32 |
314 |
347 |
377 |
381 |
|
|
|
Independent |
Damien Cassidy |
0.84 |
79 |
88 |
|
|
|
|
|
Independent |
Noel Ivory |
0.75 |
71 |
76 |
|
|
|
|
| Electorate: 23,803 Valid: 9,460 (39.74%) Spoilt: 169 Quota: 1,893 Turnout: 9,629 (40.45%) |
South-West Inner City
| South-West Inner City - 4 seats |
| Party | Candidate | % 1st Pref | Count 1 | Count 2 | Count 3 | Count 4 | Count 5 | Count 6 | Count 7 |
|
Labour Party |
John Gallagher* |
19.04 |
1,574 |
1,618 |
1,748 |
|
|
|
|
|
Fine Gael |
Clare Byrne* |
16.93 |
1,400 |
1,418 |
1,454 |
1,472 |
1,608 |
1,632 |
1,869 |
|
Labour Party |
Rebecca Moynihan |
15.90 |
1,315 |
1,363 |
1,405 |
1,415 |
1,709 |
|
|
|
Sinn Féin |
Críona Ní Dhálaigh* |
12.17 |
1,006 |
1,022 |
1,072 |
1,088 |
1,110 |
1,114 |
1,400 |
|
Fianna Fáil |
Catherine Ardagh |
8.70 |
719 |
731 |
995 |
1,024 |
1,097 |
1,104 |
1,158 |
|
People Before Profit |
Tina McVeigh |
8.25 |
682 |
759 |
789 |
800 |
927 |
947 |
|
|
Green Party |
Martin Hogan |
8.18 |
676 |
709 |
732 |
742 |
|
|
|
|
Fianna Fáil |
Anita Reilly |
7.40 |
612 |
615 |
|
|
|
|
|
|
Independent |
Lisa Connell |
2.27 |
229 |
|
|
|
|
|
|
|
Independent |
Lech Szczecinski |
0.67 |
55 |
|
|
|
|
|
|
| Electorate: 21,934 Valid: 8,268 (37.69%) Spoilt: 188 Quota: 1,654 Turnout: 8,456 (38.55%) |
External links