Catalan parliamentary election, 2010

|
|
|
|
All 135 seats in the Parliament of Catalonia
68 seats needed for a majority |
| Opinion polls |
| Registered |
5,363,688  0.8% 0.8% |
| Turnout |
3,152,630 (58.8%)
2.8 pp |
| |
First party |
Second party |
Third party |
| |
.jpg) |
.jpg) |
.jpg) |
| Leader |
Artur Mas |
José Montilla |
Alicia Sánchez-Camacho |
| Party |
CiU |
PSC |
PPC |
| Leader since |
7 January 2002 |
15 July 2006 |
6 July 2008 |
| Last election |
48 seats, 31.5% |
37 seats, 26.8% |
14 seats, 10.7% |
| Seats won |
62 |
28 |
18 |
| Seat change |
14 |
 9 9 |
4 |
| Popular vote |
1,202,830 |
575,233 |
387,066 |
| Percentage |
38.4% |
18.4% |
12.4% |
| Swing |
6.9 pp |
8.4 pp |
1.7 pp |
|
| |
Fourth party |
Fifth party |
Sixth party |
| |
.jpg) |
.jpg) |
.jpg) |
| Leader |
Joan Herrera |
Joan Puigcercós |
Joan Laporta |
| Party |
ICV–EUiA |
ERC |
SI |
| Leader since |
23 November 2008 |
7 June 2008 |
4 September 2010 |
| Last election |
12 seats, 9.5% |
21 seats, 14.0% |
Did not contest |
| Seats won |
10 |
10 |
4 |
| Seat change |
2 |
11 |
4 |
| Popular vote |
230,824 |
219,173 |
102,921 |
| Percentage |
7.4% |
7.0% |
3.3% |
| Swing |
2.1 pp |
7.0 pp |
New party |
|

|
On the left: Winning party map for each municipality.
On the right: Map showing the winning party in each comarque and the distribution of seats in every election boundary.
|
|
|
The 2010 Catalan parliamentary election was held on Sunday, 28 November 2010, to elect the 9th Parliament of Catalonia, the regional legislature of the Spanish autonomous community of Catalonia. At stake were all 135 seats in the Parliament, determining the President of Catalonia.
The election resulted in the ousting of the Catalan tripartite coalition, composed of the Socialists' Party of Catalonia (PSC), Republican Left of Catalonia (ERC) and Initiative for Catalonia Greens (ICV) from the Catalan government and the return to power of Convergence and Union (CiU) after 7 years in opposition.
Artur Mas was sworn in as President of the Generalitat of Catalonia and was able to govern with confidence and supply support from the People's Party of Catalonia (PPC) until Mas' independentist drift in late-2012.
Electoral system
The 135 members of the Parliament of Catalonia were elected in 4 multi-member districts, corresponding to Catalonia's four provinces, using the D'Hondt method and a closed-list proportional representation. As the community did not have an electoral law of its own passed into law at the time of the 2010 election, the electoral system came regulated under the community's Statute of Autonomy rules, and subsidiarily, under the Spanish general electoral law (Organic Law 5/1985, of the General Electoral Regime). As a result of the lack of an autonomous electoral law, seats were allocated to districts through specific Laws or Decrees for each election. For the 2010 election, seats were distributed as follows: Barcelona (85), Girona (17), Lleida (15) and Tarragona (18).
Voting was on the basis of universal suffrage in a secret ballot. Only lists polling above 3% of valid votes in each district (which includes blank ballots—for none of the above) were entitled to enter the seat distribution.[1][2]
Opinion polls
Vote
Poll results are listed in the table below in reverse chronological order, showing the most recent first, and using the date the survey's fieldwork was done, as opposed to the date of publication. If such date is unknown, the date of publication is given instead. The highest percentage figure in each polling survey is displayed in bold, and the background shaded in the leading party's colour. In the instance that there is a tie, then no figure is shaded. The lead column on the right shows the percentage-point difference between the two parties with the highest figures. When a specific poll does not show a data figure for a party, the party's cell corresponding to that poll is shown empty.
| Date |
Polling Firm/Source |
CiU |
PSC |
ERC |
PPC |
ICV |
C's |
SI |
Oth. |
Lead |
|
|
|
|
|
|
|
| 28 Nov 2010 |
Regional Election |
38.4 |
18.4 |
7.0 |
12.4 |
7.4 |
3.4 |
3.3 |
9.7 |
20.0 |
| 28 Nov |
Ipsos-Eco |
40.2 |
17.3 |
8.1 |
11.1 |
7.3 |
3.2 |
3.7 |
9.1 |
22.9 |
| 28 Nov |
GAD |
39.4 |
20.5 |
7.7 |
11.6 |
9.4 |
4.0 |
2.9 |
4.5 |
18.9 |
| Exit polls |
| 27 Nov |
GESOP |
40.0 |
18.5 |
7.4 |
10.5 |
10.2 |
4.0 |
2.8 |
6.6 |
21.5 |
| 27 Nov |
GESOP |
39.2 |
19.3 |
7.2 |
10.4 |
9.9 |
3.7 |
2.6 |
7.7 |
19.9 |
| 26 Nov |
GESOP |
39.9 |
19.5 |
7.0 |
9.9 |
9.5 |
3.7 |
2.6 |
7.9 |
20.4 |
| 25 Nov |
GESOP |
39.5 |
20.1 |
7.3 |
9.8 |
9.0 |
4.3 |
2.5 |
7.5 |
19.4 |
| 24 Nov |
GESOP |
39.5 |
20.1 |
7.3 |
10.1 |
8.4 |
4.4 |
2.9 |
7.3 |
19.4 |
| 23 Nov |
GESOP |
39.2 |
19.9 |
7.5 |
10.1 |
8.2 |
4.7 |
3.2 |
7.2 |
19.3 |
| 22 Nov |
GESOP |
39.1 |
20.0 |
7.5 |
10.3 |
8.0 |
4.3 |
3.2 |
7.6 |
19.1 |
| 15–20 Nov |
Obradoiro |
39.3 |
22.2 |
9.1 |
8.5 |
8.0 |
4.1 |
2.9 |
5.9 |
17.1 |
| 15–18 Nov |
NC-Report[lower-alpha 1] |
38.6 |
21.4 |
9.1 |
11.2 |
8.3 |
3.1 |
1.8 |
6.5 |
17.2 |
| 15–18 Nov |
Sigma-2 |
40.4 |
21.8 |
8.1 |
12.7 |
8.1 |
3.0 |
|
5.9 |
18.6 |
| 15–18 Nov |
Noxa |
39.3 |
20.1 |
7.9 |
10.1 |
7.5 |
4.0 |
2.4 |
8.7 |
19.2 |
| 16–17 Nov |
Metroscopia |
39.5 |
20.4 |
7.0 |
9.5 |
6.9 |
5.0 |
2.6 |
9.1 |
19.1 |
| 8–12 Nov |
Feedback |
39.3 |
20.1 |
5.6 |
10.5 |
6.7 |
3.2 |
2.8 |
11.8 |
19.2 |
| 7–10 Nov |
GESOP |
39.0 |
21.3 |
7.7 |
10.8 |
9.0 |
3.2 |
2.7 |
6.3 |
17.7 |
| 8–9 Nov |
Opina |
42.4 |
18.4 |
7.3 |
11.6 |
7.5 |
4.1 |
3.5 |
5.2 |
24.0 |
| 15 Oct–4 Nov |
CIS |
38.0 |
22.7 |
10.2 |
9.7 |
8.2 |
3.5 |
1.0 |
6.7 |
15.3 |
| 26–28 Oct |
NC-Report[lower-alpha 1] |
40.2 |
21.2 |
8.6 |
11.7 |
9.9 |
2.8 |
|
5.6 |
19.0 |
| 18–22 Oct |
Feedback |
41.8 |
19.5 |
6.5 |
8.6 |
8.0 |
3.8 |
2.3 |
9.5 |
22.3 |
| 11–22 Oct |
CEO |
37.0 |
19.4 |
8.6 |
11.3 |
7.2 |
3.5 |
2.0 |
11.0 |
17.6 |
| 26–28 Sep |
GESOP |
40.5 |
20.8 |
8.4 |
10.4 |
7.2 |
2.9 |
2.7 |
7.1 |
19.7 |
| 26 Sep |
Metroscopia |
40.7 |
19.2 |
9.2 |
12.5 |
7.6 |
3.6 |
2.6 |
4.6 |
21.5 |
| 20–24 Sep |
Feedback |
41.2 |
20.4 |
8.0 |
10.7 |
7.3 |
3.7 |
2.4 |
6.3 |
20.8 |
| 20–23 Sep |
Demoscopia |
34.6 |
20.2 |
6.9 |
10.1 |
9.3 |
4.4 |
5.6 |
8.9 |
14.4 |
| 1–2 Sep |
Noxa |
38.9 |
21.1 |
10.1 |
11.2 |
9.2 |
2.6 |
|
6.9 |
17.8 |
| 12–14 Jul |
Noxa |
42.1 |
23.1 |
8.4 |
10.3 |
7.4 |
2.4 |
Did not exist |
6.3 |
19.0 |
| 28 Jun–8 Jul |
CEO |
40.5 |
21.1 |
8.7 |
9.8 |
7.4 |
2.6 |
9.9 |
19.4 |
| 2–3 Jul |
NC-Report[lower-alpha 1] |
39.5 |
21.7 |
9.0 |
11.4 |
10.3 |
2.7 |
5.4 |
17.8 |
| 10–11 Jun |
GESOP |
41.0 |
21.0 |
8.5 |
10.0 |
8.5 |
1.2 |
9.8 |
20.0 |
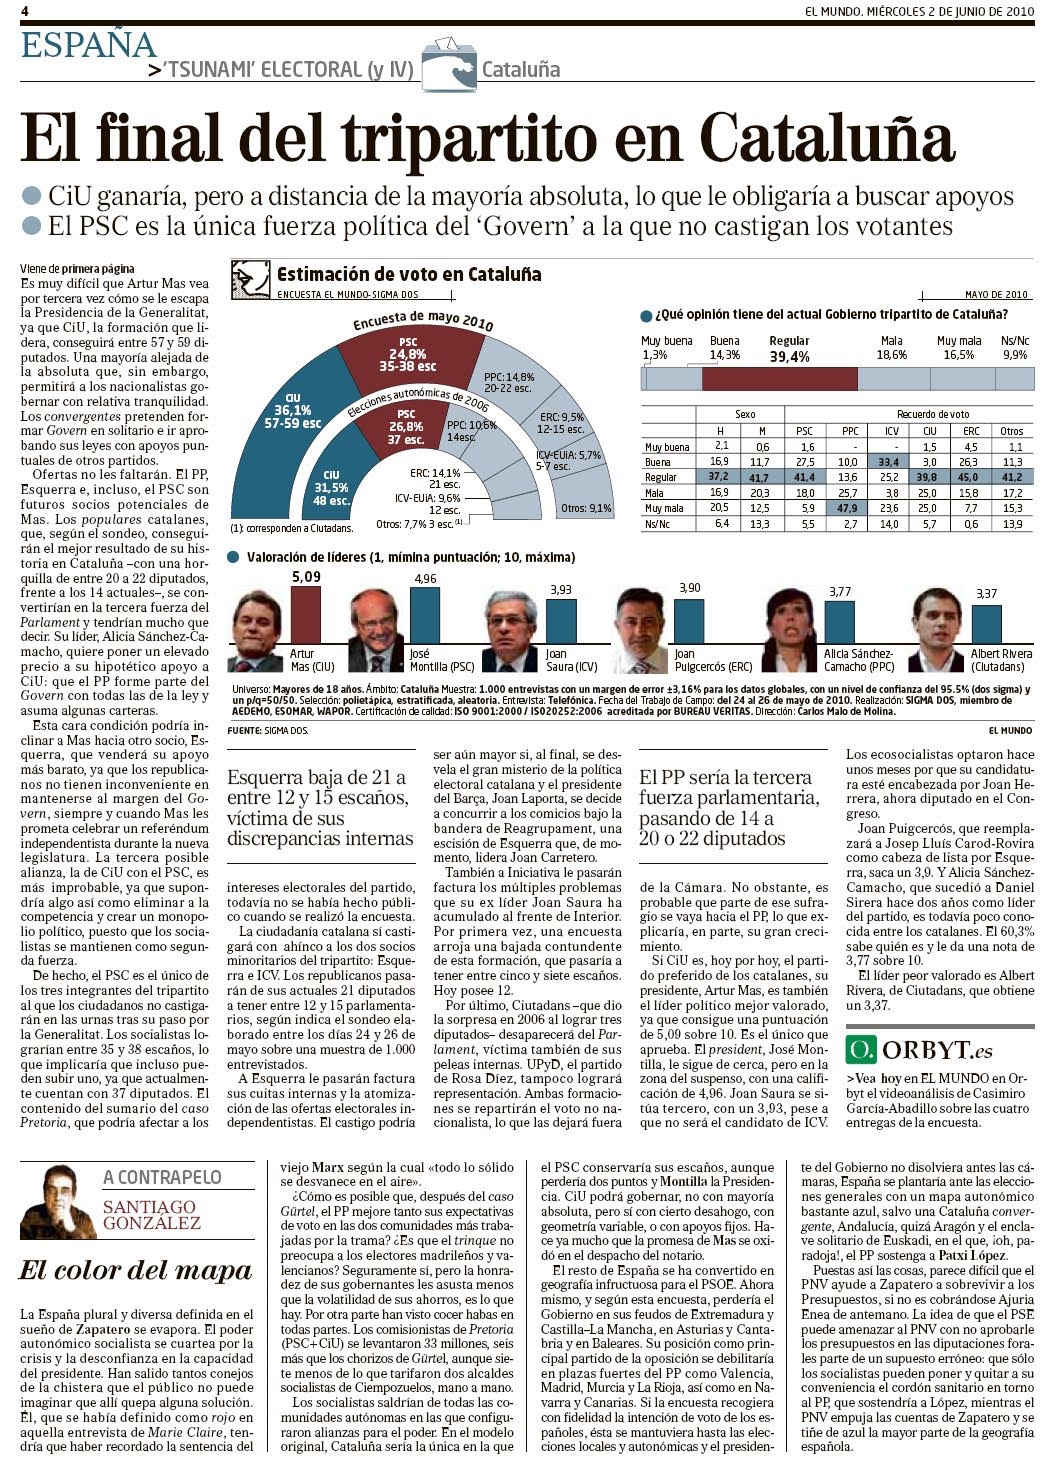
| 24–26 May |
Sigma-2 |
36.1 |
24.8 |
9.5 |
14.8 |
5.7 |
1.4 |
7.7 |
11.3 |
| 10–13 May |
Noxa |
41.1 |
23.5 |
8.7 |
10.5 |
8.5 |
1.4 |
6.3 |
17.6 |
| 16–30 Apr |
CEO |
39.6 |
23.2 |
8.8 |
8.5 |
7.7 |
1.8 |
10.4 |
16.4 |
| 7–16 Apr |
Obradoiro |
38.8 |
28.2 |
9.0 |
7.2 |
7.7 |
1.9 |
7.2 |
10.6 |
| 22–23 Mar |
Demoscopia |
40.5 |
23.9 |
10.3 |
9.3 |
9.2 |
1.8 |
5.0 |
16.6 |
| 15–18 Mar |
GESOP |
38.7 |
23.0 |
8.4 |
9.8 |
8.3 |
1.5 |
10.3 |
15.7 |
| 9–15 Mar |
GAD |
39.0 |
23.5 |
9.4 |
12.7 |
8.8 |
2.1 |
4.5 |
15.5 |
| 8–10 Mar |
Noxa |
43.9 |
23.9 |
7.7 |
10.4 |
9.2 |
0.1 |
4.8 |
20.0 |
| 13–28 Jan |
CEO |
35.6 |
24.7 |
9.8 |
9.7 |
8.5 |
2.1 |
9.6 |
10.9 |
| 2010 |
| 2–13 Nov |
CEO |
33.4 |
23.1 |
10.1 |
10.3 |
6.8 |
1.7 |
Did not exist |
14.6 |
10.3 |
| 26–28 Oct |
GESOP |
35.1 |
25.1 |
10.8 |
9.4 |
10.1 |
1.2 |
8.3 |
10.0 |
| 22–27 Oct |
Noxa |
36.2 |
25.1 |
9.5 |
11.2 |
8.5 |
0.7 |
8.8 |
11.1 |
| 1–4 Sep |
Obradoiro |
35.7 |
30.8 |
6.9 |
10.8 |
8.4 |
1.6 |
5.8 |
4.9 |
| 14–15 Jul |
GESOP |
34.4 |
26.0 |
11.0 |
8.5 |
10.0 |
1.5 |
8.6 |
8.4 |
| 29 Jun–10 Jul |
CEO |
35.4 |
25.5 |
10.4 |
11.3 |
8.7 |
2.6 |
6.1 |
9.9 |
| 7 Jun 2009 |
EP Election |
22.4 |
36.0 |
9.2 |
18.0 |
6.1 |
0.4 |
7.9 |
13.6 |
| 20–30 Apr |
CEO |
38.5 |
23.0 |
12.2 |
10.5 |
7.9 |
2.6 |
5.3 |
15.5 |
| 9–11 Mar |
GESOP |
35.6 |
26.5 |
10.6 |
8.8 |
9.0 |
2.5 |
7.0 |
9.1 |
| 19–28 Jan |
CEO |
34.5 |
24.3 |
12.3 |
8.6 |
9.2 |
2.8 |
8.3 |
10.2 |
| 2009 |
| 24–27 Nov |
Noxa |
34.8 |
26.0 |
13.7 |
9.7 |
9.2 |
2.7 |
Did not exist |
3.9 |
8.8 |
| 10–13 Nov |
GESOP |
34.2 |
26.9 |
13.9 |
8.0 |
9.0 |
2.4 |
5.6 |
7.3 |
| 20–28 Oct |
CEO |
34.0 |
25.6 |
10.8 |
12.2 |
8.9 |
1.9 |
6.6 |
8.4 |
| 1–2 Jul |
GESOP |
34.8 |
27.3 |
12.7 |
9.0 |
8.0 |
3.1 |
5.1 |
7.5 |
| 16 Jun–1 Jul |
CEO |
34.7 |
25.9 |
12.7 |
9.2 |
8.8 |
2.5 |
6.2 |
8.8 |
| 14–25 Apr |
CEO |
31.9 |
29.6 |
11.5 |
10.4 |
9.7 |
3.0 |
3.9 |
2.3 |
| 22–24 Apr |
GESOP |
35.6 |
28.4 |
11.8 |
8.5 |
8.9 |
2.1 |
4.7 |
7.2 |
| 9 Mar |
La Vanguardia |
30.4 |
30.3 |
9.8 |
10.7 |
8.0 |
|
10.8 |
0.1 |
| 9 Mar 2008 |
General Election |
20.9 |
45.4 |
7.8 |
16.4 |
4.9 |
0.7 |
3.9 |
24.5 |
| 8–11 Jan |
GESOP |
33.3 |
27.0 |
11.8 |
10.4 |
8.3 |
2.4 |
6.8 |
6.3 |
| 2008 |
| 22–25 Oct |
Noxa |
30.8 |
28.9 |
14.6 |
10.6 |
8.8 |
3.5 |
Did not exist |
2.8 |
1.9 |
| 14 Oct |
GESOP |
33.0 |
27.0 |
14.0 |
9.5 |
8.5 |
2.0 |
6.0 |
6.0 |
| 17–28 Sep |
CEO |
30.4 |
28.5 |
13.3 |
8.6 |
10.2 |
1.9 |
7.1 |
1.9 |
| 18 Jun–2 Jul |
CEO |
33.4 |
27.0 |
11.9 |
9.0 |
9.9 |
3.6 |
5.2 |
6.4 |
| 25–27 Jun |
GESOP |
33.0 |
27.0 |
13.3 |
9.5 |
9.0 |
2.5 |
5.7 |
6.0 |
| 15–17 Apr |
GESOP |
32.0 |
28.6 |
12.5 |
9.8 |
10.0 |
2.7 |
4.4 |
3.4 |
| 2–16 Mar |
CEO |
29.8 |
27.6 |
13.8 |
10.2 |
10.2 |
3.5 |
4.9 |
2.2 |
| 17–18 Jan |
GESOP |
31.1 |
28.4 |
12.2 |
10.5 |
9.9 |
4.0 |
3.9 |
2.7 |
| 2007 |
| 6–20 Nov |
CEO |
32.6 |
26.3 |
13.1 |
8.6 |
10.5 |
6.0 |
|
2.9 |
6.3 |
| 1 Nov 2006 |
Regional Election |
31.5 |
26.8 |
14.0 |
10.7 |
9.5 |
3.0 |
4.5 |
4.7 |
Seat projections
Opinion polls showing seat projections are displayed in the table below. The highest seat figures in each polling survey have their background shaded in the leading party's colour. In the instance that there is a tie, then no figure is shaded. 68 seats were required for an absolute majority in the Parliament of Catalonia.
68 seats needed for majority
| Date |
Polling Firm/Source |
CiU |
PSC |
ERC |
PPC |
ICV |
C's |
SI |
Others |
|
|
|
|
|
|
|
| 28 Nov 2010 |
Regional Election |
62 |
28 |
10 |
18 |
10 |
3 |
4 |
0 |
| 28 Nov |
Ipsos-Eco |
63−66 |
24−27 |
11−13 |
15−17 |
8−10 |
2−3 |
3−4 |
0 |
| 28 Nov |
GAD |
60−63 |
29−31 |
11−12 |
15−16 |
11−13 |
3−4 |
0−3 |
0 |
| Exit polls |
| 27 Nov |
GESOP |
65−67 |
27−28 |
10−12 |
14−15 |
12−14 |
4 |
0−2 |
0 |
| 27 Nov |
GESOP |
64−66 |
29−30 |
10−12 |
14−15 |
12−13 |
3−4 |
0 |
0 |
| 26 Nov |
GESOP |
65−67 |
29−30 |
10−11 |
13−14 |
11−13 |
3−4 |
0 |
0 |
| 25 Nov |
GESOP |
64−65 |
29−31 |
10−12 |
13−14 |
11−12 |
4−5 |
0 |
0 |
| 24 Nov |
GESOP |
64−65 |
29−31 |
10−12 |
13−14 |
10−12 |
4−5 |
0−2 |
0 |
| 23 Nov |
GESOP |
63−64 |
29−30 |
11−12 |
13−14 |
10−11 |
5 |
0−4 |
0 |
| 22 Nov |
GESOP |
63−64 |
30 |
11 |
14 |
10−11 |
4−5 |
0−4 |
0 |
| 15–20 Nov |
Obradoiro |
62 |
33 |
13 |
12 |
10 |
4 |
1 |
0 |
| 19 Nov |
Demoscopia |
59−60 |
30−32 |
10−11 |
15−16 |
11−12 |
4 |
3 |
0 |
| 15–18 Nov |
NC-Report |
60−62 |
31−32 |
13−14 |
15−16 |
11−12 |
2−3 |
0 |
0 |
| 15–18 Nov |
Sigma-2 |
61−64 |
30−32 |
11 |
17−19 |
9−10 |
3 |
0 |
0 |
| 15–18 Nov |
Noxa |
63−65 |
31−32 |
10−12 |
14 |
9−10 |
4 |
0−1 |
0 |
| 11–18 Nov |
DYM |
60−62 |
31 |
11 |
15−16 |
12−13 |
5 |
0−1 |
0 |
| 16–17 Nov |
Metroscopia |
64−65 |
30 |
8−9 |
13−14 |
10 |
6−7 |
1−3 |
0 |
| 8–12 Nov |
Feedback |
62−63 |
30−31 |
10−11 |
14−15 |
9−10 |
3 |
2−4 |
0−1 |
| 7–10 Nov |
GESOP |
62−63 |
31−32 |
11−12 |
14−15 |
11−12 |
3−4 |
0−2 |
0 |
| 8–9 Nov |
Opina |
65−66 |
30−32 |
10−11 |
14−16 |
7−8 |
3 |
2−3 |
0 |
| 15 Oct–4 Nov |
CIS |
59 |
33 |
15−16 |
13−14 |
11 |
3 |
0 |
0 |
| 26–28 Oct |
NC-Report |
62−63 |
30−31 |
11−12 |
15−16 |
12−13 |
2−3 |
0 |
0 |
| 18–22 Oct |
Feedback |
65−66 |
27−28 |
11−12 |
13 |
9−11 |
4 |
0−4 |
0 |
| 11–22 Oct |
CEO |
62−65 |
29−30 |
13−14 |
16 |
8−9 |
4 |
0 |
0 |
| 26–28 Sep |
GESOP |
63−65 |
30−31 |
12−13 |
14−15 |
9−10 |
2−3 |
0−2 |
0 |
| 26 Sep |
Metroscopia |
61 |
28 |
12 |
17 |
9 |
4 |
2 |
2 |
| 20–24 Sep |
Feedback |
63−65 |
30−31 |
10−11 |
15−16 |
9−10 |
3−4 |
0−3 |
0 |
| 20–23 Sep |
Demoscopia |
56−59 |
30−32 |
9−12 |
13−15 |
13−14 |
4 |
6−8 |
0 |
| 1–2 Sep |
Noxa |
60−61 |
31−32 |
15−16 |
15 |
12 |
0−3 |
0 |
0−3 |
| 12–14 Jul |
Noxa |
65−66 |
32−33 |
13 |
14 |
10 |
0 |
Did not exist |
0 |
| 28 Jun–8 Jul |
CEO |
67−68 |
31−32 |
13 |
13 |
10 |
0 |
0 |
| 2–3 Jul |
NC-Report[lower-alpha 1] |
60−61 |
32−33 |
12−13 |
15−16 |
13−14 |
0 |
0 |
| 10–11 Jun |
GESOP |
65−67 |
30−32 |
12−13 |
13−14 |
10−12 |
0 |
0 |
| 24–26 May |
Sigma-2 |
57−59 |
35−38 |
12−15 |
20−22 |
5−7 |
0 |
0 |
| 10–13 May |
Noxa |
63−64 |
33−34 |
13 |
14 |
11 |
0 |
0 |
| 16–30 Apr |
CEO |
65 |
36 |
13 |
12 |
9 |
0 |
0 |
| 7–16 Apr |
Obradoiro |
58−60 |
41−43 |
13 |
10 |
10−11 |
0 |
0 |
| 22–23 Mar |
Demoscopia |
61−62 |
35−36 |
13−14 |
12−13 |
11−12 |
0 |
0 |
| 15–18 Mar |
GESOP |
61−63 |
34−36 |
12−13 |
13−14 |
11−12 |
0 |
0 |
| 9–15 Mar |
GAD |
59 |
35 |
13 |
16 |
12 |
0 |
0 |
| 8–10 Mar |
Noxa |
65−67 |
32−33 |
11−12 |
13−14 |
11−12 |
0 |
0 |
| 13–28 Jan |
CEO |
58 |
38 |
15 |
13 |
10 |
0 |
1 |
| 2010 |
| 2–13 Nov |
CEO |
55−57 |
36−38 |
17 |
15 |
10 |
0 |
Did not exist |
0 |
| 26–28 Oct |
GESOP |
55−57 |
36−38 |
16−17 |
12−14 |
13−14 |
0 |
0 |
| 22–27 Oct |
Noxa |
57−58 |
35−36 |
14−15 |
15−16 |
10−11 |
0 |
0−3 |
| 1–4 Sep |
Obradoiro |
53−54 |
44−46 |
11 |
13−15 |
11 |
0 |
0 |
| 14–15 Jul |
GESOP |
54−56 |
37−39 |
16−17 |
12 |
12−13 |
0 |
0 |
| 29 Jun–10 Jul |
CEO |
54 |
37 |
15 |
15 |
11 |
3 |
0 |
| 20–30 Apr |
CEO |
59 |
34 |
17 |
14 |
11 |
0 |
0 |
| 9–11 Mar |
GESOP |
55−56 |
38−39 |
15−16 |
12−13 |
11−12 |
0−2 |
0 |
| 19–28 Jan |
CEO |
56 |
35−36 |
17−18 |
12 |
12 |
2 |
0 |
| 2009 |
| 24–27 Nov |
Noxa |
51−53 |
36−37 |
19−20 |
12−13 |
11−12 |
0−3 |
Did not exist |
0 |
| 10–13 Nov |
GESOP |
52−54 |
38−39 |
20−21 |
10−11 |
11−12 |
0−2 |
0 |
| 20–28 Oct |
CEO |
52 |
37 |
16−17 |
15−17 |
12 |
1−2 |
0 |
| 1–2 Jul |
GESOP |
52−53 |
38−39 |
17−18 |
12−13 |
10−11 |
2−3 |
0 |
| 16 Jun–1 Jul |
CEO |
53 |
38 |
18 |
13 |
11 |
2 |
0 |
| 14–25 Apr |
CEO |
48 |
42 |
17 |
13 |
12 |
3 |
0 |
| 22–24 Apr |
GESOP |
53−55 |
40−42 |
17−18 |
10−11 |
11−12 |
0 |
0 |
| 9 Mar |
La Vanguardia |
50 |
45 |
14 |
15 |
11 |
0 |
0 |
| 8–11 Jan |
GESOP |
51−52 |
38−40 |
18 |
14 |
11 |
0−2 |
0 |
| 2008 |
| 22–25 Oct |
Noxa |
46 |
39 |
22 |
14 |
11 |
3 |
Did not exist |
0 |
| 14 Oct |
GESOP |
51−52 |
38−40 |
21−22 |
12−13 |
10−11 |
0 |
0 |
| 17–28 Sep |
CEO |
46−47 |
42 |
20 |
11−12 |
13 |
0−2 |
0 |
| 18 Jun–2 Jul |
CEO |
50−51 |
40 |
17 |
12 |
12−13 |
3 |
0 |
| 25–27 Jun |
GESOP |
51−53 |
38−40 |
19−20 |
12−13 |
11−12 |
0−2 |
0 |
| 15–17 Apr |
GESOP |
49−50 |
39−40 |
18 |
13 |
13 |
2 |
0 |
| 17–18 Jan |
GESOP |
47−48 |
39−40 |
18 |
14 |
12 |
4 |
0 |
| 2007 |
| 1 Nov 2006 |
Regional Election |
48 |
37 |
21 |
14 |
12 |
3 |
|
0 |
Voting preferences
Vote intention
Polls shown below show the recording of raw responses for each party as a percentage of total responses before disregarding those who opted to abstain and prior to the adjusting for the likely votes of those who were undecided to obtain an estimate of vote share. The highest percentage figure in each polling survey is displayed in bold, and the background shaded in the leading party's colour. In the instance that there is a tie, then no figure is shaded.
| Date |
Polling Firm/Source |
CiU |
PSC |
ERC |
PPC |
ICV |
C's |
SI |
Oth. |
No party |
Und. |
|
|
|
|
|
|
|
| 28 Nov 2010 |
Regional Election |
22.4 |
10.7 |
4.1 |
7.2 |
4.3 |
2.0 |
1.9 |
6.2 |
41.2 |
N/A |
| 27 Nov |
GESOP |
32.9 |
14.1 |
5.7 |
6.1 |
6.9 |
2.6 |
2.0 |
8.0 |
5.6 |
16.1 |
| 27 Nov |
GESOP |
30.8 |
16.8 |
4.8 |
5.5 |
5.3 |
3.2 |
2.3 |
9.7 |
5.8 |
15.8 |
| 25 Nov |
GESOP |
30.3 |
17.3 |
4.6 |
5.8 |
6.8 |
2.6 |
2.0 |
10.4 |
7.3 |
12.9 |
| 24 Nov |
GESOP |
32.0 |
18.3 |
4.4 |
5.3 |
5.9 |
2.9 |
2.3 |
10.1 |
6.0 |
12.8 |
| 22 Nov |
GESOP |
29.8 |
16.0 |
4.8 |
5.8 |
4.8 |
2.8 |
3.0 |
12.2 |
4.3 |
16.5 |
| 15–20 Nov |
Obradoiro |
25.7 |
12.8 |
4.8 |
4.9 |
4.0 |
1.9 |
1.6 |
44.3 |
| 8–12 Nov |
Feedback |
25.5 |
13.3 |
5.4 |
3.5 |
3.0 |
1.1 |
1.3 |
10.6 |
10.0 |
26.3 |
| 15 Oct–4 Nov |
CIS |
20.6 |
13.4 |
5.8 |
5.1 |
5.4 |
2.4 |
0.7 |
10.0 |
17.5 |
19.1 |
| 18–22 Oct |
Feedback |
28.4 |
10.6 |
4.2 |
4.0 |
5.2 |
1.9 |
1.8 |
13.7 |
9.0 |
22.2 |
| 11–22 Oct |
CEO |
24.4 |
14.2 |
7.4 |
6.2 |
5.2 |
2.1 |
|
12.1 |
5.9 |
22.5 |
| 3–30 Sep |
ICPS |
22.3 |
21.5 |
6.4 |
4.4 |
4.7 |
1.1 |
1.4 |
6.5 |
16.0 |
15.7 |
| 26–28 Sep |
GESOP |
29.5 |
15.9 |
5.8 |
4.3 |
2.9 |
1.5 |
1.9 |
10.0 |
7.0 |
21.2 |
| 28 Jun–8 Jul |
CEO |
25.3 |
14.2 |
6.0 |
3.8 |
5.6 |
1.0 |
Did not exist |
8.8 |
7.0 |
28.3 |
| 10–11 Jun |
GESOP |
32.3 |
16.1 |
7.1 |
3.9 |
4.1 |
0.8 |
10.5 |
11.0 |
14.2 |
| 16–30 Apr |
CEO |
25.0 |
17.5 |
6.6 |
4.3 |
5.0 |
1.1 |
9.5 |
9.2 |
21.8 |
| 7–16 Apr |
Obradoiro |
24.6 |
20.1 |
5.7 |
4.3 |
5.0 |
1.0 |
39.3 |
| 15–18 Mar |
GESOP |
29.6 |
20.0 |
5.9 |
4.0 |
5.3 |
0.9 |
12.4 |
8.6 |
13.3 |
| 13–28 Jan |
CEO |
23.0 |
17.4 |
7.6 |
4.9 |
5.6 |
1.2 |
9.0 |
10.5 |
20.8 |
| 2010 |
| 2–13 Nov |
CEO |
21.8 |
15.7 |
8.1 |
4.8 |
5.0 |
0.8 |
Did not exist |
14.0 |
13.9 |
15.9 |
| 26–28 Oct |
GESOP |
25.3 |
22.9 |
8.3 |
4.6 |
5.9 |
0.6 |
7.6 |
11.5 |
13.3 |
| 28 Sep–19 Oct |
ICPS |
20.7 |
22.7 |
8.1 |
3.2 |
5.4 |
0.7 |
6.0 |
25.6 |
7.6 |
| 1–4 Sep |
Obradoiro |
22.3 |
22.6 |
3.6 |
5.2 |
4.9 |
0.8 |
40.6 |
| 14–15 Jul |
GESOP |
21.2 |
20.3 |
8.7 |
3.3 |
6.2 |
0.3 |
40.0 |
| 29 Jun–10 Jul |
CEO |
23.8 |
18.0 |
8.4 |
3.9 |
6.9 |
1.1 |
6.0 |
8.6 |
23.3 |
| 20–30 Apr |
CEO |
24.9 |
19.7 |
9.6 |
3.8 |
5.1 |
1.1 |
5.9 |
6.9 |
23.0 |
| 9–11 Mar |
GESOP |
26.6 |
25.4 |
8.3 |
2.9 |
7.0 |
1.3 |
7.2 |
8.0 |
13.3 |
| 19–28 Jan |
CEO |
21.4 |
21.0 |
9.8 |
3.7 |
5.9 |
1.3 |
8.9 |
9.7 |
18.3 |
| 2009 |
| 10–13 Nov |
GESOP |
25.8 |
27.9 |
10.4 |
3.6 |
5.0 |
0.8 |
Did not exist |
5.3 |
8.4 |
12.8 |
| 20 Oct–12 Nov |
ICPS |
19.9 |
27.4 |
8.1 |
4.4 |
4.7 |
0.7 |
3.9 |
22.8 |
8.1 |
| 20–28 Oct |
CEO |
21.2 |
21.6 |
7.9 |
5.2 |
7.1 |
0.7 |
5.7 |
9.9 |
20.7 |
| 1–2 Jul |
GESOP |
25.5 |
26.8 |
11.5 |
3.9 |
5.3 |
1.4 |
3.6 |
8.5 |
13.5 |
| 16 Jun–1 Jul |
CEO |
23.1 |
22.0 |
11.3 |
4.0 |
6.1 |
1.1 |
5.9 |
7.4 |
19.1 |
| 14–25 Apr |
CEO |
21.5 |
27.9 |
9.5 |
4.5 |
7.6 |
1.4 |
3.1 |
6.3 |
18.2 |
| 22–24 Apr |
GESOP |
29.4 |
30.3 |
10.4 |
2.6 |
5.5 |
0.9 |
4.3 |
5.6 |
11.0 |
| 21–30 Jan |
CEO |
20.8 |
21.2 |
10.8 |
2.9 |
7.9 |
1.6 |
3.8 |
7.1 |
23.9 |
| 8–11 Jan |
GESOP |
23.5 |
26.6 |
10.9 |
4.3 |
6.5 |
1.1 |
7.0 |
7.2 |
12.9 |
| 2008 |
| 5 Nov–1 Dec |
ICPS |
15.8 |
22.0 |
8.1 |
4.0 |
5.2 |
0.4 |
Did not exist |
3.0 |
28.9 |
12.6 |
| 20–30 Nov |
CEO |
17.4 |
25.4 |
11.4 |
2.9 |
5.8 |
1.0 |
6.9 |
7.2 |
22.0 |
| 14 Oct |
GESOP |
22.4 |
25.4 |
12.6 |
4.1 |
5.1 |
1.5 |
6.7 |
9.3 |
12.9 |
| 17–28 Sep |
CEO |
16.6 |
20.2 |
10.2 |
2.4 |
7.7 |
1.0 |
7.0 |
9.2 |
25.7 |
| 18 Jun–2 Jul |
CEO |
18.5 |
19.8 |
9.6 |
3.1 |
7.4 |
1.5 |
6.7 |
9.5 |
23.9 |
| 25–27 Jun |
GESOP |
24.5 |
23.5 |
11.5 |
5.1 |
6.5 |
1.5 |
7.5 |
10.0 |
9.9 |
| 15–17 Apr |
GESOP |
24.6 |
25.5 |
11.5 |
3.4 |
7.4 |
1.6 |
4.2 |
8.4 |
13.4 |
| 2–16 Mar |
CEO |
19.5 |
20.2 |
9.6 |
4.1 |
7.2 |
1.8 |
4.8 |
10.1 |
22.7 |
| 17–18 Jan |
GESOP |
24.3 |
22.6 |
11.4 |
4.1 |
7.4 |
2.9 |
4.6 |
9.1 |
13.6 |
| 2007 |
| 6–20 Nov |
CEO |
22.6 |
17.1 |
11.0 |
4.1 |
9.6 |
4.4 |
|
6.1 |
9.1 |
16.0 |
| 1 Nov 2006 |
Regional Election |
17.6 |
15.0 |
7.8 |
5.9 |
5.3 |
1.7 |
2.7 |
44.0 |
N/A |
Results
Overall
← Summary of the 28 November 2010 Catalan Parliament election results →
| |
| Party |
Vote |
Seats |
| Votes |
% |
±pp |
Won |
+/− |
|
Convergence and Union (CiU) |
1,202,830 | 38.43 | +6.91 |
62 | +14 |
|
Socialists' Party of Catalonia (PSC–PSOE) |
575,233 | 18.38 | –8.44 |
28 | –9 |
|
People's Party of Catalonia (PPC) |
387,066 | 12.37 | +1.72 |
18 | +4 |
|
Initiative for Catalonia Greens–United and Alternative Left (ICV–EUiA) |
230,824 | 7.37 | –2.15 |
10 | –2 |
|
Republican Left of Catalonia (ERC) |
219,173 | 7.00 | –7.03 |
10 | –11 |
|
Citizens–Party of the Citizenry (C's) |
106,154 | 3.39 | +0.36 |
3 | ±0 |
|
Catalan Solidarity for Independence (SI) |
102,921 | 3.29 | New |
4 | +4 |
|
Platform for Catalonia (PxC) |
75,134 | 2.40 | New |
0 | ±0 |
|
Independence Rally (RI.cat) |
39,834 | 1.27 | New |
0 | ±0 |
| Parties with less than 1.0% of the vote |
99,476 |
3.18 |
— |
0 |
±0 |
|
Blank Seats–Citizens for Blank Votes (Eb–CenB) |
18,679 | 0.60 | +0.58 |
0 | ±0 |
|
The Greens–European Green Group (EV–GVE) |
15,784 | 0.50 | New |
0 | ±0 |
|
Anti-Bullfighting Party Against Mistreatment of Animals (PACMA) |
14,238 | 0.45 | –0.01 |
0 | ±0 |
|
From Below (Des de Baix) |
7,189 | 0.23 | New |
0 | ±0 |
|
Independent Reus Coordinator (CORI) |
6,990 | 0.22 | New |
0 | ±0 |
|
Pirates of Catalonia (Pirata.cat) |
6,451 | 0.21 | New |
0 | ±0 |
|
Union, Progress and Democracy (UPyD) |
5,418 | 0.17 | New |
0 | ±0 |
|
Pensioners in Action Party (PDLPEA) |
3,330 | 0.11 | New |
0 | ±0 |
|
Communist Party of the People of Catalonia (PCPC–PCPE) |
3,028 | 0.10 | –0.08 |
0 | ±0 |
|
Government Alternative (AG) |
2,208 | 0.07 | New |
0 | ±0 |
|
Family and Life Party (PFyV) |
2,201 | 0.07 | –0.02 |
0 | ±0 |
|
For a Fairer World (PUM+J) |
2,100 | 0.07 | +0.04 |
0 | ±0 |
|
Internationalist Socialist Workers' Party (POSI) |
1,920 | 0.06 | –0.13 |
0 | ±0 |
|
Spanish Falange of the JONS (FE-JONS) |
1,760 | 0.06 | New |
0 | ±0 |
|
Left Republican Party–Republican Left (PRE–IR) |
1,547 | 0.05 | +0.03 |
0 | ±0 |
|
Castilian Party (PCAS) |
1,066 | 0.03 | New |
0 | ±0 |
|
Humanist Party (PH) |
908 | 0.03 | –0.06 |
0 | ±0 |
|
Communist Unification of Spain (UCE) |
904 | 0.03 | New |
0 | ±0 |
|
Farmers for the Catalan Rural Dignity (PDR.cat) |
824 | 0.03 | New |
0 | ±0 |
|
Republican Social Movement (MSR) |
788 | 0.03 | –0.01 |
0 | ±0 |
|
Our People (GN) |
597 | 0.02 | New |
0 | ±0 |
|
We Are All Equal (GLBTH/TSI) |
498 | 0.02 | New |
0 | ±0 |
|
Party for Catalonia (PxCAT) |
314 | 0.01 | New |
0 | ±0 |
|
Democratic and Social Centre (CDS) |
218 | 0.01 | New |
0 | ±0 |
|
Catalan Soberanist Bloc (BSC) |
187 | 0.01 | New |
0 | ±0 |
|
Aragonese Party (PAR) |
98 | 0.00 | New |
0 | ±0 |
|
Internationalist Solidarity and Self-Management (SAIn) |
82 | 0.00 | New |
0 | ±0 |
|
Social and Liberal Alternative (ALS) |
54 | 0.00 | New |
0 | ±0 |
|
Progress and Justice Party (PJP) |
49 | 0.00 | New |
0 | ±0 |
|
Democratic Web (DW) |
46 | 0.00 | New |
0 | ±0 |
|
Blank ballots |
91,631 | 2.93 | +0.90 |
|
| |
| Total |
3,130,276 | 100.00 | |
135 | ±0 |
| |
| Valid votes |
3,130,276 | 99.29 | –0.25 |
|
| Invalid votes |
22,354 | 0.71 | +0.25 |
| Votes cast / turnout |
3,152,630 | 58.78 | +2.74 |
| Abstentions |
2,211,058 | 41.22 | –2.74 |
| Registered voters |
5,363,688 | |
| |
| Source(s):
|
| Vote share |
|---|
|
|
|
|
|
| CiU |
|
38.43% |
| PSC-PSOE |
|
18.38% |
| PPC |
|
12.37% |
| ICV-EUiA |
|
7.37% |
| ERC |
|
7.00% |
| C's |
|
3.39% |
| SI |
|
3.29% |
| PxC |
|
2.40% |
| RI.cat |
|
1.27% |
| Others |
|
3.17% |
| Blank ballots |
|
2.93% |
| Parliamentary seats |
|---|
|
|
|
|
|
| CiU |
|
45.93% |
| PSC-PSOE |
|
20.74% |
| PPC |
|
13.33% |
| ICV-EUiA |
|
7.41% |
| ERC |
|
7.41% |
| SI |
|
2.96% |
| C's |
|
2.22% |
Results by province

| Barcelona |
| Party |
Vote |
Seats |
| Votes |
% |
±pp |
Won |
+/− |
|
Convergence and Union (CiU) |
862,010 | 36.80 | 6.91 |
35 | 8 |
|
Socialists' Party of Catalonia (PSC-PSOE) |
449,549 | 19.19 | 8.71 |
18 | 7 |
|
People's Party of Catalonia (PPC) |
301,440 | 12.87 | 1.71 |
12 | 2 |
|
Initiative for Catalonia Greens-United and Alternative Left (ICV-EUiA) |
193,545 | 8.26 | 2.12 |
8 | 1 |
|
Republican Left of Catalonia (ERC) |
148,973 | 6.36 | 6.25 |
6 | 5 |
|
Citizens-Party of the Citizenry (C's) |
89,990 | 3.84 | 0.31 |
3 | ±0 |
|
Catalan Solidarity for Independence (SI) |
72,693 | 3.10 | New |
3 | 3 |
| |
|
Platform for Catalonia (PxC) |
57,381 | 2.45 | New |
0 | ±0 |
|
Independence Rally (RI.cat) |
23,185 | 0.99 | New |
0 | ±0 |
|
Blank Seats-Citizens for Blank Votes (Eb-CenB) |
14,185 | 0.61 | 0.36 |
0 | ±0 |
|
The Greens-European Green Group (EV-GVE) |
12,087 | 0.52 | 0.28 |
0 | ±0 |
|
Anti-Bullfighting Party Against Mistreatment of Animals (PACMA) |
11,593 | 0.49 | 0.01 |
0 | ±0 |
|
From Below (Des de Baix) |
5,613 | 0.24 | New |
0 | ±0 |
|
Pirates of Catalonia (Pirata.cat) |
5,001 | 0.21 | New |
0 | ±0 |
|
Union, Progress and Democracy (UPyD) |
4,634 | 0.20 | New |
0 | ±0 |
|
Independent Reus Coordinator (CORI) |
4,425 | 0.19 | New |
0 | ±0 |
|
Pensioners in Action Party (PDLPEA) |
2,508 | 0.11 | New |
0 | ±0 |
|
Communist Party of the People of Catalonia (PCPC-PCPE) |
2,262 | 0.10 | 0.06 |
0 | ±0 |
|
Government Alternative (AG) |
2,208 | 0.09 | New |
0 | ±0 |
|
For a Fairer World (PUM+J) |
1,774 | 0.08 | New |
0 | ±0 |
|
Family and Life Party (PFyV) |
1,624 | 0.07 | 0.02 |
0 | ±0 |
|
Internationalist Socialist Workers' Party (POSI) |
1,399 | 0.06 | 0.12 |
0 | ±0 |
|
Spanish Falange of the JONS (FE-JONS) |
1,250 | 0.05 | New |
0 | ±0 |
|
Left Republican Party-Republican Left (PRE-IR) |
1,101 | 0.05 | New |
0 | ±0 |
|
Castilian Party (PCAS) |
1,066 | 0.05 | New |
0 | ±0 |
|
Humanist Party (PH) |
856 | 0.04 | 0.06 |
0 | ±0 |
|
Communist Unification of Spain (UCE) |
726 | 0.03 | New |
0 | ±0 |
|
Our People (GN) |
597 | 0.03 | New |
0 | ±0 |
|
Republican Social Movement (MSR) |
490 | 0.02 | 0.01 |
0 | ±0 |
|
Blank ballots |
68,241 | 2.89 | 0.85 |
|
| |
| Total |
2,342,406 | 100.00 | |
85 | ±0 |
| |
| Valid votes |
2,342,406 | 99.37 | 0.24 |
|
| Invalid votes |
14,857 | 0.63 | 0.24 |
| Votes cast / turnout |
2,357,263 | 58.88 | 2.94 |
| Abstentions |
1,646,488 | 41.12 | 2.94 |
| Registered voters |
4,003,751 | |
| |
| Source(s):
|
|
| Girona |
| Party |
Vote |
Seats |
| Votes |
% |
±pp |
Won |
+/− |
|
Convergence and Union (CiU) |
131,932 | 45.10 | 6.91 |
9 | 2 |
|
Socialists' Party of Catalonia (PSC-PSOE) |
41,742 | 14.27 | 8.71 |
3 | 1 |
|
Republican Left of Catalonia (ERC) |
26,879 | 9.19 | 10.04 |
2 | 2 |
|
People's Party of Catalonia (PPC) |
25,248 | 8.63 | 1.41 |
1 | ±0 |
|
Initiative for Catalonia Greens-United and Alternative Left (ICV-EUiA) |
14,109 | 4.82 | 2.82 |
1 | ±0 |
|
Catalan Solidarity for Independence (SI) |
13,889 | 4.75 | New |
1 | 1 |
|
Independence Rally (RI.cat) |
9,557 | 3.27 | New |
0 | ±0 |
| |
|
Platform for Catalonia (PxC) |
6,441 | 2.20 | New |
0 | ±0 |
|
Citizens-Party of the Citizenry (C's) |
4,954 | 1.69 | 0.75 |
0 | ±0 |
|
Blank Seats-Citizens for Blank Votes (Eb-CenB) |
2,159 | 0.74 | 0.54 |
0 | ±0 |
|
The Greens-European Green Group (EV-GVE) |
1,548 | 0.53 | New |
0 | ±0 |
|
Anti-Bullfighting Party Against Mistreatment of Animals (PACMA) |
1,129 | 0.39 | 0.02 |
0 | ±0 |
|
Farmers for the Catalan Rural Dignity (PDR.cat) |
824 | 0.28 | New |
0 | ±0 |
|
From Below (Des de Baix) |
715 | 0.24 | New |
0 | ±0 |
|
Pirates of Catalonia (Pirata.cat) |
574 | 0.20 | New |
0 | ±0 |
|
We Are All Equal (GLBTH/TSI) |
312 | 0.11 | New |
0 | ±0 |
|
Independent Reus Coordinator (CORI) |
276 | 0.09 | New |
0 | ±0 |
|
Pensioners in Action Party (PDLPEA) |
271 | 0.09 | New |
0 | ±0 |
|
Union, Progress and Democracy (UPyD) |
238 | 0.08 | New |
0 | ±0 |
|
Internationalist Socialist Workers' Party (POSI) |
237 | 0.08 | 0.14 |
0 | ±0 |
|
Communist Party of the People of Catalonia (PCPC-PCPE) |
233 | 0.08 | 0.06 |
0 | ±0 |
|
Family and Life Party (PFyV) |
225 | 0.08 | ±0.00 |
0 | ±0 |
|
Left Republican Party-Republican Left (PRE-IR) |
202 | 0.07 | New |
0 | ±0 |
|
Republican Social Movement (MSR) |
184 | 0.06 | 0.01 |
0 | ±0 |
|
Spanish Falange of the JONS (FE-JONS) |
172 | 0.06 | New |
0 | ±0 |
|
Communist Unification of Spain (UCE) |
47 | 0.02 | New |
0 | ±0 |
|
Blank ballots |
8,439 | 2.86 | 0.86 |
|
| |
| Total |
292,536 | 100.00 | |
17 | ±0 |
| |
| Valid votes |
292,536 | 99.06 | 0.32 |
|
| Invalid votes |
2,790 | 0.94 | 0.32 |
| Votes cast / turnout |
295,326 | 59.49 | 2.36 |
| Abstentions |
201,095 | 40.51 | 2.36 |
| Registered voters |
496,421 | |
| |
| Source(s):
|
|
| Lleida |
| Party |
Vote |
Seats |
| Votes |
% |
±pp |
Won |
+/− |
|
Convergence and Union (CiU) |
87,052 | 46.93 | 6.94 |
9 | 2 |
|
Socialists' Party of Catalonia (PSC-PSOE) |
27,461 | 14.80 | 7.19 |
3 | ±0 |
|
People's Party of Catalonia (PPC) |
18,960 | 10.22 | 1.11 |
2 | 1 |
|
Republican Left of Catalonia (ERC) |
16,966 | 9.15 | 8.57 |
1 | 2 |
|
Initiative for Catalonia Greens-United and Alternative Left (ICV-EUiA) |
7,423 | 4.00 | 2.59 |
0 | 1 |
|
Catalan Solidarity for Independence (SI) |
5,758 | 3.10 | New |
0 | ±0 |
| |
|
Independence Rally (RI.cat) |
4,205 | 2.27 | New |
0 | ±0 |
|
Platform for Catalonia (PxC) |
3,295 | 1.78 | New |
0 | ±0 |
|
Citizens-Party of the Citizenry (C's) |
2,757 | 1.49 | 0.52 |
0 | ±0 |
|
Blank Seats-Citizens for Blank Votes (Eb-CenB) |
1,071 | 0.58 | 0.39 |
0 | ±0 |
|
The Greens-European Green Group (EV-GVE) |
648 | 0.35 | New |
0 | ±0 |
|
Anti-Bullfighting Party Against Mistreatment of Animals (PACMA) |
494 | 0.27 | 0.03 |
0 | ±0 |
|
From Below (Des de Baix) |
490 | 0.26 | New |
0 | ±0 |
|
Pirates of Catalonia (Pirata.cat) |
353 | 0.19 | New |
0 | ±0 |
|
Party for Catalonia (PxCAT) |
314 | 0.17 | New |
0 | ±0 |
|
Communist Party of the People of Catalonia (PCPC-PCPE) |
251 | 0.14 | 0.01 |
0 | ±0 |
|
Independent Reus Coordinator (CORI) |
249 | 0.13 | New |
0 | ±0 |
|
Pensioners in Action Party (PDLPEA) |
216 | 0.12 | New |
0 | ±0 |
|
Catalan Soberanist Bloc (BSC) |
187 | 0.10 | New |
0 | ±0 |
|
Family and Life Party (PFyV) |
125 | 0.07 | 0.04 |
0 | ±0 |
|
For a Fairer World (PUM+J) |
122 | 0.07 | 0.06 |
0 | ±0 |
|
Aragonese Party (PAR) |
98 | 0.05 | New |
0 | ±0 |
|
Union, Progress and Democracy (UPyD) |
94 | 0.05 | New |
0 | ±0 |
|
Spanish Falange of the JONS (FE-JONS) |
89 | 0.05 | New |
0 | ±0 |
|
Democratic and Social Centre (CDS) |
57 | 0.03 | New |
0 | ±0 |
|
Humanist Party (PH) |
52 | 0.03 | 0.06 |
0 | ±0 |
|
Progress and Justice Party (PJP) |
49 | 0.03 | New |
0 | ±0 |
|
Republican Social Movement (MSR) |
47 | 0.03 | ±0.00 |
0 | ±0 |
|
Communist Unification of Spain (UCE) |
46 | 0.02 | New |
0 | ±0 |
|
Blank ballots |
6,565 | 3.51 | 1.24 |
|
| |
| Total |
185,494 | 100.00 | |
15 | ±0 |
| |
| Valid votes |
185,494 | 99.11 | 0.13 |
|
| Invalid votes |
1,665 | 0.89 | 0.13 |
| Votes cast / turnout |
187,159 | 59.87 | 0.87 |
| Abstentions |
125,446 | 40.13 | 0.87 |
| Registered voters |
312,605 | |
| |
| Source(s):
|
|
| Tarragona |
| Party |
Vote |
Seats |
| Votes |
% |
±pp |
Won |
+/− |
|
Convergence and Union (CiU) |
121,836 | 39.32 | 6.89 |
9 | 2 |
|
Socialists' Party of Catalonia (PSC-PSOE) |
56,481 | 18.23 | 7.75 |
4 | 1 |
|
People's Party of Catalonia (PPC) |
41,418 | 13.37 | 2.37 |
3 | 1 |
|
Republican Left of Catalonia (ERC) |
26,355 | 8.51 | 9.11 |
1 | 2 |
|
Initiative for Catalonia Greens-United and Alternative Left (ICV-EUiA) |
15,747 | 5.08 | 1.43 |
1 | ±0 |
|
Catalan Solidarity for Independence (SI) |
10,581 | 3.41 | New |
0 | ±0 |
| |
|
Citizens-Party of the Citizenry (C's) |
8,453 | 2.73 | 0.31 |
0 | ±0 |
|
Platform for Catalonia (PxC) |
8,017 | 2.59 | New |
0 | ±0 |
|
Independence Rally (RI.cat) |
2,887 | 0.93 | New |
0 | ±0 |
|
Independent Reus Coordinator (CORI) |
2,040 | 0.66 | New |
0 | ±0 |
|
The Greens-European Green Group (EV-GVE) |
1,501 | 0.48 | New |
0 | ±0 |
|
Blank Seats-Citizens for Blank Votes (Eb-CenB) |
1,264 | 0.41 | 0.28 |
0 | ±0 |
|
Anti-Bullfighting Party Against Mistreatment of Animals (PACMA) |
1,022 | 0.33 | 0.04 |
0 | ±0 |
|
Pirates of Catalonia (Pirata.cat) |
523 | 0.17 | New |
0 | ±0 |
|
Union, Progress and Democracy (UPyD) |
452 | 0.15 | New |
0 | ±0 |
|
From Below (Des de Baix) |
371 | 0.12 | New |
0 | ±0 |
|
Pensioners in Action Party (PDLPEA) |
335 | 0.11 | New |
0 | ±0 |
|
Internationalist Socialist Workers' Party (POSI) |
284 | 0.09 | 0.15 |
0 | ±0 |
|
Communist Party of the People of Catalonia (PCPC-PCPE) |
282 | 0.09 | 0.13 |
0 | ±0 |
|
Spanish Falange of the JONS (FE-JONS) |
249 | 0.08 | New |
0 | ±0 |
|
Left Republican Party-Republican Left (PRE-IR) |
244 | 0.08 | 0.03 |
0 | ±0 |
|
Family and Life Party (PFyV) |
227 | 0.07 | 0.04 |
0 | ±0 |
|
For a Fairer World (PUM+J) |
204 | 0.07 | 0.06 |
0 | ±0 |
|
We Are All Equal (GLBTH/TSI) |
186 | 0.06 | New |
0 | ±0 |
|
Democratic and Social Centre (CDS) |
161 | 0.05 | New |
0 | ±0 |
|
Communist Unification of Spain (UCE) |
85 | 0.03 | New |
0 | ±0 |
|
Internationalist Solidarity and Self-Management (SAIn) |
82 | 0.03 | New |
0 | ±0 |
|
Republican Social Movement (MSR) |
67 | 0.02 | 0.03 |
0 | ±0 |
|
Social and Liberal Alternative (ALS) |
54 | 0.02 | New |
0 | ±0 |
|
Democratic Web (DW) |
46 | 0.01 | New |
0 | ±0 |
|
Blank ballots |
8,386 | 2.68 | 0.95 |
|
| |
| Total |
309,840 | 100.00 | |
18 | ±0 |
| |
| Valid votes |
309,840 | 99.03 | 0.32 |
|
| Invalid votes |
3,042 | 0.97 | 0.32 |
| Votes cast / turnout |
312,882 | 56.79 | 2.66 |
| Abstentions |
238,029 | 43.21 | 2.66 |
| Registered voters |
550,911 | |
| |
| Source(s):
|
|
Post-election
Investiture voting
1st round: 21 December 2010
Investiture voting for Artur Mas (CiU)
Absolute majority: 68/135 |
| Vote |
Parties |
Votes |
| Yes | CiU (62) | |
 N No N No | PSC (28), PP (18), ICV (10), ERC (10), SI (4), C's (3) | |
| Abstentions | | |
| |
2nd round: 23 December 2010
Investiture voting for Artur Mas (CiU)
Simple majority |
| Vote |
Parties |
Votes |
 Y Yes Y Yes | CiU (62) | |
| No | PP (18), ICV (10), ERC (10), SI (4), C's (3) | |
| Abstentions | PSC (28) | |
| Source: Historia Electoral |
|
Notes
- 1 2 3 4 Poll results are shown projected over candidacy votes (that is, votes going for political parties, excluding blank ballots). The vote percentage in the official election is calculated including blank ballots into the estimation. In order to obtain data comparable to both the official results as well as those of other polls, a rule of three has been applied to the poll projections, with the results of the calculation being shown instead.
References
External links
