Results breakdown of the Spanish general election, 2000 (Congress)
| |
Main: Spanish general election, 2000 | |||
|---|---|---|---|---|
| Sunday, 12 March 2000 | ||||
 | ||||
| Party | Votes | % | MPs | |
| PP | 10,321,178 | 44.5% | 183 | |
| PSOE | 7,918,752 | 34.2% | 125 | |
| IU | 1,263,043 | 5.4% | 8 | |
| CiU | 970,421 | 4.2% | 15 | |
| EAJ/PNV | 353,953 | 1.5% | 7 | |
| BNG | 306,268 | 1.3% | 3 | |
| CC | 248,261 | 1.1% | 4 | |
| Others | 1,799,414 | 7.8% | 5 | |
| Total | 23,181,290 | 100.0% | 350 | |
This is the results breakdown of the Congress of Deputies election held in Spain on 12 March 2000.
Nationwide
Overall
 | ||||||
| Party | Popular vote | Seats | ||||
|---|---|---|---|---|---|---|
| Votes | % | ±pp | Won | +/− | ||
| People's Party (PP) | 10,321,178 | 44.52 | +5.73 | 183 | +27 | |
| Spanish Socialist Workers' Party–Progressives (PSOE) | 7,918,752 | 34.16 | –3.47 | 125 | –16 | |
| United Left (IU)[lower-alpha 1] | 1,263,043 | 5.45 | –3.90 | 8 | –11 | |
| Convergence and Union (CiU) | 970,421 | 4.19 | –0.41 | 15 | –1 | |
| Basque Nationalist Party (EAJ/PNV) | 353,953 | 1.53 | +0.26 | 7 | +2 | |
| Galician Nationalist Bloc (BNG) | 306,268 | 1.32 | +0.44 | 3 | +1 | |
| Canarian Coalition (CC) | 248,261 | 1.07 | +0.19 | 4 | ±0 | |
| Andalusian Party (PA) | 206,255 | 0.89 | +0.35 | 1 | +1 | |
| Republican Left of Catalonia (ERC) | 194,715 | 0.84 | +0.17 | 1 | ±0 | |
| Initiative for Catalonia–Greens (IC–V)[lower-alpha 2] | 119,290 | 0.51 | –0.68 | 1 | –1 | |
| Basque Solidarity (EA) | 100,742 | 0.43 | –0.03 | 1 | ±0 | |
| Aragonese Union (CHA) | 75,356 | 0.33 | +0.13 | 1 | +1 | |
| Independent Liberal Group (GIL) | 72,162 | 0.31 | New | 0 | ±0 | |
| The Greens (LV) | 70,906 | 0.31 | +0.06 | 0 | ±0 | |
| Valencian Nationalist Bloc–The Greens–Valencians for Change (BNV–EV)[lower-alpha 3] | 58,551 | 0.25 | +0.14 | 0 | ±0 | |
| Valencian Union (UV) | 57,830 | 0.25 | –0.12 | 0 | –1 | |
| Leonese People's Union (UPL) | 41,690 | 0.18 | +0.13 | 0 | ±0 | |
| Aragonese Party (PAR) | 38,883 | 0.17 | New | 0 | ±0 | |
| Centrist Union–Democratic and Social Centre (UC–CDS) | 23,576 | 0.10 | –0.08 | 0 | ±0 | |
| Socialist Party of Majorca–Nationalist Agreement (PSM–EN) | 23,482 | 0.10 | ±0.00 | 0 | ±0 | |
| The Greens Ecopacifists (LVE) | 22,220 | 0.10 | New | 0 | ±0 | |
| Parties with less than 0.1% of the vote | 326,917 | 1.41 | — | 0 | –2 | |
|---|---|---|---|---|---|---|
| The Greens of the Madrid Community (LVCM) | 21,087 | 0.09 | +0.06 | 0 | ±0 | |
| The Greens–Green Group (LV–GV) | 20,618 | 0.09 | +0.02 | 0 | ±0 | |
| Humanist Party (PH) | 19,683 | 0.08 | +0.03 | 0 | ±0 | |
| Commoners' Land–Castilian Nationalist Party (TC–PNC) | 18,290 | 0.08 | +0.06 | 0 | ±0 | |
| Natural Law Party (PLN) | 17,372 | 0.07 | New | 0 | ±0 | |
| The Falange (FE) | 14,431 | 0.06 | New | 0 | ±0 | |
| Asturian Renewal Union (URAS) | 13,360 | 0.06 | New | 0 | ±0 | |
| Communist Party of the Peoples of Spain (PCPE) | 12,898 | 0.06 | ±0.00 | 0 | ±0 | |
| Internationalist Socialist Workers' Party (POSI) | 12,208 | 0.05 | +0.04 | 0 | ±0 | |
| The Greens–Green Alternative (EV–AV) | 11,579 | 0.05 | New | 0 | ±0 | |
| Party of Independents from Lanzarote (PIL) | 10,323 | 0.04 | New | 0 | ±0 | |
| Spain 2000 Platform (ES2000) | 9,562 | 0.04 | New | 0 | ±0 | |
| Spanish Democratic Party (PADE) | 9,136 | 0.04 | New | 0 | ±0 | |
| Democrats' Convergence of Navarre (CDN) | 8,646 | 0.04 | –0.03 | 0 | ±0 | |
| Majorcan Union–Independents of Menorca (UM–INME) | 8,372 | 0.04 | +0.01 | 0 | ±0 | |
| Andalusian Left (IA) | 8,175 | 0.04 | New | 0 | ±0 | |
| Independent Spanish Falange–Falange 2000 (FEI–FE 2000) | 6,621 | 0.03 | +0.02 | 0 | ±0 | |
| Melilla's Localist Bloc (BLM) | 6,514 | 0.03 | New | 0 | ±0 | |
| Riojan Party (PR) | 6,155 | 0.03 | +0.01 | 0 | ±0 | |
| Asturianist Party (PAS) | 5,876 | 0.03 | –0.02 | 0 | ±0 | |
| Regionalist Unity of Castile and León (URCL) | 5,683 | 0.02 | ±0.00 | 0 | ±0 | |
| United Extremadura (EU) | 4,771 | 0.02 | New | 0 | ±0 | |
| Party of Self-employed and Professionals (AUTONOMO) | 4,218 | 0.02 | New | 0 | ±0 | |
| Independent Candidacy–Castile and León Party (PCL) | 4,184 | 0.02 | New | 0 | ±0 | |
| Catalan State (EC) | 3,356 | 0.01 | New | 0 | ±0 | |
| Andalusian Nation (NA) | 3,262 | 0.01 | ±0.00 | 0 | ±0 | |
| Galician Democracy (DG) | 2,958 | 0.01 | New | 0 | ±0 | |
| Republican Action (AR) | 2,858 | 0.01 | +0.01 | 0 | ±0 | |
| Party of the Democratic Karma (PKD) | 2,759 | 0.01 | New | 0 | ±0 | |
| Andalusia Assembly (A) | 2,727 | 0.01 | New | 0 | ±0 | |
| Party of Self-employed, Retirees and Independents (EL–PAPI) | 2,713 | 0.01 | New | 0 | ±0 | |
| Extremaduran Coalition (CREx–PREx) | 2,371 | 0.01 | –0.02 | 0 | ±0 | |
| Galician Coalition (CG) | 2,361 | 0.01 | New | 0 | ±0 | |
| Zamoran People's Union (UPZ) | 2,347 | 0.01 | New | 0 | ±0 | |
| Galician People's Front (FPG) | 2,252 | 0.01 | ±0.00 | 0 | ±0 | |
| Carlist Party (PC) | 2,131 | 0.01 | New | 0 | ±0 | |
| Regionalist Party of the Leonese Country (PREPAL) | 2,118 | 0.01 | ±0.00 | 0 | ±0 | |
| Cantabrian Nationalist Council (CNC) | 2,103 | 0.01 | New | 0 | ±0 | |
| Andecha Astur (AA) | 2,036 | 0.01 | New | 0 | ±0 | |
| Self-employed Spanish Party (PEDA) | 1,904 | 0.01 | New | 0 | ±0 | |
| Internationalist Struggle (LI (LIT–CI)) | 1,716 | 0.01 | New | 0 | ±0 | |
| Party Association of Widows and Legal Wives (PAVIEL) | 1,690 | 0.01 | New | 0 | ±0 | |
| Republican Left–Left Republican Party (IR–PRE) | 1,541 | 0.01 | New | 0 | ±0 | |
| Party of Self-employed, Retirees and Widows (PAE) | 1,462 | 0.01 | +0.01 | 0 | ±0 | |
| Independent Salamancan Union (USI) | 1,416 | 0.01 | New | 0 | ±0 | |
| Independent Socialists of Extremadura (SIEx) | 1,412 | 0.01 | ±0.00 | 0 | ±0 | |
| Madrilenian Independent Regional Party (PRIM) | 1,363 | 0.01 | ±0.00 | 0 | ±0 | |
| Caló Nationalist Party (PNCA) | 1,331 | 0.01 | New | 0 | ±0 | |
| El Bierzo Party (PB) | 1,191 | 0.01 | +0.01 | 0 | ±0 | |
| Asturian Left Bloc (BIA) | 1,085 | 0.00 | New | 0 | ±0 | |
| Aragonese Initiative (INAR) | 1,057 | 0.00 | New | 0 | ±0 | |
| Progressives of Canaries Unity (UP–CAN) | 980 | 0.00 | New | 0 | ±0 | |
| Valencian Nationalist Left (ENV) | 920 | 0.00 | ±0.00 | 0 | ±0 | |
| Almerian Regionalist Union (URAL) | 838 | 0.00 | New | 0 | ±0 | |
| Socialist Party of the People of Ceuta (PSPC) | 788 | 0.00 | –0.01 | 0 | ±0 | |
| European National State (N) | 710 | 0.00 | ±0.00 | 0 | ±0 | |
| Liberal and Social Democratic Coalition (CSD–L) | 650 | 0.00 | New | 0 | ±0 | |
| Citizens Convergence of the South-East (CCSE) | 645 | 0.00 | New | 0 | ±0 | |
| Federal Progressives (PF) | 609 | 0.00 | New | 0 | ±0 | |
| New Region (NR) | 598 | 0.00 | –0.01 | 0 | ±0 | |
| Christian Positivist Party (PPCr) | 546 | 0.00 | New | 0 | ±0 | |
| Balearic People's Union (UPB) | 524 | 0.00 | New | 0 | ±0 | |
| Voice of the Andalusian People (VDPA) | 493 | 0.00 | ±0.00 | 0 | ±0 | |
| Independent Initiative (II) | 425 | 0.00 | New | 0 | ±0 | |
| Regionalist Party of Guadalajara (PRGU) | 400 | 0.00 | ±0.00 | 0 | ±0 | |
| Iberian Union (UNIB) | 388 | 0.00 | New | 0 | ±0 | |
| New Force (FN) | 343 | 0.00 | New | 0 | ±0 | |
| Social and Autonomist Liberal Group (ALAS) | 339 | 0.00 | ±0.00 | 0 | ±0 | |
| Balearic Islands Renewal Party (PRIB) | 334 | 0.00 | New | 0 | ±0 | |
| Canarian Pensionist Tagoror (TPC) | 319 | 0.00 | New | 0 | ±0 | |
| National Union (UN) | 314 | 0.00 | New | 0 | ±0 | |
| Cives (Cives) | 206 | 0.00 | New | 0 | ±0 | |
| Movement for Humanist Socialism (MASH) | 121 | 0.00 | New | 0 | ±0 | |
| Democratic Party of the People (PDEP) | 85 | 0.00 | New | 0 | ±0 | |
| Nationalist Aprome (Aprome) | 60 | 0.00 | New | 0 | ±0 | |
| Basque Citizens (EH)[lower-alpha 4] | 0 | 0.00 | –0.72 | 0 | –2 | |
| Blank ballots | 366,823 | 1.58 | +0.61 | |||
| Total | 23,181,290 | 100.00 | 350 | ±0 | ||
| Valid votes | 23,181,290 | 99.32 | –0.18 | |||
| Invalid votes | 158,200 | 0.68 | +0.18 | |||
| Votes cast / turnout | 23,339,490 | 68.71 | –8.67 | |||
| Abstentions | 10,630,150 | 31.29 | +8.67 | |||
| Registered voters | 33,969,640 | |||||
| Source: Ministry of the Interior | ||||||
| ||||||
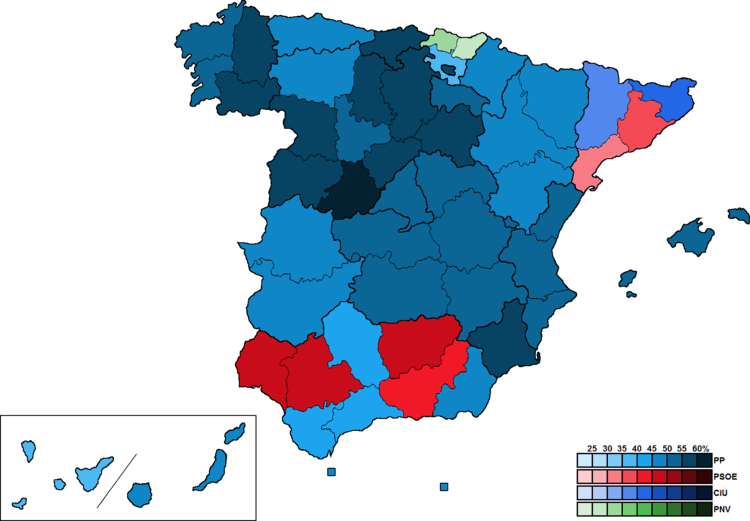
Distribution by constituency
| Constituency | PP | PSOE | IU | CiU | PNV | BNG | CC | PA | ERC | ICV | EA | CHA | ||||||||||||
|---|---|---|---|---|---|---|---|---|---|---|---|---|---|---|---|---|---|---|---|---|---|---|---|---|
| % | S | % | S | % | S | % | S | % | S | % | S | % | S | % | S | % | S | % | S | % | S | % | S | |
| A Coruña | 51.9 | 5 | 24.8 | 2 | 1.4 | − | 19.3 | 2 | ||||||||||||||||
| Álava | 39.1 | 2 | 24.3 | 1 | 5.6 | − | 20.7 | 1 | 4.7 | − | ||||||||||||||
| Almería | 48.7 | 3 | 42.3 | 2 | 4.2 | − | 2.4 | − | ||||||||||||||||
| Albacete | 51.2 | 2 | 41.2 | 2 | 5.0 | − | ||||||||||||||||||
| Alicante | 54.3 | 7 | 34.8 | 4 | 5.3 | − | 0.1 | − | ||||||||||||||||
| Asturias | 46.3 | 5 | 37.0 | 3 | 10.3 | 1 | ||||||||||||||||||
| Ávila | 65.3 | 2 | 26.7 | 1 | 4.8 | − | ||||||||||||||||||
| Badajoz | 47.0 | 3 | 44.8 | 3 | 5.4 | − | ||||||||||||||||||
| Balearic | 53.9 | 5 | 29.3 | 2 | 4.0 | − | 0.3 | − | ||||||||||||||||
| Barcelona | 23.5 | 8 | 35.5 | 12 | 2.5 | − | 26.3 | 9 | 5.1 | 1 | 4.1 | 1 | ||||||||||||
| Biscay | 27.3 | 3 | 22.9 | 2 | 5.8 | − | 34.2 | 4 | 5.1 | − | ||||||||||||||
| Burgos | 58.4 | 3 | 29.0 | 1 | 4.6 | − | ||||||||||||||||||
| Cáceres | 47.8 | 3 | 44.6 | 2 | 3.7 | − | ||||||||||||||||||
| Cádiz | 41.2 | 4 | 39.4 | 4 | 6.7 | − | 9.9 | 1 | ||||||||||||||||
| Cantabria | 56.8 | 3 | 33.5 | 2 | 5.0 | − | ||||||||||||||||||
| Castellón | 53.8 | 3 | 35.3 | 2 | 3.8 | − | 0.2 | − | ||||||||||||||||
| Ceuta | 47.6 | 1 | 18.0 | − | 0.8 | − | ||||||||||||||||||
| Ciudad Real | 51.7 | 3 | 42.6 | 2 | 3.7 | − | ||||||||||||||||||
| Córdoba | 40.9 | 3 | 40.5 | 3 | 11.9 | 1 | 4.5 | − | ||||||||||||||||
| Cuenca | 53.4 | 2 | 41.2 | 1 | 2.9 | − | ||||||||||||||||||
| Gipuzkoa | 24.6 | 2 | 23.7 | 1 | 4.7 | − | 27.7 | 2 | 14.1 | 1 | ||||||||||||||
| Girona | 15.9 | 1 | 28.4 | 2 | 1.5 | − | 41.0 | 2 | 8.7 | − | 1.8 | − | ||||||||||||
| Granada | 42.7 | 3 | 44.4 | 4 | 7.2 | − | 3.5 | − | ||||||||||||||||
| Guadalajara | 54.4 | 2 | 36.1 | 1 | 5.8 | − | ||||||||||||||||||
| Huelva | 40.2 | 2 | 46.9 | 3 | 6.4 | − | 4.7 | − | ||||||||||||||||
| Huesca | 45.1 | 2 | 37.1 | 1 | 3.1 | − | 5.5 | − | ||||||||||||||||
| Jaén | 40.3 | 3 | 47.7 | 3 | 7.1 | − | 3.3 | − | ||||||||||||||||
| La Rioja | 54.1 | 3 | 34.9 | 1 | 4.0 | − | ||||||||||||||||||
| Las Palmas | 48.0 | 4 | 18.4 | 1 | 2.5 | − | 25.8 | 2 | ||||||||||||||||
| León | 48.8 | 3 | 32.0 | 2 | 3.6 | − | ||||||||||||||||||
| Lleida | 21.0 | 1 | 27.6 | 1 | 1.0 | − | 39.0 | 2 | 7.2 | − | 1.8 | − | ||||||||||||
| Lugo | 58.0 | 3 | 22.9 | 1 | 1.0 | − | 16.2 | − | ||||||||||||||||
| Madrid | 52.5 | 19 | 33.1 | 12 | 9.1 | 3 | ||||||||||||||||||
| Málaga | 43.5 | 5 | 39.1 | 4 | 8.1 | 1 | 5.2 | − | ||||||||||||||||
| Melilla | 49.8 | 1 | 20.4 | − | 1.5 | − | ||||||||||||||||||
| Murcia | 58.1 | 6 | 32.4 | 3 | 6.2 | − | ||||||||||||||||||
| Navarre | 49.9 | 3 | 27.3 | 2 | 7.6 | − | 2.2 | − | 4.7 | − | ||||||||||||||
| Ourense | 57.2 | 3 | 23.1 | 1 | 0.7 | − | 17.0 | − | ||||||||||||||||
| Palencia | 55.5 | 2 | 35.8 | 1 | 4.2 | − | ||||||||||||||||||
| Pontevedra | 53.4 | 5 | 23.0 | 2 | 1.5 | − | 19.6 | 1 | ||||||||||||||||
| Salamanca | 58.5 | 3 | 32.7 | 1 | 3.7 | − | ||||||||||||||||||
| Santa Cruz | 35.0 | 3 | 26.3 | 2 | 2.3 | − | 33.7 | 2 | ||||||||||||||||
| Segovia | 57.5 | 2 | 30.8 | 1 | 5.2 | − | ||||||||||||||||||
| Seville | 35.0 | 5 | 49.0 | 7 | 8.3 | 1 | 5.1 | − | ||||||||||||||||
| Soria | 58.5 | 2 | 32.0 | 1 | 4.3 | − | ||||||||||||||||||
| Tarragona | 24.3 | 2 | 32.4 | 2 | 1.4 | − | 31.1 | 2 | 6.1 | − | 2.1 | − | ||||||||||||
| Teruel | 47.9 | 2 | 33.8 | 1 | 2.9 | − | 3.4 | − | ||||||||||||||||
| Toledo | 52.7 | 3 | 40.3 | 2 | 4.6 | − | ||||||||||||||||||
| Valencia | 50.5 | 9 | 33.2 | 6 | 6.5 | 1 | 0.1 | − | ||||||||||||||||
| Valladolid | 53.1 | 3 | 35.1 | 2 | 6.1 | − | ||||||||||||||||||
| Zamora | 58.8 | 2 | 32.4 | 1 | 2.8 | − | ||||||||||||||||||
| Zaragoza | 47.6 | 4 | 29.2 | 2 | 3.7 | − | 12.8 | 1 | ||||||||||||||||
| Total | 44.5 | 183 | 34.2 | 125 | 5.4 | 8 | 4.2 | 15 | 1.5 | 7 | 1.3 | 3 | 1.1 | 4 | 0.9 | 1 | 0.8 | 1 | 0.5 | 1 | 0.4 | 1 | 0.3 | 1 |
Autonomous communities
Andalusia
.png)
| Party | Popular vote | Seats | ||||
|---|---|---|---|---|---|---|
| Votes | % | ±pp | Won | +/− | ||
| Spanish Socialist Workers' Party–Progressives (PSOE) | 1,771,968 | 43.86 | –2.80 | 30 | –2 | |
| People's Party (PP) | 1,639,034 | 40.57 | +5.19 | 28 | +4 | |
| United Left/The Greens–Assembly for Andalusia (IULV–CA) | 315,891 | 7.82 | –5.66 | 3 | –3 | |
| Andalusian Party (PA) | 206,255 | 5.11 | +1.99 | 1 | +1 | |
| Parties with less than 1.0% of the vote | 51,618 | 1.28 | — | 0 | ±0 | |
|---|---|---|---|---|---|---|
| Independent Liberal Group (GIL) | 16,123 | 0.40 | New | 0 | ±0 | |
| Andalusian Left (IA) | 8,175 | 0.20 | New | 0 | ±0 | |
| Communist Party of the Peoples of Spain (PCPE) | 3,559 | 0.09 | –0.03 | 0 | ±0 | |
| Andalusian Nation (NA) | 3,262 | 0.08 | ±0.00 | 0 | ±0 | |
| Humanist Party (PH) | 3,197 | 0.08 | +0.02 | 0 | ±0 | |
| Andalusia Assembly (A) | 2,727 | 0.07 | New | 0 | ±0 | |
| Natural Law Party (PLN) | 2,430 | 0.06 | New | 0 | ±0 | |
| The Falange (FE) | 2,388 | 0.06 | New | 0 | ±0 | |
| Centrist Union–Democratic and Social Centre (UC–CDS) | 2,074 | 0.05 | –0.02 | 0 | ±0 | |
| Spain 2000 Platform (ES2000) | 1,584 | 0.04 | New | 0 | ±0 | |
| Spanish Democratic Party (PADE) | 1,481 | 0.04 | New | 0 | ±0 | |
| Independent Spanish Falange–Falange 2000 (FEI–FE 2000) | 1,203 | 0.03 | +0.02 | 0 | ±0 | |
| Internationalist Socialist Workers' Party (POSI) | 921 | 0.02 | New | 0 | ±0 | |
| Almerian Regionalist Union (URAL) | 838 | 0.02 | New | 0 | ±0 | |
| Christian Positivist Party (PPCr) | 546 | 0.01 | New | 0 | ±0 | |
| Voice of the Andalusian People (VDPA) | 493 | 0.01 | ±0.00 | 0 | ±0 | |
| National Union (UN) | 314 | 0.00 | New | 0 | ±0 | |
| Republican Action (AR) | 303 | 0.01 | New | 0 | ±0 | |
| Blank ballots | 55,486 | 1.37 | +0.54 | |||
| Total | 4,040,252 | 100.00 | 62 | ±0 | ||
| Valid votes | 4,040,252 | 99.30 | –0.12 | |||
| Invalid votes | 28,541 | 0.70 | +0.12 | |||
| Votes cast / turnout | 4,068,793 | 68.77 | –9.23 | |||
| Abstentions | 1,847,990 | 31.23 | +9.23 | |||
| Registered voters | 5,916,783 | |||||
| Source: Ministry of the Interior | ||||||
Aragon
| Party | Popular vote | Seats | ||||
|---|---|---|---|---|---|---|
| Votes | % | ±pp | Won | +/− | ||
| People's Party (PP) | 341,396 | 47.23 | –0.69 | 8 | ±0 | |
| Spanish Socialist Workers' Party–Progressives (PSOE) | 224,650 | 31.08 | –3.56 | 4 | –1 | |
| Aragonese Union (CHA) | 75,356 | 10.42 | +4.00 | 1 | +1 | |
| Aragonese Party (PAR) | 38,883 | 5.38 | New | 0 | ±0 | |
| United Left of Aragon (IU) | 25,395 | 3.51 | –5.63 | 0 | ±0 | |
| Parties with less than 1.0% of the vote | 6,707 | 0.93 | — | 0 | ±0 | |
|---|---|---|---|---|---|---|
| The Greens–Green Group–SOS Nature (LV–GV) | 3,774 | 0.52 | +0.16 | 0 | ±0 | |
| Aragonese Initiative (INAR) | 1,057 | 0.15 | New | 0 | ±0 | |
| The Falange (FE) | 374 | 0.05 | New | 0 | ±0 | |
| Humanist Party (PH) | 348 | 0.05 | +0.01 | 0 | ±0 | |
| Natural Law Party (PLN) | 283 | 0.04 | New | 0 | ±0 | |
| Spain 2000 Platform (ES2000) | 205 | 0.03 | New | 0 | ±0 | |
| Centrist Union–Democratic and Social Centre (UC–CDS) | 194 | 0.03 | –0.04 | 0 | ±0 | |
| Independent Spanish Falange–Falange 2000 (FEI–FE 2000) | 192 | 0.03 | New | 0 | ±0 | |
| Catalan State (EC) | 162 | 0.02 | New | 0 | ±0 | |
| Spanish Democratic Party (PADE) | 118 | 0.02 | New | 0 | ±0 | |
| Blank ballots | 10,473 | 1.45 | +0.24 | |||
| Total | 722,860 | 100.00 | 13 | ±0 | ||
| Valid votes | 722,860 | 99.29 | –0.22 | |||
| Invalid votes | 5,200 | 0.71 | +0.22 | |||
| Votes cast / turnout | 728,060 | 71.39 | –6.07 | |||
| Abstentions | 291,785 | 28.61 | +6.07 | |||
| Registered voters | 1,019,845 | |||||
| Source: Ministry of the Interior | ||||||
Asturias
.png)
| Party | Popular vote | Seats | ||||
|---|---|---|---|---|---|---|
| Votes | % | ±pp | Won | +/− | ||
| People's Party (PP) | 302,626 | 46.33 | +5.30 | 5 | +1 | |
| Spanish Socialist Workers' Party–Progressives (PSOE) | 241,830 | 37.02 | –2.83 | 3 | –1 | |
| United Left (IU) | 67,024 | 10.26 | –5.25 | 1 | ±0 | |
| Asturian Renewal Union (URAS) | 13,360 | 2.05 | New | 0 | ±0 | |
| Parties with less than 1.0% of the vote | 17,409 | 2.67 | — | 0 | ±0 | |
|---|---|---|---|---|---|---|
| Asturianist Party (PAS) | 5,876 | 0.90 | –0.79 | 0 | ±0 | |
| The Greens of Asturias (LV) | 4,874 | 0.75 | +0.26 | 0 | ±0 | |
| Andecha Astur (AA) | 2,036 | 0.31 | +0.20 | 0 | ±0 | |
| Asturian Left Bloc (BIA) | 1,085 | 0.17 | New | 0 | ±0 | |
| Party of Self-employed and Professionals (AUTONOMO) | 1,036 | 0.16 | New | 0 | ±0 | |
| Centrist Union–Democratic and Social Centre (UC–CDS) | 658 | 0.10 | –0.14 | 0 | ±0 | |
| Spain 2000 Platform (ES2000) | 607 | 0.09 | New | 0 | ±0 | |
| Humanist Party (PH) | 329 | 0.05 | New | 0 | ±0 | |
| The Falange (FE) | 295 | 0.05 | New | 0 | ±0 | |
| Natural Law Party (PLN) | 280 | 0.04 | New | 0 | ±0 | |
| Independent Spanish Falange–Falange 2000 (FEI–FE 2000) | 173 | 0.03 | New | 0 | ±0 | |
| Spanish Democratic Party (PADE) | 160 | 0.02 | New | 0 | ±0 | |
| Blank ballots | 10,985 | 1.68 | +0.74 | |||
| Total | 653,234 | 100.00 | 9 | ±0 | ||
| Valid votes | 653,234 | 99.34 | –0.18 | |||
| Invalid votes | 4,319 | 0.66 | +0.18 | |||
| Votes cast / turnout | 657,553 | 66.99 | –8.92 | |||
| Abstentions | 323,951 | 33.01 | +8.92 | |||
| Registered voters | 981,504 | |||||
| Source: Ministry of the Interior | ||||||
Balearic Islands
.png)
| Party | Popular vote | Seats | ||||
|---|---|---|---|---|---|---|
| Votes | % | ±pp | Won | +/− | ||
| People's Party (PP) | 214,348 | 53.87 | +7.46 | 5 | +1 | |
| Spanish Socialist Workers' Party (PSOE) | 116,515 | 29.28 | –6.67 | 2 | –1 | |
| Socialist Party of Majorca–Nationalist Agreement (PSM–EN) | 23,482 | 5.90 | +0.19 | 0 | ±0 | |
| United Left of the Balearic Islands (EU) | 15,928 | 4.00 | –3.69 | 0 | ±0 | |
| The Greens of the Balearic Islands (EVIB) | 9,556 | 2.40 | +0.18 | 0 | ±0 | |
| Majorcan Union–Independents of Menorca (UM–INME) | 8,372 | 2.10 | +0.49 | 0 | ±0 | |
| Parties with less than 1.0% of the vote | 3,754 | 0.94 | — | 0 | − | |
|---|---|---|---|---|---|---|
| Republican Left of Catalonia (ERC) | 1,340 | 0.34 | –0.08 | 0 | ±0 | |
| Balearic People's Union (UPB) | 524 | 0.13 | New | 0 | ±0 | |
| Workers for Democracy Coalition (TD)[lower-alpha 1] | 423 | 0.11 | +0.02 | 0 | ±0 | |
| Centrist Union–Democratic and Social Centre (UC–CDS) | 341 | 0.09 | -0.01 | 0 | ±0 | |
| Balearic Islands Renewal Party (PRIB) | 334 | 0.08 | New | 0 | ±0 | |
| Spain 2000 Platform (ES2000) | 221 | 0.06 | New | 0 | ±0 | |
| The Falange (FE) | 220 | 0.06 | New | 0 | ±0 | |
| Independent Spanish Falange–Falange 2000 (FEI–FE 2000) | 182 | 0.05 | New | 0 | ±0 | |
| Catalan State (EC) | 169 | 0.04 | New | 0 | ±0 | |
| Blank ballots | 5,943 | 1.49 | +0.49 | |||
| Total | 397,898 | 100.00 | 7 | ±0 | ||
| Valid votes | 397,898 | 99.34 | –0.08 | |||
| Invalid votes | 2,661 | 0.66 | +0.08 | |||
| Votes cast / turnout | 400,559 | 61.43 | –10.20 | |||
| Abstentions | 251,450 | 38.57 | +10.20 | |||
| Registered voters | 652,009 | |||||
| Source: Ministry of the Interior | ||||||
| ||||||
Basque Country
.png)
| Party | Popular vote | Seats | ||||
|---|---|---|---|---|---|---|
| Votes | % | ±pp | Won | +/− | ||
| Basque Nationalist Party (EAJ/PNV) | 347,417 | 30.38 | +5.34 | 7 | +2 | |
| People's Party (PP) | 323,235 | 28.26 | +9.92 | 7 | +2 | |
| Socialist Party of the Basque Country–Basque Country Left (PSE–EE (PSOE)) | 266,583 | 23.31 | –0.36 | 4 | –1 | |
| Basque Solidarity (EA) | 86,557 | 7.57 | –0.65 | 1 | ±0 | |
| United Left (EB–IU) | 62,293 | 5.45 | –3.76 | 0 | –1 | |
| Parties with less than 1.0% of the vote | 23,234 | 2.03 | — | 0 | –2 | |
|---|---|---|---|---|---|---|
| The Greens (B–LV) | 10,121 | 0.88 | +0.40 | 0 | ±0 | |
| Humanist Party (PH) | 3,058 | 0.27 | +0.19 | 0 | ±0 | |
| Party of the Democratic Karma (PKD) | 2,759 | 0.24 | New | 0 | ±0 | |
| Natural Law Party (PLN) | 2,378 | 0.21 | New | 0 | ±0 | |
| Internationalist Socialist Workers' Party (POSI) | 1,297 | 0.11 | New | 0 | ±0 | |
| Centrist Union–Democratic and Social Centre (UC–CDS) | 709 | 0.06 | –0.01 | 0 | ±0 | |
| Communist Party of the Peoples of Spain (PCPE) | 534 | 0.05 | New | 0 | ±0 | |
| Spain 2000 Platform (ES2000) | 502 | 0.04 | New | 0 | ±0 | |
| Republican Action (AR) | 451 | 0.04 | New | 0 | ±0 | |
| Carlist Party (EKA/PC) | 430 | 0.04 | New | 0 | ±0 | |
| The Falange (FE) | 410 | 0.04 | New | 0 | ±0 | |
| Internationalist Struggle (LI (LIT–CI)) | 331 | 0.03 | New | 0 | ±0 | |
| Independent Spanish Falange–Falange 2000 (FEI–FE 2000) | 254 | 0.02 | +0.01 | 0 | ±0 | |
| Basque Citizens (EH)[lower-alpha 1] | 0 | 0.00 | –12.28 | 0 | –2 | |
| Blank ballots | 34,381 | 3.01 | +1.46 | |||
| Total | 1,143,700 | 100.00 | 19 | ±0 | ||
| Valid votes | 1,143,700 | 98.94 | –0.37 | |||
| Invalid votes | 12,299 | 1.06 | +0.37 | |||
| Votes cast / turnout | 1,155,999 | 63.84 | –7.69 | |||
| Abstentions | 654,667 | 36.16 | +7.69 | |||
| Registered voters | 1,810,666 | |||||
| Source: Ministry of the Interior | ||||||
| ||||||
Canary Islands
.png)
| Party | Popular vote | Seats | ||||
|---|---|---|---|---|---|---|
| Votes | % | ±pp | Won | +/− | ||
| People's Party (PP) | 351,110 | 41.81 | +4.19 | 7 | +2 | |
| Canarian Coalition (CC) | 248,261 | 29.56 | +4.47 | 4 | ±0 | |
| Spanish Socialist Workers' Party–Progressives (PSOE) | 186,363 | 22.19 | –7.78 | 3 | –2 | |
| Canarian United Left (IUC) | 20,214 | 2.41 | –3.07 | 0 | ±0 | |
| Party of Independents from Lanzarote (PIL) | 10,323 | 1.23 | New | 0 | ±0 | |
| The Greens of Canaries (LV) | 10,302 | 1.23 | New | 0 | ±0 | |
| Parties with less than 1.0% of the vote | 6,008 | 0.72 | — | 0 | ±0 | |
|---|---|---|---|---|---|---|
| Communist Party of the Canarian People (PCPC) | 1,408 | 0.17 | +0.04 | 0 | ±0 | |
| Humanist Party (PH) | 1,131 | 0.13 | +0.05 | 0 | ±0 | |
| Centrist Union–Democratic and Social Centre (UC–CDS) | 1,060 | 0.13 | ±0.00 | 0 | ±0 | |
| Progressives of Canaries Unity (UP–CAN) | 980 | 0.12 | New | 0 | ±0 | |
| The Falange (FE) | 809 | 0.10 | New | 0 | ±0 | |
| Canarian Pensionist Tagoror (TPC) | 319 | 0.04 | New | 0 | ±0 | |
| Natural Law Party (PLN) | 301 | 0.04 | New | 0 | ±0 | |
| Blank ballots | 7,233 | 0.86 | +0.29 | |||
| Total | 839,814 | 100.00 | 14 | ±0 | ||
| Valid votes | 839,814 | 99.35 | –0.23 | |||
| Invalid votes | 5,534 | 0.65 | +0.23 | |||
| Votes cast / turnout | 845,348 | 60.67 | –8.47 | |||
| Abstentions | 548,062 | 39.33 | +8.47 | |||
| Registered voters | 1,393,410 | |||||
| Source: Ministry of the Interior | ||||||
Cantabria
.png)
| Party | Popular vote | Seats | ||||
|---|---|---|---|---|---|---|
| Votes | % | ±pp | Won | +/− | ||
| People's Party (PP) | 189,442 | 56.84 | +6.37 | 3 | ±0 | |
| Spanish Socialist Workers' Party–Progressives (PSOE) | 111,556 | 33.47 | –2.14 | 2 | ±0 | |
| United Left (IU) | 16,714 | 5.02 | –6.34 | 0 | ±0 | |
| Parties with less than 1.0% of the vote | 6,830 | 2.05 | — | 0 | ±0 | |
|---|---|---|---|---|---|---|
| Cantabrian Nationalist Council (CNC) | 2,103 | 0.63 | New | 0 | ±0 | |
| Independent Liberal Group (GIL) | 1,343 | 0.40 | New | 0 | ±0 | |
| Centrist Union–Democratic and Social Centre (UC–CDS) | 743 | 0.22 | –0.18 | 0 | ±0 | |
| Natural Law Party (PLN) | 598 | 0.18 | New | 0 | ±0 | |
| Communist Party of the Peoples of Spain (PCPE) | 536 | 0.16 | –0.02 | 0 | ±0 | |
| Humanist Party (PH) | 353 | 0.11 | –0.06 | 0 | ±0 | |
| Internationalist Socialist Workers' Party (POSI) | 328 | 0.10 | New | 0 | ±0 | |
| The Falange (FE) | 293 | 0.09 | New | 0 | ±0 | |
| Independent Spanish Falange–Falange 2000 (FEI–FE 2000) | 194 | 0.06 | New | 0 | ±0 | |
| Spain 2000 Platform (ES2000) | 183 | 0.05 | New | 0 | ±0 | |
| Spanish Democratic Party (PADE) | 156 | 0.05 | New | 0 | ±0 | |
| Blank ballots | 8,726 | 2.62 | +1.02 | |||
| Total | 333,268 | 100.00 | 5 | ±0 | ||
| Valid votes | 333,268 | 99.04 | –0.25 | |||
| Invalid votes | 3,240 | 0.96 | +0.25 | |||
| Votes cast / turnout | 336,508 | 71.81 | –7.50 | |||
| Abstentions | 132,099 | 28.19 | +7.50 | |||
| Registered voters | 468,607 | |||||
| Source: Ministry of the Interior | ||||||
Castile-La Mancha
| Party | Popular vote | Seats | ||||
|---|---|---|---|---|---|---|
| Votes | % | ±pp | Won | +/− | ||
| People's Party (PP) | 563,203 | 52.36 | +5.18 | 12 | +1 | |
| Spanish Socialist Workers' Party–Progressives (PSOE) | 438,630 | 40.78 | –1.84 | 8 | –1 | |
| United Left (IU) | 46,746 | 4.35 | –4.05 | 0 | ±0 | |
| Parties with less than 1.0% of the vote | 12,655 | 1.18 | — | 0 | ±0 | |
|---|---|---|---|---|---|---|
| Independent Liberal Group (GIL) | 2,698 | 0.25 | New | 0 | ±0 | |
| Natural Law Party (PLN) | 1,736 | 0.16 | New | 0 | ±0 | |
| Commoners' Land–Castilian Nationalist Party (TC–PNC) | 1,612 | 0.15 | +0.07 | 0 | ±0 | |
| Centrist Union–Democratic and Social Centre (UC–CDS) | 1,372 | 0.13 | –0.17 | 0 | ±0 | |
| Humanist Party (PH) | 1,262 | 0.12 | +0.03 | 0 | ±0 | |
| The Falange (FE) | 875 | 0.08 | New | 0 | ±0 | |
| The Greens–Green Group (LV–GV) | 605 | 0.06 | New | 0 | ±0 | |
| Spain 2000 Platform (ES2000) | 589 | 0.05 | New | 0 | ±0 | |
| Spanish Democratic Party (PADE) | 573 | 0.05 | New | 0 | ±0 | |
| Regionalist Party of Guadalajara (PRGU) | 400 | 0.04 | +0.01 | 0 | ±0 | |
| Party of Self-employed, Retirees and Independents (EL–PAPI) | 377 | 0.04 | New | 0 | ±0 | |
| Party of Self-employed, Retirees and Widows (PAE) | 268 | 0.02 | New | 0 | ±0 | |
| Independent Spanish Falange–Falange 2000 (FEI–FE 2000) | 130 | 0.01 | New | 0 | ±0 | |
| Carlist Party (PC) | 97 | 0.01 | New | 0 | ±0 | |
| Republican Action (AR) | 61 | 0.01 | New | 0 | ±0 | |
| Blank ballots | 14,328 | 1.33 | +0.43 | |||
| Total | 1,075,571 | 100.00 | 20 | ±0 | ||
| Valid votes | 1,075,571 | 99.20 | –0.17 | |||
| Invalid votes | 8,665 | 0.80 | +0.17 | |||
| Votes cast / turnout | 1,084,236 | 76.31 | –6.78 | |||
| Abstentions | 336,658 | 23.69 | +6.78 | |||
| Registered voters | 1,420,894 | |||||
| Source: Ministry of the Interior | ||||||
Castile and León
| Party | Popular vote | Seats | ||||
|---|---|---|---|---|---|---|
| Votes | % | ±pp | Won | +/− | ||
| People's Party (PP) | 876,670 | 55.68 | +3.48 | 22 | ±0 | |
| Spanish Socialist Workers' Party–Progressives (PSOE) | 506,595 | 32.17 | –2.86 | 11 | ±0 | |
| United Left (IU) | 69,835 | 4.44 | –4.69 | 0 | ±0 | |
| Leonese People's Union (UPL) | 41,690 | 2.65 | +1.93 | 0 | ±0 | |
| Parties with less than 1.0% of the vote | 48,032 | 3.05 | — | 0 | ±0 | |
|---|---|---|---|---|---|---|
| Commoners' Land–Castilian Nationalist Party (TC–PNC) | 15,414 | 0.98 | +0.67 | 0 | ±0 | |
| Regionalist Unity of Castile and León (URCL) | 5,683 | 0.36 | +0.12 | 0 | ±0 | |
| Centrist Union–Democratic and Social Centre (UC–CDS) | 5,353 | 0.34 | –0.10 | 0 | ±0 | |
| Independent Candidacy–Castile and León Party (PCL) | 4,184 | 0.27 | New | 0 | ±0 | |
| Natural Law Party (PLN) | 2,618 | 0.17 | New | 0 | ±0 | |
| Zamoran People's Union (UPZ) | 2,347 | 0.15 | New | 0 | ±0 | |
| Regionalist Party of the Leonese Country (PREPAL) | 2,118 | 0.13 | +0.01 | 0 | ±0 | |
| Humanist Party (PH) | 1,592 | 0.10 | +0.01 | 0 | ±0 | |
| Independent Salamancan Union (USI) | 1,416 | 0.09 | New | 0 | ±0 | |
| The Falange (FE) | 1,348 | 0.09 | New | 0 | ±0 | |
| El Bierzo Party (PB) | 1,191 | 0.08 | +0.02 | 0 | ±0 | |
| Spanish Democratic Party (PADE) | 1,156 | 0.07 | New | 0 | ±0 | |
| The Greens–Green Group (LV–GV) | 1,143 | 0.07 | +0.02 | 0 | ±0 | |
| Communist Party of the Peoples of Spain (PCPE) | 876 | 0.06 | +0.03 | 0 | ±0 | |
| Spain 2000 Platform (ES2000) | 711 | 0.05 | New | 0 | ±0 | |
| Independent Spanish Falange–Falange 2000 (FEI–FE 2000) | 557 | 0.04 | New | 0 | ±0 | |
| Cives (Cives) | 206 | 0.01 | New | 0 | ±0 | |
| Carlist Party (PC) | 119 | 0.01 | New | 0 | ±0 | |
| Blank ballots | 31,679 | 2.01 | +0.66 | |||
| Total | 1,574,501 | 100.00 | 33 | ±0 | ||
| Valid votes | 1,574,501 | 99.22 | –0.16 | |||
| Invalid votes | 12,449 | 0.78 | +0.16 | |||
| Votes cast / turnout | 1,586,950 | 72.57 | –6.44 | |||
| Abstentions | 599,709 | 27.43 | +6.44 | |||
| Registered voters | 2,186,659 | |||||
| Source: Ministry of the Interior | ||||||
Catalonia
| Party | Popular vote | Seats | ||||
|---|---|---|---|---|---|---|
| Votes | % | ±pp | Won | +/− | ||
| Socialists' Party of Catalonia (PSC–PSOE) | 1,150,533 | 34.13 | –5.23 | 17 | –2 | |
| Convergence and Union (CiU) | 970,421 | 28.79 | –0.82 | 15 | –1 | |
| People's Party (PP) | 768,318 | 22.79 | +4.83 | 12 | +4 | |
| Republican Left of Catalonia (ERC) | 190,292 | 5.64 | +1.46 | 1 | ±0 | |
| Initiative for Catalonia–Greens (IC–V) | 119,290 | 3.54 | –4.10 | 1 | –1 | |
| United and Alternative Left (EUiA) | 75,091 | 2.23 | New | 0 | ±0 | |
| Parties with less than 1.0% of the vote | 49,801 | 1.48 | — | 0 | ±0 | |
|---|---|---|---|---|---|---|
| The Greens–Green Group (EV–GV) | 14,922 | 0.44 | New | 0 | ±0 | |
| The Greens–Green Alternative (EV–AV) | 11,579 | 0.34 | New | 0 | ±0 | |
| Internationalist Socialist Workers' Party (POSI) | 4,751 | 0.14 | New | 0 | ±0 | |
| Independent Liberal Group (GIL) | 3,002 | 0.09 | New | 0 | ±0 | |
| Catalan State (EC) | 2,321 | 0.07 | New | 0 | ±0 | |
| Centrist Union–Democratic and Social Centre (UC–CDS) | 1,980 | 0.06 | –0.01 | 0 | ±0 | |
| Humanist Party (PH) | 1,820 | 0.05 | +0.01 | 0 | ±0 | |
| Republican Left–Left Republican Party (IR–PRE) | 1,541 | 0.05 | New | 0 | ±0 | |
| Natural Law Party (PLN) | 1,474 | 0.04 | New | 0 | ±0 | |
| The Falange (FE) | 1,371 | 0.04 | New | 0 | ±0 | |
| Caló Nationalist Party (PNCA) | 1,142 | 0.03 | New | 0 | ±0 | |
| Spain 2000 Platform (ES2000) | 855 | 0.03 | New | 0 | ±0 | |
| Independent Spanish Falange–Falange 2000 (FEI–FE 2000) | 826 | 0.02 | New | 0 | ±0 | |
| Internationalist Struggle (LI (LIT–CI)) | 816 | 0.02 | New | 0 | ±0 | |
| European National State (N) | 710 | 0.02 | +0.01 | 0 | ±0 | |
| Spanish Democratic Party (PADE) | 606 | 0.02 | New | 0 | ±0 | |
| Democratic Party of the People (PDEP) | 85 | 0.00 | New | 0 | ±0 | |
| Blank ballots | 47,526 | 1.41 | +0.75 | |||
| Total | 3,371,272 | 100.00 | 46 | ±0 | ||
| Valid votes | 3,371,272 | 99.50 | –0.17 | |||
| Invalid votes | 16,856 | 0.50 | +0.17 | |||
| Votes cast / turnout | 3,388,128 | 64.01 | –12.51 | |||
| Abstentions | 1,905,337 | 35.99 | +12.51 | |||
| Registered voters | 5,293,465 | |||||
| Source: Ministry of the Interior | ||||||
Extremadura
| Party | Popular vote | Seats | ||||
|---|---|---|---|---|---|---|
| Votes | % | ±pp | Won | +/− | ||
| People's Party (PP) | 310,850 | 47.30 | +7.02 | 6 | +1 | |
| Spanish Socialist Workers' Party–Progressives (PSOE) | 293,831 | 44.71 | –3.72 | 5 | –1 | |
| United Left (IU) | 30,865 | 4.70 | –4.20 | 0 | ±0 | |
| Parties with less than 1.0% of the vote | 13,997 | 2.13 | — | 0 | ±0 | |
|---|---|---|---|---|---|---|
| United Extremadura (EU) | 4,771 | 0.73 | New | 0 | ±0 | |
| The Greens of Extremadura (LV) | 3,417 | 0.52 | New | 0 | ±0 | |
| Extremaduran Coalition (CREx–PREx) | 2,371 | 0.36 | –0.68 | 0 | ±0 | |
| Independent Socialists of Extremadura (SIEx) | 1,412 | 0.21 | –0.03 | 0 | ±0 | |
| Centrist Union–Democratic and Social Centre (UC–CDS) | 525 | 0.08 | –0.06 | 0 | ±0 | |
| The Falange (FE) | 461 | 0.07 | New | 0 | ±0 | |
| Natural Law Party (PLN) | 326 | 0.05 | New | 0 | ±0 | |
| Humanist Party (PH) | 198 | 0.03 | +0.01 | 0 | ±0 | |
| Spain 2000 Platform (ES2000) | 191 | 0.03 | New | 0 | ±0 | |
| Spanish Democratic Party (PADE) | 188 | 0.03 | New | 0 | ±0 | |
| Independent Spanish Falange–Falange 2000 (FEI–FE 2000) | 137 | 0.02 | –0.01 | 0 | ±0 | |
| Blank ballots | 7,605 | 1.16 | +0.44 | |||
| Total | 657,148 | 100.00 | 11 | ±0 | ||
| Valid votes | 657,148 | 99.21 | –0.36 | |||
| Invalid votes | 5,245 | 0.79 | +0.36 | |||
| Votes cast / turnout | 662,393 | 75.42 | –6.91 | |||
| Abstentions | 215,899 | 24.58 | +6.91 | |||
| Registered voters | 878,292 | |||||
| Source: Ministry of the Interior | ||||||
Galicia
.png)
| Party | Popular vote | Seats | ||||
|---|---|---|---|---|---|---|
| Votes | % | ±pp | Won | +/− | ||
| People's Party (PP) | 888,092 | 53.99 | +5.68 | 16 | +2 | |
| Socialists' Party of Galicia–Progressives (PSdeG–PSOE) | 389,999 | 23.71 | –9.83 | 6 | –3 | |
| Galician Nationalist Bloc (BNG) | 306,268 | 18.62 | +5.77 | 3 | +1 | |
| United Left (EU–IU) | 21,127 | 1.28 | –2.35 | 0 | ±0 | |
| Parties with less than 1.0% of the vote | 17,849 | 1.09 | — | 0 | ±0 | |
|---|---|---|---|---|---|---|
| Party of Self-employed and Professionals (AUTONOMO) | 3,182 | 0.19 | New | 0 | ±0 | |
| Galician Democracy (DG) | 2,958 | 0.18 | New | 0 | ±0 | |
| Galician Coalition (CG) | 2,361 | 0.14 | New | 0 | ±0 | |
| Galician People's Front (FPG) | 2,252 | 0.14 | +0.02 | 0 | ±0 | |
| Humanist Party (PH) | 1,911 | 0.12 | +0.04 | 0 | ±0 | |
| Centrist Union–Democratic and Social Centre (UC–CDS) | 1,724 | 0.10 | –0.05 | 0 | ±0 | |
| Spain 2000 Platform (ES2000) | 929 | 0.06 | New | 0 | ±0 | |
| The Falange (FE) | 893 | 0.05 | New | 0 | ±0 | |
| Natural Law Party (PLN) | 716 | 0.04 | New | 0 | ±0 | |
| Spanish Democratic Party (PADE) | 594 | 0.04 | New | 0 | ±0 | |
| Independent Spanish Falange–Falange 2000 (FEI–FE 2000) | 329 | 0.02 | New | 0 | ±0 | |
| Blank ballots | 21,703 | 1.32 | +0.40 | |||
| Total | 1,645,045 | 100.00 | 25 | ±0 | ||
| Valid votes | 1,645,045 | 99.30 | –0.05 | |||
| Invalid votes | 11,617 | 0.70 | +0.05 | |||
| Votes cast / turnout | 1,656,662 | 65.02 | –6.38 | |||
| Abstentions | 891,119 | 34.98 | +6.38 | |||
| Registered voters | 2,547,781 | |||||
| Source: Ministry of the Interior | ||||||
La Rioja
| Party | Popular vote | Seats | ||||
|---|---|---|---|---|---|---|
| Votes | % | ±pp | Won | +/− | ||
| People's Party (PP) | 91,810 | 54.10 | +4.69 | 3 | +1 | |
| Spanish Socialist Workers' Party–Progressives (PSOE) | 59,171 | 34.87 | –1.78 | 1 | –1 | |
| United Left (IU) | 6,830 | 4.02 | –4.69 | 0 | ±0 | |
| Riojan Party (PR) | 6,155 | 3.63 | +0.23 | 0 | ±0 | |
| The Greens (LV) | 1,709 | 1.01 | New | 0 | ±0 | |
| Parties with less than 1.0% of the vote | 755 | 0.44 | — | 0 | ±0 | |
|---|---|---|---|---|---|---|
| Spanish Democratic Party (PADE) | 139 | 0.08 | New | 0 | ±0 | |
| Centrist Union–Democratic and Social Centre (UC–CDS) | 131 | 0.08 | –0.18 | 0 | ±0 | |
| Movement for Humanist Socialism (MASH) | 121 | 0.07 | New | 0 | ±0 | |
| The Falange (FE) | 104 | 0.06 | New | 0 | ±0 | |
| Humanist Party (PH) | 79 | 0.05 | New | 0 | ±0 | |
| Natural Law Party (PLN) | 79 | 0.05 | New | 0 | ±0 | |
| Carlist Party (PC) | 56 | 0.03 | New | 0 | ±0 | |
| Spain 2000 Platform (ES2000) | 46 | 0.03 | New | 0 | ±0 | |
| Blank ballots | 3,265 | 1.92 | +0.45 | |||
| Total | 169,695 | 100.00 | 4 | ±0 | ||
| Valid votes | 169,695 | 99.24 | –0.16 | |||
| Invalid votes | 1,302 | 0.76 | +0.16 | |||
| Votes cast / turnout | 170,997 | 74.21 | –6.71 | |||
| Abstentions | 59,430 | 25.79 | +6.71 | |||
| Registered voters | 230,427 | |||||
| Source: Ministry of the Interior | ||||||
Madrid
.png)
| Party | Popular vote | Seats | ||||
|---|---|---|---|---|---|---|
| Votes | % | ±pp | Won | +/− | ||
| People's Party (PP) | 1,625,831 | 52.52 | +3.23 | 19 | +2 | |
| Spanish Socialist Workers' Party–Progressives (PSOE) | 1,023,212 | 33.06 | +1.64 | 12 | +1 | |
| United Left of the Madrid Community (IUCM) | 282,180 | 9.12 | –7.32 | 3 | –3 | |
| Independent Liberal Group (GIL) | 32,432 | 1.05 | New | 0 | ±0 | |
| Parties with less than 1.0% of the vote | 73,698 | 2.38 | — | 0 | ±0 | |
|---|---|---|---|---|---|---|
| The Greens (LV) | 24,372 | 0.79 | +0.63 | 0 | ±0 | |
| The Greens of the Madrid Community (LVCM) | 21,087 | 0.68 | +0.43 | 0 | ±0 | |
| Centrist Union–Democratic and Social Centre (UC–CDS) | 3,557 | 0.11 | –0.26 | 0 | ±0 | |
| Communist Party of the Peoples of Spain (PCPE) | 2,836 | 0.09 | +0.04 | 0 | ±0 | |
| Party of Self-employed, Retirees and Independents (EL–PAPI) | 2,336 | 0.08 | New | 0 | ±0 | |
| Humanist Party (PH) | 2,050 | 0.07 | +0.03 | 0 | ±0 | |
| The Falange (FE) | 1,955 | 0.06 | New | 0 | ±0 | |
| Internationalist Socialist Workers' Party (POSI) | 1,757 | 0.06 | New | 0 | ±0 | |
| Party Association of Widows and Legal Wives (PAVIEL) | 1,690 | 0.05 | New | 0 | ±0 | |
| Independent Spanish Falange–Falange 2000 (FEI–FE 2000) | 1,469 | 0.05 | +0.02 | 0 | ±0 | |
| Madrilenian Independent Regional Party (PRIM) | 1,363 | 0.04 | –0.01 | 0 | ±0 | |
| Spanish Democratic Party (PADE) | 1,306 | 0.04 | New | 0 | ±0 | |
| Commoners' Land–Castilian Nationalist Party (TC–PNC) | 1,264 | 0.04 | New | 0 | ±0 | |
| Natural Law Party (PLN) | 1,263 | 0.04 | New | 0 | ±0 | |
| Party of Self-employed, Retirees and Widows (PAE) | 1,194 | 0.04 | New | 0 | ±0 | |
| Republican Action (AR) | 1,089 | 0.04 | +0.02 | 0 | ±0 | |
| Spain 2000 Platform (ES2000) | 773 | 0.02 | New | 0 | ±0 | |
| Liberal and Social Democratic Coalition (CSD–L) | 650 | 0.02 | New | 0 | ±0 | |
| Federal Progresists (PF) | 609 | 0.02 | New | 0 | ±0 | |
| Iberian Union (UNIB) | 388 | 0.01 | New | 0 | ±0 | |
| Carlist Party (PC) | 384 | 0.01 | New | 0 | ±0 | |
| Internationalist Struggle (LI (LIT–CI)) | 306 | 0.01 | New | 0 | ±0 | |
| Blank ballots | 58,114 | 1.88 | +0.62 | |||
| Total | 3,095,467 | 100.00 | 34 | ±0 | ||
| Valid votes | 3,095,467 | 99.48 | –0.20 | |||
| Invalid votes | 16,195 | 0.52 | +0.20 | |||
| Votes cast / turnout | 3,111,662 | 72.08 | –7.51 | |||
| Abstentions | 1,205,484 | 27.92 | +7.51 | |||
| Registered voters | 4,317,146 | |||||
| Source: Ministry of the Interior | ||||||
Murcia
.png)
| Party | Popular vote | Seats | ||||
|---|---|---|---|---|---|---|
| Votes | % | ±pp | Won | +/− | ||
| People's Party (PP) | 389,564 | 58.08 | +8.19 | 6 | +1 | |
| Spanish Socialist Workers' Party–Progressives (PSOE) | 217,179 | 32.38 | –5.61 | 3 | ±0 | |
| United Left (IU) | 41,842 | 6.24 | –4.29 | 0 | –1 | |
| Parties with less than 1.0% of the vote | 14,914 | 2.22 | — | 0 | ±0 | |
|---|---|---|---|---|---|---|
| The Greens of the Region of Murcia (LVRM) | 6,555 | 0.98 | New | 0 | ±0 | |
| Independent Liberal Group (GIL) | 2,362 | 0.35 | New | 0 | ±0 | |
| Spanish Democratic Party (PADE) | 1,389 | 0.21 | New | 0 | ±0 | |
| Self-employed Spanish Party (PEDA) | 1,130 | 0.17 | New | 0 | ±0 | |
| Citizens Convergence of the South-East (CCSE) | 645 | 0.10 | ±0.00 | 0 | ±0 | |
| Centrist Union–Democratic and Social Centre (UC–CDS) | 635 | 0.09 | –0.18 | 0 | ±0 | |
| The Falange (FE) | 604 | 0.09 | New | 0 | ±0 | |
| New Region (NR) | 598 | 0.09 | –0.12 | 0 | ±0 | |
| Natural Law Party (PLN) | 410 | 0.06 | New | 0 | ±0 | |
| Spain 2000 Platform (ES2000) | 383 | 0.06 | New | 0 | ±0 | |
| Catalan State (EC) | 203 | 0.03 | New | 0 | ±0 | |
| Blank ballots | 7,185 | 1.07 | +0.28 | |||
| Total | 670,684 | 100.00 | 9 | ±0 | ||
| Valid votes | 670,684 | 99.43 | –0.11 | |||
| Invalid votes | 3,832 | 0.57 | +0.11 | |||
| Votes cast / turnout | 674,516 | 73.54 | –8.46 | |||
| Abstentions | 242,701 | 26.46 | +8.46 | |||
| Registered voters | 917,217 | |||||
| Source: Ministry of the Interior | ||||||
Navarre
.png)
| Party | Popular vote | Seats | ||||
|---|---|---|---|---|---|---|
| Votes | % | ±pp | Won | +/− | ||
| Navarrese People's Union–People's Party (UPN–PP) | 150,995 | 49.89 | +12.77 | 3 | +1 | |
| Spanish Socialist Workers' Party–Progressives (PSOE) | 82,688 | 27.32 | –2.94 | 2 | ±0 | |
| United Left of Navarre (IUN–NEB) | 23,038 | 7.61 | –4.84 | 0 | –1 | |
| Basque Solidarity (EA) | 14,185 | 4.69 | +0.92 | 0 | ±0 | |
| Democrats' Convergence of Navarre (CDN) | 8,646 | 2.86 | –2.39 | 0 | ±0 | |
| Basque Nationalist Party (EAJ/PNV) | 6,536 | 2.16 | +1.19 | 0 | ±0 | |
| Parties with less than 1.0% of the vote | 4,653 | 1.54 | — | 0 | ±0 | |
|---|---|---|---|---|---|---|
| Natural Law Party (PLN) | 1,366 | 0.45 | New | 0 | ±0 | |
| Humanist Party (PH) | 970 | 0.32 | +0.03 | 0 | ±0 | |
| Carlist Party (PC) | 650 | 0.21 | New | 0 | ±0 | |
| Centrist Union–Democratic and Social Centre (UC–CDS) | 529 | 0.17 | +0.06 | 0 | ±0 | |
| The Falange (FE) | 455 | 0.15 | New | 0 | ±0 | |
| Spain 2000 Platform (ES2000) | 267 | 0.09 | New | 0 | ±0 | |
| Internationalist Struggle (LI (LIT–CI)) | 263 | 0.09 | New | 0 | ±0 | |
| Independent Spanish Falange–Falange 2000 (FEI–FE 2000) | 153 | 0.05 | New | 0 | ±0 | |
| Basque Citizens (EH)[lower-alpha 1] | 0 | 0.00 | –8.16 | 0 | ±0 | |
| Blank ballots | 11,945 | 3.95 | +2.26 | |||
| Total | 302,686 | 100.00 | 5 | ±0 | ||
| Valid votes | 302,686 | 98.76 | –0.62 | |||
| Invalid votes | 3,808 | 1.24 | +0.62 | |||
| Votes cast / turnout | 306,494 | 66.07 | –7.38 | |||
| Abstentions | 157,398 | 33.93 | +7.38 | |||
| Registered voters | 463,892 | |||||
| Source: Ministry of the Interior | ||||||
| ||||||
Valencian Community
| Party | Popular vote | Seats | ||||
|---|---|---|---|---|---|---|
| Votes | % | ±pp | Won | +/− | ||
| People's Party (PP) | 1,267,062 | 52.11 | +8.38 | 19 | +4 | |
| Spanish Socialist Workers' Party–Progressives (PSOE) | 826,595 | 34.00 | –4.32 | 12 | –1 | |
| United Left of the Valencian Country (EUPV) | 141,404 | 5.82 | –5.26 | 1 | –2 | |
| Valencian Nationalist Bloc–The Greens–Valencians for Change (BNV–EV)[lower-alpha 1] | 58,551 | 2.41 | +1.37 | 0 | ±0 | |
| Valencian Union (UV) | 57,830 | 2.38 | –1.16 | 0 | –1 | |
| Parties with less than 1.0% of the vote | 50,795 | 2.09 | — | 0 | ±0 | |
|---|---|---|---|---|---|---|
| The Greens Ecopacifists (LVE) | 22,220 | 0.91 | New | 0 | ±0 | |
| Independent Liberal Group (GIL) | 5,444 | 0.22 | New | 0 | ±0 | |
| Communist Party of the Peoples of Spain (PCPE) | 3,149 | 0.13 | –0.02 | 0 | ±0 | |
| Front for the Valencian Country–Republican Left of Catalonia (Front–ERC) | 3,083 | 0.13 | ±0.00 | 0 | ±0 | |
| Internationalist Socialist Workers' Party (POSI) | 2,731 | 0.11 | New | 0 | ±0 | |
| Centrist Union–Democratic and Social Centre (UC–CDS) | 1,960 | 0.08 | –0.05 | 0 | ±0 | |
| Spain 2000 Platform (ES2000) | 1,516 | 0.06 | New | 0 | ±0 | |
| The Falange (FE) | 1,435 | 0.06 | New | 0 | ±0 | |
| Humanist Party (PH) | 1,385 | 0.06 | +0.02 | 0 | ±0 | |
| Spanish Democratic Party (PADE) | 1,233 | 0.05 | New | 0 | ±0 | |
| Natural Law Party (PLN) | 1,015 | 0.04 | New | 0 | ±0 | |
| Republican Action (AR) | 954 | 0.04 | +0.03 | 0 | ±0 | |
| Valencian Nationalist Left (ENV) | 920 | 0.04 | ±0.00 | 0 | ±0 | |
| Independent Spanish Falange–Falange 2000 (FEI–FE 2000) | 784 | 0.03 | New | 0 | ±0 | |
| Self-employed Spanish Party (PEDA) | 774 | 0.03 | New | 0 | ±0 | |
| Catalan State (EC) | 501 | 0.02 | New | 0 | ±0 | |
| Independent Initiative (II) | 425 | 0.02 | New | 0 | ±0 | |
| Carlist Party (PC) | 395 | 0.02 | New | 0 | ±0 | |
| New Force (FN) | 343 | 0.01 | New | 0 | ±0 | |
| Social and Autonomist Liberal Group (ALAS) | 339 | 0.01 | –0.01 | 0 | ±0 | |
| Caló Nationalist Party (PNCA) | 189 | 0.01 | New | 0 | ±0 | |
| Blank ballots | 29,198 | 1.20 | +0.40 | |||
| Total | 2,431,435 | 100.00 | 32 | ±0 | ||
| Valid votes | 2,431,435 | 99.35 | –0.14 | |||
| Invalid votes | 15,946 | 0.65 | +0.14 | |||
| Votes cast / turnout | 2,447,381 | 72.70 | –8.96 | |||
| Abstentions | 918,829 | 27.30 | +8.96 | |||
| Registered voters | 3,366,210 | |||||
| Source: Ministry of the Interior | ||||||
| ||||||
Autonomous cities
Ceuta
| Party | Popular vote | Seats | ||||
|---|---|---|---|---|---|---|
| Votes | % | ±pp | Won | +/− | ||
| People's Party (PP) | 14,514 | 47.59 | –5.62 | 1 | ±0 | |
| Independent Liberal Group (GIL) | 8,758 | 28.71 | New | 0 | ±0 | |
| Spanish Socialist Workers' Party–Progressives (PSOE) | 5,491 | 18.00 | –17.79 | 0 | ±0 | |
| Socialist Party of the People of Ceuta (PSPC) | 788 | 2.58 | –4.70 | 0 | ±0 | |
| Parties with less than 1.0% of the vote | 453 | 1.49 | — | 0 | ±0 | |
|---|---|---|---|---|---|---|
| United Left (IU) | 229 | 0.75 | –1.46 | 0 | ±0 | |
| The Falange (FE) | 93 | 0.30 | New | 0 | ±0 | |
| Natural Law Party (PLN) | 76 | 0.25 | New | 0 | ±0 | |
| Democratic and Social Centre–Centrist Union (CDS–UC) | 31 | 0.10 | New | 0 | ±0 | |
| Spanish Democratic Party (PADE) | 24 | 0.08 | New | 0 | ±0 | |
| Blank ballots | 497 | 1.63 | +0.41 | |||
| Total | 30,501 | 100.00 | 1 | ±0 | ||
| Valid votes | 30,501 | 99.03 | +0.23 | |||
| Invalid votes | 300 | 0.97 | –0.23 | |||
| Votes cast / turnout | 30,801 | 55.15 | –8.66 | |||
| Abstentions | 25,047 | 44.85 | +8.66 | |||
| Registered voters | 55,848 | |||||
| Source: Ministry of the Interior | ||||||
Melilla
| Party | Popular vote | Seats | ||||
|---|---|---|---|---|---|---|
| Votes | % | ±pp | Won | +/− | ||
| People's Party–Melillense People's Union (PP–UPM) | 13,078 | 49.80 | –0.77 | 1 | ±0 | |
| Melilla's Localist Bloc (BLM) | 6,514 | 24.81 | New | 0 | ±0 | |
| Spanish Socialist Workers' Party–Progressives (PSOE) | 5,363 | 20.42 | –22.90 | 0 | ±0 | |
| United Left (IU) | 397 | 1.51 | –1.97 | 0 | ±0 | |
| Parties with less than 1.0% of the vote | 356 | 1.36 | — | 0 | ±0 | |
|---|---|---|---|---|---|---|
| The Greens–Green Group (LV–GV) | 174 | 0.66 | New | 0 | ±0 | |
| Nationalist Aprome (Aprome) | 60 | 0.23 | –0.50 | 0 | ±0 | |
| The Falange (FE) | 48 | 0.18 | New | 0 | ±0 | |
| Independent Spanish Falange–Falange 2000 (FEI–FE 2000) | 38 | 0.14 | +0.02 | 0 | ±0 | |
| Natural Law Party (PLN) | 23 | 0.09 | New | 0 | ±0 | |
| Spanish Democratic Party (PADE) | 13 | 0.05 | New | 0 | ±0 | |
| Blank ballots | 551 | 2.10 | +0.48 | |||
| Total | 26,259 | 100.00 | 1 | ±0 | ||
| Valid votes | 26,259 | 99.28 | +0.19 | |||
| Invalid votes | 191 | 0.72 | –0.19 | |||
| Votes cast / turnout | 26,450 | 54.00 | –7.95 | |||
| Abstentions | 22,535 | 46.00 | +7.95 | |||
| Registered voters | 48,985 | |||||
| Source: Ministry of the Interior | ||||||
| General elections |
|
|---|---|
| European elections | |
| Local elections | |
| Regional elections | |
| Referendums | |
| |
This article is issued from Wikipedia - version of the 12/4/2016. The text is available under the Creative Commons Attribution/Share Alike but additional terms may apply for the media files.