Valencian parliamentary election, 2011
.svg.png)
|
|
|
|
All 99 seats in the Valencian Courts
50 seats needed for a majority |
| Opinion polls |
| Registered |
3,549,687  1.7% 1.7% |
| Turnout |
2,491,588 (70.2%)
0.1 pp |
| |
First party |
Second party |
| |
_(Recortada).jpg) |
.jpg) |
| Leader |
Francisco Camps |
Jorge Alarte |
| Party |
PP |
PSOE |
| Leader since |
10 July 2002 |
28 September 2008 |
| Last election |
54 seats, 52.5% |
38 seats, 34.5% |
| Seats won |
55 |
33 |
| Seat change |
1 |
 5 5 |
| Popular vote |
1,211,112 |
687,141 |
| Percentage |
49.4% |
28.0% |
| Swing |
3.1 pp |
6.5 pp |
|
| |
Third party |
Fourth party |
| |
 |
.jpg) |
| Leader |
Enric Morera |
Marga Sanz |
| Party |
Compromís |
IU |
| Leader since |
25 January 2010 |
8 March 2009 |
| Last election |
Did not contest |
7 seats, 8.0%[lower-alpha 1] |
| Seats won |
6 |
5 |
| Seat change |
6 |
2 |
| Popular vote |
176,213 |
144,703 |
| Percentage |
7.2% |
5.9% |
| Swing |
New party |
2.1 pp |
|
|
|
The 2011 Valencian parliamentary election was held on Sunday, 22 May, to elect the 8th democratically-elected Valencian Courts, the regional legislature of the Spanish autonomous community of Valencia. At stake were all 99 seats in the Courts, determining the President of the Valencian Government.
The election was won by the People's Party (PP), which increased its majority despite a drop in its vote share. The Spanish Socialist Workers' Party (PSOE) continued its long term decline in the area and, in line with what happened in other regions, obtained one of its worst electoral results since the autonomous community's inception. On the other hand, the electoral alliance between United Left of the Valencian Country (EUPV) and the Valencian Nationalist Bloc (BNV) which stood in the 2007 election had dissolved, with both parties entering the legislature much at the expense of the declining PSOE.
As a result of the election, Francisco Camps was elected President for a third term in office. However, he resigned just two months into his term in July 2011, being succeeded by Alberto Fabra, who would remain in the post for the remainder of the legislature.
Electoral system
The number of seats in the Valencian Courts was set to a fixed-number of 99. All Courts members were elected in 3 multi-member districts, corresponding to the Valencian Community's three provinces, using the D'Hondt method and a closed-list proportional representation system. Each district was entitled to an initial minimum of 20 seats, with the remaining 39 seats allocated among the three provinces in proportion to their populations, on the required condition that the number of inhabitants per seat in each district did not exceed 3 times those of any other. For the 2011 election, seats were distributed as follows: Alicante (35), Castellon (24) and Valencia (40).
Voting was on the basis of universal suffrage in a secret ballot. Only lists polling above 5% of valid votes in all of the community (which include blank ballots—for none of the above) were entitled to enter the seat distribution. This meant that in the case a list polled above 5% in one or more of the districts but below 5% in the community totals, it would remain outside of the seat apportionment.[1]
Opinion polls
Vote
Poll results are listed in the table below in reverse chronological order, showing the most recent first. The highest percentage figure in each polling survey is displayed in bold, and the background shaded in the leading party's colour. In the instance that there is a tie, then no figure is shaded. The lead column on the right shows the percentage-point difference between the two parties with the highest figures. Poll results use the date the survey's fieldwork was done, as opposed to the date of publication. However, if such date is unknown, the date of publication will be given instead.
Seat projections
Opinion polls showing seat projections are displayed in the table below. The highest seat figures in each polling survey have their background shaded in the leading party's colour. In the instance that there is a tie, then no figure is shaded. 50 seats were required for an absolute majority in the Valencian Courts.
50 seats needed for majority
| Date |
Polling Firm/Source |
PP |
PSPV |
EUPV |
C |
UPyD |
Others |
|
|
|
|
|
| 22 May 2011 |
Regional Election |
55 |
33 |
5 |
6 |
0 |
0 |
| 22 May |
Ipsos-Eco |
56−59 |
29−32 |
5−6 |
5−6 |
0 |
0 |
| Exit polls |
| 10–11 May |
TNS-Demoscopia |
56−58 |
32−34 |
9 |
0 |
0 |
0 |
| 9–10 May |
Metroscopia |
59 |
33 |
7 |
0 |
0 |
0 |
| 26 Apr–3 May |
GAD |
58 |
35 |
6 |
0 |
0 |
0 |
| 19–26 Apr |
Ikerfel |
58−60 |
34−36 |
3−5 |
0 |
0 |
0 |
| 13–20 Apr |
Celeste-Tel |
57 |
33 |
5 |
4 |
0 |
0 |
| 17 Mar–17 Apr |
CIS |
60 |
33 |
6 |
0 |
0 |
0 |
| 13–14 Apr |
GAD |
57−59 |
33−35 |
6−7 |
0 |
0 |
0 |
| 11–14 Apr |
Sigma-2 |
56−59 |
36−39 |
4 |
0 |
0 |
0 |
| 4–7 Apr |
Obradoiro |
55 |
35 |
5 |
4 |
0 |
0 |
| 7–15 Mar |
GAD |
60 |
33 |
6 |
0 |
0 |
0 |
| 2011 |
| 17–21 Dec |
Sigma-2 |
63−65 |
29−32 |
4−5 |
0 |
0 |
0 |
| 5–15 Oct |
PSPV |
60 |
35 |
4 |
0 |
0 |
0 |
| 5–6 Oct |
Metroscopia |
60 |
33 |
6 |
0 |
0 |
0 |
| 20 Sep–6 Oct |
PP |
57−58 |
33−34 |
8 |
0 |
0 |
0 |
| 6–10 Sep |
AC |
57 |
36 |
6 |
0 |
0 |
0 |
| 19–23 Jul |
PP |
57−58 |
34−35 |
7 |
0 |
0 |
0 |
| 24–27 May |
Sigma-2 |
59−64 |
30−33 |
4−6 |
0 |
0 |
0 |
| 21 May |
PSPV |
58 |
35 |
6 |
0 |
0 |
0 |
| 6–29 Apr |
PP |
57−58 |
35−36 |
6 |
0 |
0 |
0 |
| 4 Apr |
Obradoiro |
57−58 |
35−36 |
6 |
0 |
0 |
0 |
| 2010 |
| 10–16 Dec |
PP |
57 |
36 |
6 |
0 |
0 |
0 |
| 9 Oct |
Metroscopia |
61 |
36 |
2 |
0 |
0 |
0 |
| 1–12 Sep |
PP |
57 |
36 |
6 |
0 |
0 |
0 |
| 10 May |
PSPV |
57 |
38 |
4 |
0 |
0 |
0 |
| 2009 |
| 2008 |
| 27 May 2007 |
Regional Election |
54 |
38 |
7 |
w.EUPV |
|
0 |
Results
Overall
← Summary of the 22 May 2011 Valencian Courts election results →
| |
| Party |
Vote |
Seats |
| Votes |
% |
±pp |
Won |
+/− |
|
People's Party (PP) |
1,211,112 | 49.42 | 3.10 |
55 | 1 |
|
Socialist Party of the Valencian Country (PSPV-PSOE) |
687,141 | 28.04 | 6.45 |
33 | 5 |
|
Commitment Coalition (Compromís) |
176,213 | 7.19 | New |
6 | 6 |
|
United Left of the Valencian Country (EUPV)[lower-alpha 1] |
144,703 | 5.90 | 2.12 |
5 | 2 |
| |
|
Union, Progress and Democracy (UPyD) |
60,859 | 2.48 | New |
0 | ±0 |
|
Greens and Ecopacifists (VyE) |
31,808 | 1.30 | New |
0 | ±0 |
|
Spain 2000 (E-2000) |
12,191 | 0.50 | 0.26 |
0 | ±0 |
|
Republican Left of the Valencian Country (ERPV) |
11,129 | 0.45 | 0.03 |
0 | ±0 |
|
Anti-Bullfighting Party Against Mistreatment of Animals (PACMA) |
9,306 | 0.38 | New |
0 | ±0 |
|
Valencian Coalition (CVa) |
9,183 | 0.37 | 0.34 |
0 | ±0 |
|
Liberal Democratic Centre (CDL) |
8,203 | 0.33 | 0.30 |
0 | ±0 |
|
Citizens for Blank Votes (CenB) |
4,222 | 0.17 | New |
0 | ±0 |
|
United for Valencia (UxV) |
3,637 | 0.15 | 0.04 |
0 | ±0 |
|
Communist Party of the Peoples of Spain (PCPE) |
3,456 | 0.14 | 0.03 |
0 | ±0 |
|
Humanist Party (PH) |
2,566 | 0.10 | 0.02 |
0 | ±0 |
|
Renewal Liberal Centre (CLR) |
2,463 | 0.10 | 0.04 |
0 | ±0 |
|
Blank ballots |
60,670 | 2.48 | 1.07 |
|
| |
| Total |
2,450,872 | 100.00 | |
99 | ±0 |
| |
| Valid votes |
2,450,872 | 98.37 | 0.96 |
|
| Invalid votes |
40,716 | 1.63 | 0.96 |
| Votes cast / turnout |
2,491,588 | 70.19 | 0.05 |
| Abstentions |
1,058,099 | 29.81 | 0.05 |
| Registered voters |
3,549,687 | |
| |
| Source(s):
|
| Vote share |
|---|
|
|
|
|
|
| PP |
|
49.42% |
| PSPV-PSOE |
|
28.04% |
| Compromís |
|
7.19% |
| EUPV |
|
5.90% |
| UPyD |
|
2.48% |
| VyE |
|
1.30% |
| Others |
|
3.19% |
| Blank ballots |
|
2.48% |
| Parliamentary seats |
|---|
|
|
|
|
|
| PP |
|
55.56% |
| PSPV-PSOE |
|
33.33% |
| Compromís |
|
6.06% |
| EUPV |
|
5.05% |
Results by province
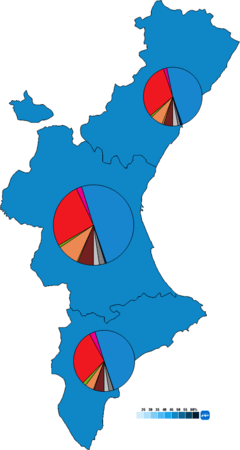
Election results by province.
| Alicante |
| Party |
Vote |
Seats |
| Votes |
% |
±pp |
Won |
+/− |
|
People's Party (PP) |
405,305 | 49.63 | 2.16 |
20 | 1 |
|
Socialist Party of the Valencian Country (PSPV-PSOE) |
243,817 | 29.85 | 6.72 |
12 | 2 |
|
United Left of the Valencian Country (EUPV)[lower-alpha 1] |
43,881 | 5.37 | 1.40 |
2 | ±0 |
|
Commitment Coalition (Compromís) |
37,301 | 4.57 | New |
1 | 1 |
|
Union, Progress and Democracy (UPyD) |
25,312 | 3.10 | New |
0 | ±0 |
|
Greens and Ecopacifists (VyE) |
15,328 | 1.88 | New |
0 | ±0 |
|
Liberal Democratic Centre (CDL) |
4,579 | 0.56 | 0.46 |
0 | ±0 |
|
Anti-Bullfighting Party Against Mistreatment of Animals (PACMA) |
3,537 | 0.43 | New |
0 | ±0 |
|
Republican Left of the Valencian Country (ERPV) |
3,342 | 0.41 | 0.03 |
0 | ±0 |
|
Renewal Liberal Centre (CLR) |
2,463 | 0.30 | 0.12 |
0 | ±0 |
|
Spain 2000 (E-2000) |
1,600 | 0.20 | 0.07 |
0 | ±0 |
|
Communist Party of the Peoples of Spain (PCPE) |
1,515 | 0.19 | 0.02 |
0 | ±0 |
|
Humanist Party (PH) |
1,376 | 0.17 | 0.06 |
0 | ±0 |
|
Valencian Coalition (CVa) |
1,296 | 0.16 | ±0.00 |
0 | ±0 |
|
Authentic Falange (FA) |
1,171 | 0.14 | 0.01 |
0 | ±0 |
|
Family and Life Party (PFyV) |
982 | 0.12 | New |
0 | ±0 |
|
People's Unity Movement-Republicans (MUP-R) |
911 | 0.11 | 0.01 |
0 | ±0 |
|
Communist Unification of Spain (UCE) |
833 | 0.10 | New |
0 | ±0 |
|
National Democracy (DN) |
681 | 0.08 | New |
0 | ±0 |
|
United for Valencia (UxV) |
429 | 0.05 | 0.03 |
0 | ±0 |
|
Blank ballots |
21,034 | 2.58 | 1.14 |
|
| |
| Total |
816,693 | 100.00 | |
35 | ±0 |
| |
| Valid votes |
816,693 | 98.31 | 0.91 |
|
| Invalid votes |
14,010 | 1.69 | 0.91 |
| Votes cast / turnout |
830,703 | 68.20 | 0.15 |
| Abstentions |
387,423 | 31.80 | 0.15 |
| Registered voters |
1,218,126 | |
| |
| Source: Argos Information Portal |
|
| Castellon |
| Party |
Vote |
Seats |
| Votes |
% |
±pp |
Won |
+/− |
|
People's Party (PP) |
136,353 | 48.06 | 1.25 |
13 | 1 |
|
Socialist Party of the Valencian Country (PSPV-PSOE) |
87,983 | 31.01 | 6.99 |
9 | 1 |
|
Commitment Coalition (Compromís) |
19,115 | 6.74 | New |
1 | 1 |
|
United Left of the Valencian Country (EUPV)[lower-alpha 1] |
14,679 | 5.17 | 2.60 |
1 | 1 |
|
Union, Progress and Democracy (UPyD) |
5,423 | 1.91 | New |
0 | ±0 |
|
Greens and Ecopacifists (VyE) |
2,988 | 1.05 | New |
0 | ±0 |
|
Spain 2000 (E-2000) |
2,908 | 1.02 | 0.43 |
0 | ±0 |
|
Republican Left of the Valencian Country (ERPV) |
2,372 | 0.84 | 0.14 |
0 | ±0 |
|
Anti-Bullfighting Party Against Mistreatment of Animals (PACMA) |
931 | 0.33 | New |
0 | ±0 |
|
Valencian Coalition (CVa) |
827 | 0.29 | 0.28 |
0 | ±0 |
|
National Democracy (DN) |
555 | 0.20 | New |
0 | ±0 |
|
Communist Party of the Peoples of Spain (PCPE) |
509 | 0.18 | 0.04 |
0 | ±0 |
|
Liberal Democratic Centre (CDL) |
505 | 0.18 | New |
0 | ±0 |
|
Family and Life Party (PFyV) |
430 | 0.15 | New |
0 | ±0 |
|
United for Valencia (UxV) |
189 | 0.07 | 0.04 |
0 | ±0 |
|
Blank ballots |
7,972 | 2.81 | 1.19 |
|
| |
| Total |
283,739 | 100.00 | |
24 | ±0 |
| |
| Valid votes |
283,739 | 97.94 | 1.24 |
|
| Invalid votes |
5,963 | 2.06 | 1.24 |
| Votes cast / turnout |
289,702 | 69.93 | 0.61 |
| Abstentions |
124,590 | 30.07 | 0.61 |
| Registered voters |
414,292 | |
| |
| Source: Argos Information Portal |
|
| Valencia |
| Party |
Vote |
Seats |
| Votes |
% |
±pp |
Won |
+/− |
|
People's Party (PP) |
669,454 | 49.57 | 4.06 |
22 | 1 |
|
Socialist Party of the Valencian Country (PSPV-PSOE) |
355,341 | 26.31 | 6.20 |
12 | 2 |
|
Commitment Coalition (Compromís) |
119,797 | 8.87 | New |
4 | 4 |
|
United Left of the Valencian Country (EUPV)[lower-alpha 1] |
86,143 | 6.38 | 2.44 |
2 | 1 |
|
Union, Progress and Democracy (UPyD) |
30,124 | 2.23 | New |
0 | ±0 |
|
Greens and Ecopacifists (VyE) |
13,492 | 1.00 | New |
0 | ±0 |
|
Spain 2000 (E-2000) |
7,683 | 0.57 | 0.33 |
0 | ±0 |
|
Valencian Coalition (CVa) |
7,060 | 0.52 | 0.55 |
0 | ±0 |
|
Republican Left of the Valencian Country (ERPV) |
5,415 | 0.40 | 0.06 |
0 | ±0 |
|
Anti-Bullfighting Party Against Mistreatment of Animals (PACMA) |
4,838 | 0.36 | New |
0 | ±0 |
|
Citizens for Blank Votes (CenB) |
4,222 | 0.31 | New |
0 | ±0 |
|
Liberal Democratic Centre (CDL) |
3,119 | 0.23 | New |
0 | ±0 |
|
United for Valencia (UxV) |
3,019 | 0.22 | 0.10 |
0 | ±0 |
|
Communist Party of the Peoples of Spain (PCPE) |
1,432 | 0.11 | 0.06 |
0 | ±0 |
|
Humanist Party (PH) |
1,190 | 0.09 | 0.01 |
0 | ±0 |
|
Spanish Falange of the JONS (FE-JONS) |
1,156 | 0.09 | 0.04 |
0 | ±0 |
|
National Democracy (DN) |
915 | 0.07 | 0.02 |
0 | ±0 |
|
Communist Unification of Spain (UCE) |
886 | 0.07 | New |
0 | ±0 |
|
The Republic (La República) |
735 | 0.05 | New |
0 | ±0 |
|
Valencian Nationalist Left (ENV-RVPVE) |
677 | 0.05 | New |
0 | ±0 |
|
Spanish Patriotic Social Party (SPES) |
585 | 0.04 | New |
0 | ±0 |
|
People's Unity Movement-Republicans (MUP-R) |
529 | 0.04 | 0.02 |
0 | ±0 |
|
Foreigners' Party (PdEx) |
508 | 0.04 | New |
0 | ±0 |
|
Authentic Falange (FA) |
456 | 0.03 | 0.05 |
0 | ±0 |
|
Blank ballots |
31,664 | 2.34 | 0.99 |
|
| |
| Total |
1,350,440 | 100.00 | |
40 | ±0 |
| |
| Valid votes |
1,350,440 | 98.49 | 0.94 |
|
| Invalid votes |
20,743 | 1.51 | 0.94 |
| Votes cast / turnout |
1,371,183 | 71.52 | 0.15 |
| Abstentions |
546,086 | 28.48 | 0.15 |
| Registered voters |
1,917,269 | |
| |
| Source: Argos Information Portal |
|
Notes
- 1 2 3 4 5 United Left results are compared to the Commitment for the Valencian Country totals in the 2007 election.
- 1 2 3 4 5 6 7 8 9 10 11 12 13 This survey shows its poll results projected over candidacy votes (that is, votes going for political parties, excluding blank ballots). The vote percentage in the official election is calculated including blank ballots into the estimation. In order to obtain data comparable to both the official results as well as those of other surveys, a rule of three has been applied to the survey projections, with the results of the calculation being shown instead.
References