United States presidential election in Ohio, 1996
| | |||||||||||||||||||||||||||||||||||||||
| |||||||||||||||||||||||||||||||||||||||
| |||||||||||||||||||||||||||||||||||||||
|
| |||||||||||||||||||||||||||||||||||||||
| County Results
Clinton—60-70%
Clinton—50-60%
Clinton—40-50%
Dole—40-50%
Dole—50-60% | |||||||||||||||||||||||||||||||||||||||
| |||||||||||||||||||||||||||||||||||||||


The 1996 United States presidential election in Ohio took place on November 5, 1996. All 50 states and the District of Columbia, were part of the 1996 United States presidential election. Ohio voters chose 21 electors to the Electoral College, which selected the President and Vice President.
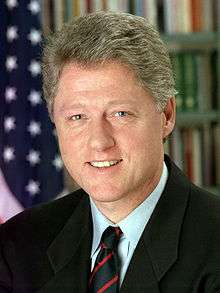
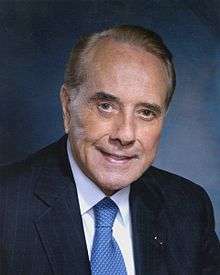
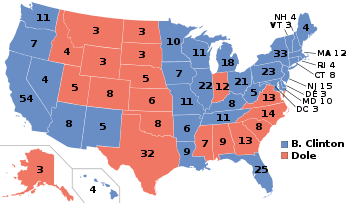
Ohio was won by incumbent United States President Bill Clinton of Arkansas, who was running against Kansas Senator Bob Dole. Clinton ran a second time with former Tennessee Senator and Al Gore as Vice President, and Dole ran with former New York Congressman Jack Kemp.[1]
Ohio weighed in for this election as 2% more third-party than the national average.
Partisan background
The presidential election of 1996 was a very multi-partisan election for Ohio, with over 11% of the electorate voting for third-party candidates. Most counties in the state turned out more for Dole than Clinton. Two notable exceptions to this trend were Cleveland's Cuyahoga County, and residents of several counties on the Eastern border with Pennsylvania, who voted largely for Clinton.
In his second bid for the Presidency, Ross Perot lead the newly reformed Reform Party to gain over 10% of the votes in Ohio, and to pull in support nationally as the most popular third-party candidate to run for United States Presidency in recent times.
| Elections in Ohio | ||||||||||
|---|---|---|---|---|---|---|---|---|---|---|
.svg.png) | ||||||||||
|
||||||||||
|
|
||||||||||
Results
| United States presidential election in Ohio, 1996 | ||||||
|---|---|---|---|---|---|---|
| Party | Candidate | Votes | Percentage | Electoral votes | ||
| Democratic | Bill Clinton | 2,148,222 | 47.38% | 21 | ||
| Republican | Bob Dole | 1,859,883 | 41.02% | 0 | ||
| Reform | Ross Perot | 483,207 | 10.66% | 0 | ||
| Libertarian | Harry Browne | 12,851 | 0.28% | 0 | ||
| Workers World | Monica Moorehead | 10,813 | 0.24% | 0 | ||
| Natural Law | Dr. John Hagelin | 9,120 | 0.20% | 0 | ||
| Taxpayers’ | Howard Phillips | 7,361 | 0.16% | 0 | ||
| Green | Ralph Nader (write-in) | 2,962 | 0.07% | 0 | ||
| Other write-ins | 15 | 0.00% | 0 | |||
| Totals | 4,534,434 | 100.00% | 21 | |||
| Voter Turnout (Voting age/Registered) | ||||||
See also
References
- ↑ "Dave Leip's Atlas of U.S. Presidential Elections". Uselectionatlas.org. Retrieved 2013-07-21.
| Candidates |
|  |
|---|---|---|
| General articles |
| |
| Local results |
| |
| Other 1996 elections | ||