Portuguese legislative election, 1999
| | |||||||||||||||||||||||||||||||||||||||||||||||
| |||||||||||||||||||||||||||||||||||||||||||||||
| |||||||||||||||||||||||||||||||||||||||||||||||
| |||||||||||||||||||||||||||||||||||||||||||||||

| Portugal |
 This article is part of the series: |
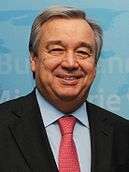
The Portuguese legislative election of 1999 took place on 10 October. The Socialist Party was aiming a second term under the lead of António Guterres, in the end the Socialists won the election, but missed what would be an historical absolute majority for the party by just one MP.
The Social Democratic Party under the lead of José Manuel Durão Barroso was still away from the preferences of the majority of the Portuguese people, after the ten years cycle under the lead of Cavaco Silva that had terminated four years before. The Democratic Unity Coalition achieved an important climb in the scorecard, against those who predicted its irreversible decline after the end of the Socialist Bloc in the early 1990s. For the first time, the Left Bloc, formed after the merger of several minor left-wing parties became represented in the parliament after electing two MPs. Turnout in this election was very low, only being surpassed in 2009 and 2011 when turnout was just less than 60%.
Voter turnout reached only 61% of voters, one of the lowest ever recorded.
Parties
The major parties involved were listed with their leaders:
- Left Bloc (BE), Francisco Louçã
- Unitary Democratic Coalition (CDU), Carlos Carvalhas
- Socialist Party (PS), António Guterres
- Social Democratic Party (PPD/PSD), José Manuel Durão Barroso
- People's Party (CDS–PP), Paulo Portas
António Guterres, leader of the Socialist Party, was nominated Prime Minister for the second time, and missed the absolute majority by one MP, achieving exactly half of the 230 MPs.
Opinion polling
The following table shows the opinion polls of voting intention of the Portuguese voters before the election. Those parties that are listed are currently represented in parliament. Included is also the result of the Portuguese general elections in 1995 and 1999 for reference.
Note, until 2000, the publication of opinion polls in the last week of the campaign was forbidden.
| Date Released | Polling Firm | PS | PSD | CDU | CDS-PP | BE | Others | Lead |
|---|---|---|---|---|---|---|---|---|
| 10 Oct 1999 | Leg. Election | 44.1 115 seats |
32.3 81 seats |
9.0 17 seats |
8.3 15 seats |
2.4 2 seats |
3.9 0 seats |
11.8 |
| 2 Oct | Euroexpansão | 50.0 | 32.0 | 6.0 | 8.0 | 2.0 | 2.0 | 18.0 |
| 1 Oct | SEEDS | 47.0 | 32.0 | 8.0 | 7.0 | 1.0 | 5.0 | 15.0 |
| 1 Oct | Metris | 48.0 | 31.0 | 7.0 | 7.0 | 1.0 | 6.0 | 17.0 |
| 1 Oct | Universidade Católica | 47.2 | 30.0 | 7.9 | 7.2 | 2.8 | 4.9 | 17.2 |
| 30 Sep | Marktest | 46.2 | 30.7 | 10.6 | 4.2 | 2.8 | 5.5 | 15.5 |
| 30 Sep | Aximage | 49.0 | 33.0 | 7.0 | 6.0 | 1.0 | 4.0 | 16.0 |
| 1999 | ||||||||
| 1 Oct 1995 | Leg. Election | 43.8 112 seats |
34.1 88 seats |
8.6 15 seats |
9.1 15 seats |
Did not exist | 4.4 0 seats |
9.7 |
National summary of votes and seats
| Parties | Votes | % | ± | MPs | MPs %/ votes % | |||||
|---|---|---|---|---|---|---|---|---|---|---|
| 1995 | 1999 | ± | % | ± | ||||||
| Socialist | 2,385,922 | 44.06 | 112 | 115 | 50.00 | 1.13 | ||||
| Social Democratic | 1,750,158 | 32.32 | 88 | 81 | 35.22 | 1.09 | ||||
| Unitary Democratic Coalition[A] | 487,058 | 8.99 | 15 | 17 | 7.39 | 0.82 | ||||
| People's | 451,643 | 8.34 | 15 | 15 | 6.52 | 0.78 | ||||
| Left Bloc | 132,333 | 2.44 | N/A | N/A | 2 | N/A | 0.87 | N/A | 0.36 | |
| Workers' Communist Party | 40,006 | 0.74 | 0 | 0 | 0.00 | 0.0 | ||||
| Earth Party | 19,938 | 0.37 | 0 | 0 | 0.00 | 0.0 | ||||
| People's Monarchist Party | 16,522 | 0.31 | N/A | N/A | 0 | N/A | 0.00 | N/A | 0.0 | |
| National Solidarity Party | 11,488 | 0.21 | 0 | 0 | 0.00 | 0.0 | ||||
| Humanist Party | 7,346 | 0.14 | N/A | N/A | 0 | N/A | 0.00 | N/A | 0.0 | |
| Workers Party of Socialist Unity | 4,104 | 0.08 | 0 | 0 | 0.00 | 0.0 | ||||
| Democratic Party of the Atlantic[B] | 438 | 0.01 | 0 | 0 | 0.00 | 0.0 | ||||
| Total valid | 5,306,956 | 98.00 | 230 | 230 | 100.00 | — | ||||
| Blank ballots | 56,964 | 1.05 | ||||||||
| Invalid ballots | 51,230 | 0.95 | ||||||||
| Total (turnout 61.09%) | 5,415,102 | 100.00 | ||||||||
| A Portuguese Communist Party (15 MPs) and "The Greens" (2 MPs) ran in coalition.[3] B Democratic Party of the Atlantic electoral list only in Azores. | ||||||||||
| Source: Comissão Nacional de Eleições | ||||||||||
Distribution by constituency
| Constituency | % | S | % | S | % | S | % | S | % | S | Total S |
|---|---|---|---|---|---|---|---|---|---|---|---|
| PS | PSD | CDU | CDS–PP | BE | |||||||
| Azores | 53.3 | 3 | 35.8 | 2 | 1.7 | - | 5.6 | - | 1.1 | - | 5 |
| Aveiro | 40.2 | 7 | 38.3 | 6 | 3.5 | - | 13.6 | 2 | 1.3 | - | 15 |
| Beja | 46.7 | 2 | 14.5 | - | 28.3 | 1 | 3.9 | - | 1.6 | - | 3 |
| Braga | 44.3 | 8 | 36.7 | 7 | 5.4 | 1 | 8.9 | 1 | 1.2 | - | 17 |
| Bragança | 39.7 | 2 | 45.1 | 2 | 2.6 | - | 8.7 | - | 0.8 | - | 4 |
| Castelo Branco | 51.6 | 3 | 32.0 | 2 | 5.3 | - | 6.3 | - | 1.2 | - | 5 |
| Coimbra | 47.2 | 6 | 35.2 | 4 | 6.1 | - | 6.0 | - | 2.0 | - | 10 |
| Évora | 45.7 | 2 | 18.7 | 1 | 24.6 | 1 | 5.1 | - | 1.5 | - | 4 |
| Faro | 48.4 | 5 | 29.5 | 3 | 8.3 | - | 7.3 | - | 2.3 | - | 8 |
| Guarda | 43.4 | 2 | 39.2 | 2 | 3.2 | - | 9.8 | - | 1.1 | - | 4 |
| Leiria | 36.8 | 4 | 42.6 | 5 | 5.3 | - | 9.9 | 1 | 1.7 | - | 10 |
| Lisbon | 42.7 | 23 | 27.3 | 14 | 12.3 | 6 | 8.5 | 4 | 4.9 | 2 | 49 |
| Madeira | 35.1 | 2 | 46.2 | 3 | 2.8 | - | 10.9 | - | 1.2 | - | 5 |
| Portalegre | 51.2 | 2 | 22.5 | 1 | 15.0 | - | 5.9 | - | 1.2 | - | 3 |
| Porto | 48.0 | 19 | 32.7 | 13 | 6.2 | 2 | 7.5 | 3 | 2.3 | - | 37 |
| Santarém | 45.5 | 5 | 30.2 | 3 | 10.1 | 1 | 8.1 | 1 | 2.0 | - | 10 |
| Setúbal | 43.7 | 8 | 18.0 | 3 | 24.8 | 5 | 5.6 | 1 | 3.5 | - | 17 |
| Viana do Castelo | 40.2 | 3 | 35.8 | 2 | 5.0 | - | 14.0 | 1 | 1.2 | - | 6 |
| Vila Real | 40.8 | 2 | 45.5 | 3 | 2.4 | - | 6.8 | - | 0.8 | - | 5 |
| Viseu | 38.1 | 4 | 44.3 | 4 | 2.2 | - | 10.5 | 1 | 1.2 | - | 9 |
| Europe | 55.4 | 2 | 24.7 | - | 5.3 | - | 3.2 | - | 0.6 | - | 2 |
| Rest of the World | 39.8 | 1 | 49.5 | 1 | 1.7 | - | 3.5 | - | 0.4 | - | 2 |
| Total | 44.1 | 115 | 32.3 | 81 | 9.0 | 17 | 8.3 | 15 | 2.4 | 2 | 230 |
| Source: Comissão Nacional de Eleições | |||||||||||
References
External links
- Preliminary results of the 1999 election
- Comissão Nacional de Eleições
- Centro de Estudos do Pensamento Político
See also
| Presidential elections | |
|---|---|
| Parliamentary elections |
|
| Local elections | |
| European elections | |
| Referendums | |
| |