Portuguese legislative election, 1995
| | |||||||||||||||||||||||||||||||||||||||||||||||
| |||||||||||||||||||||||||||||||||||||||||||||||
| |||||||||||||||||||||||||||||||||||||||||||||||
| |||||||||||||||||||||||||||||||||||||||||||||||

| Portugal |
 This article is part of the series: |
The Portuguese legislative election of 1995 took place on 1 October. The Socialist Party defeated the Social Democratic Party under the lead of António Guterres, elected three years before, but missed the absolute majority by 4 MPs. The Social Democratic party under the lead of Fernando Nogueira was weakened by the end of a ten years cycle of government of Cavaco Silva. The two minor parties, the People's Party and the Democratic Unity Coalition achieved only 15 MPs each, a thing that marked the growing bi-polarization of the Portuguese political map. Although turnout, in percentage point, was lower than the previous election in 1991, almost 6 million voters cast a ballot on election day, the highest figure since 1980.
Voter turnout stood at 66.3%, the lowest till then.
Parties
The major parties involved were listed with their leaders:
- Democratic Unity Coalition (CDU), Carlos Carvalhas
- Socialist Party (PS), António Guterres
- Social Democratic Party (PSD), Fernando Nogueira
- People's Party (CDS–PP), Manuel Monteiro
António Guterres, leader of the Socialist Party, was nominated Prime Minister for the first time, becoming the first socialist Prime Minister in 10 years.
Opinion Polling
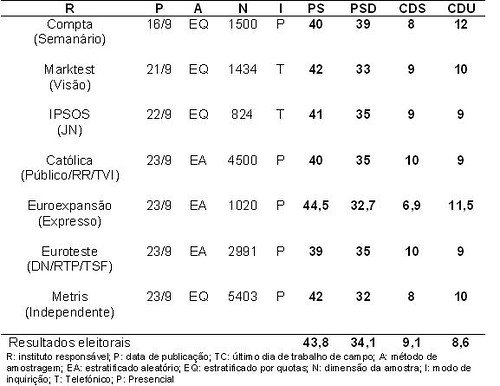
The following table shows the opinion polls of voting intention of the Portuguese voters before the election. Those parties that are listed are currently represented in parliament. Included is also the result of the Portuguese general elections in 1991 and 1995 for reference.
Note, until 2000, the publication of opinion polls in the last week of the campaign was forbidden.
| Date Released | Polling Firm | PSD | PS | CDU | CDS-PP | Others | Lead | |
|---|---|---|---|---|---|---|---|---|
| Leg. Election | Election Results | 34.1 88 seats |
43.8 112 seats |
8.6 15 seats |
9.1 15 seats |
4.4 0 seats |
9.7 | |
| 23 Sep | Metris | 32.0 | 42.0 | 10.0 | 8.0 | 8.0 | 10.0 | |
| 23 Sep | Euroteste | 35.0 | 39.0 | 9.0 | 10.0 | 7.0 | 4.0 | |
| 23 Sep | Euroexpansão | 32.7 | 44.5 | 11.5 | 6.9 | 4.4 | 11.8 | |
| 23 Sep | Universidade Católica | 35.0 | 40.0 | 9.0 | 10.0 | 6.0 | 5.0 | |
| 22 Sep | IPSOS | 35.0 | 41.0 | 9.0 | 9.0 | 6.0 | 6.0 | |
| 21 Sep | Marktest | 33.0 | 42.0 | 10.0 | 9.0 | 6.0 | 9.0 | |
| 16 Sep | Compta | 39.0 | 40.0 | 12.0 | 8.0 | 1.0 | 1.0 | |
| 1995 | ||||||||
| 6 Oct 1991 | Leg. Election | 50.6 135 seats |
29.1 72 seats |
8.8 17 seats |
4.4 5 seats |
7.1 1 seats |
21.5 | |
National summary of votes and seats
| Parties | Votes | % | ± | MPs | MPs %/ votes % | |||||
|---|---|---|---|---|---|---|---|---|---|---|
| 1991 | 1995 | ± | % | ± | ||||||
| Socialist | 2,583,755 | 43.76 | 72 | 112 | 48.70 | 1.11 | ||||
| Social Democratic | 2,014,589 | 34.12 | 135 | 88 | 38.26 | 1.12 | ||||
| People's[A] | 534,470 | 9.05 | 5 | 15 | 6.52 | 0.72 | ||||
| Democratic Unity Coalition[B] | 506,157 | 8.57 | 17 | 15 | 6.52 | 0.76 | ||||
| Workers' Communist Party | 41,137 | 0.70 | 0 | 0 | 0.00 | 0.0 | ||||
| Revolutionary Socialist Party | 37,638 | 0.64 | 0 | 0 | 0.00 | 0.0 | ||||
| People's Democratic Union | 33,876 | 0.57 | 0 | 0 | 0.00 | 0.0 | ||||
| National Solidarity Party | 12,613 | 0.21 | 1 | 0 | 0.00 | 0.0 | ||||
| Party of the People | 8,279 | 0.14 | N/A | N/A | 0 | N/A | 0.00 | N/A | 0.0 | |
| Earth Party | 8,235 | 0.14 | N/A | N/A | 0 | N/A | 0.00 | N/A | 0.0 | |
| Earth Party / People's Monarchist Party | 5,932 | 0.10 | N/A | N/A | 0 | N/A | 0.00 | N/A | 0.0 | |
| Unity Movement for Workers | 2,544 | 0.04 | N/A | N/A | 0 | N/A | 0.00 | N/A | 0.0 | |
| Democratic Party of the Atlantic | 2,536 | 0.04 | 0 | 0 | 0.00 | 0.0 | ||||
| Total valid | 5,791,761 | 98.08 | 230 | 230 | 100.00 | — | ||||
| Blank ballots | 45,793 | 0.78 | ||||||||
| Invalid ballots | 67,300 | 1.14 | ||||||||
| Total (turnout 66.30%) | 5,904,854 | 100.00 | ||||||||
| A In 1993, the name "People´s Party" was added to the party's name. B Portuguese Communist Party (13 MPs) and "The Greens" (2 MPs) ran in coalition.[3] | ||||||||||
| Source: Comissão Nacional de Eleições | ||||||||||
Distribution by constituency
| Constituency | % | S | % | S | % | S | % | S | Total S |
|---|---|---|---|---|---|---|---|---|---|
| PS | PSD | CDS–PP | CDU | ||||||
| Azores | 37.6 | 2 | 47.8 | 3 | 9.4 | - | 1.8 | - | 5 |
| Aveiro | 40.2 | 6 | 41.2 | 6 | 12.6 | 2 | 2.7 | - | 14 |
| Beja | 45.8 | 2 | 15.7 | 1 | 3.6 | - | 29.2 | 1 | 4 |
| Braga | 42.9 | 8 | 38.2 | 7 | 10.7 | 1 | 4.5 | - | 16 |
| Bragança | 40.3 | 2 | 44.8 | 2 | 9.4 | - | 1.9 | - | 4 |
| Castelo Branco | 53.2 | 3 | 32.1 | 2 | 7.2 | - | 5.3 | - | 5 |
| Coimbra | 49.1 | 6 | 34.5 | 4 | 7.1 | - | 5.1 | - | 10 |
| Évora | 42.6 | 2 | 20.2 | 1 | 5.2 | - | 26.9 | 1 | 4 |
| Faro | 49.6 | 5 | 29.2 | 3 | 8.3 | - | 7.8 | - | 8 |
| Guarda | 43.7 | 2 | 39.9 | 2 | 9.9 | - | 2.3 | - | 4 |
| Leiria | 36.7 | 4 | 43.3 | 5 | 11.4 | 1 | 4.5 | - | 10 |
| Lisbon | 44.3 | 24 | 29.0 | 15 | 9.4 | 5 | 12.0 | 6 | 50 |
| Madeira | 32.0 | 2 | 46.1 | 3 | 12.9 | - | 1.3 | - | 5 |
| Portalegre | 50.5 | 2 | 23.4 | 1 | 6.3 | - | 14.0 | - | 3 |
| Porto | 46.7 | 18 | 36.4 | 14 | 7.8 | 3 | 6.0 | 2 | 37 |
| Santarém | 45.8 | 5 | 31.0 | 3 | 8.7 | 1 | 9.5 | 1 | 10 |
| Setúbal | 44.9 | 9 | 18.4 | 3 | 7.2 | 1 | 23.8 | 4 | 17 |
| Viana do Castelo | 38.8 | 3 | 42.1 | 3 | 11.3 | - | 4.6 | - | 6 |
| Vila Real | 40.0 | 2 | 46.0 | 3 | 7.8 | - | 1.9 | - | 5 |
| Viseu | 38.4 | 4 | 44.3 | 4 | 11.5 | 1 | 1.8 | - | 9 |
| Europe | 35.1 | 1 | 33.8 | 1 | 4.4 | - | 6.4 | - | 2 |
| Rest of the World | 12.8 | - | 69.3 | 2 | 3.8 | - | 1.2 | - | 2 |
| Total | 43.8 | 112 | 34.1 | 88 | 9.1 | 15 | 8.6 | 15 | 230 |
| Source: Comissão Nacional de Eleições | |||||||||
References
External links
See also
| Presidential elections | |
|---|---|
| Parliamentary elections |
|
| Local elections | |
| European elections | |
| Referendums | |
| |