Poplar (UK Parliament constituency)
| Poplar | |
|---|---|
|
Former Borough constituency for the House of Commons | |
| 1885–1918 | |
| Number of members | one |
| Replaced by | Poplar South |
| Created from | Tower Hamlets |
| 1950–1974 | |
| Number of members | one |
| Replaced by | Stepney and Poplar |
| Created from | Bow and Bromley and Poplar South |
Poplar was a parliamentary constituency centred on the Poplar district of the East End of London. It returned one Member of Parliament to the House of Commons of the Parliament of the United Kingdom.
History
The constituency was created for the 1885 general election, and abolished for the 1918 general election, when with very minor boundary changes it was replaced by the new constituency of Poplar South. A small amount of the constituency's territory was added to Bow and Bromley.
It was re-established for the 1950 general election, and abolished again for the February 1974 general election. It was then partly replaced by the new Stepney and Poplar constituency.
Boundaries


1885-1918: In 1885 the area was administered as part of the county of Middlesex. It was located in the Tower division, in the east of the historic county. The neighbourhood of Poplar formed a division of the parliamentary borough of Tower Hamlets. The parliamentary division was part of the East End of London.
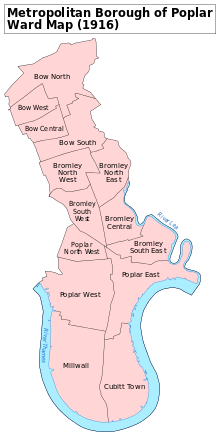
In 1889 the Tower division of Middlesex was severed from the county, for administrative purposes. It became part of the County of London. In 1900 the lower tier of local government in London was re-modelled. Poplar constituency became part of the Metropolitan Borough of Poplar.
1950-1974: When a re-distribution of parliamentary seats took effect in 1950, the constituency was re-created. It then included the whole of the Metropolitan Borough of Poplar.
In 1965 the Metropolitan Borough was incorporated in the London Borough of Tower Hamlets in Greater London.
Members of Parliament
| Election | Member | Party | |
|---|---|---|---|
| 1885 | Henry Green | Liberal | |
| 1886 | Sydney Buxton | Liberal | |
| 1914 b-e | Alfred Yeo | Liberal | |
| 1918 | constituency abolished: see Poplar South & Bow and Bromley | ||
| 1950 | constituency re-created | ||
| 1950 | Charles Key | Labour | |
| 1964 | Ian Mikardo | Labour | |
| Feb 1974 | constituency abolished: see Stepney and Poplar | ||
Election results
Elections in the 1880s
| Party | Candidate | Votes | % | ± | |
|---|---|---|---|---|---|
| Liberal | Henry Green | 4,090 | 65.9 | n/a | |
| Conservative | Denzil R. Onslow | 2,113 | 34.1 | n/a | |
| Majority | 1,977 | 31.8 | n/a | ||
| Turnout | 9,041 | 68.6 | n/a | ||
| Liberal win | |||||

| Party | Candidate | Votes | % | ± | |
|---|---|---|---|---|---|
| Liberal | Sydney Charles Buxton | 2,903 | 50.7 | ||
| Conservative | Alfred Cholmeley Earle Welby | 2,827 | 49.3 | ||
| Majority | 76 | 1.4 | |||
| Turnout | 9,041 | 63.4 | |||
| Liberal hold | Swing | -15.2 | |||
Elections in the 1890s
| Party | Candidate | Votes | % | ± | |
|---|---|---|---|---|---|
| Liberal | Sydney Charles Buxton | 5,007 | 62.7 | ||
| Conservative | Alfred Cholmeley Earle Welby | 2,975 | 37.3 | ||
| Majority | 2,032 | 25.4 | |||
| Turnout | 10,348 | 77.1 | |||
| Liberal hold | Swing | +12.0 | |||
| Party | Candidate | Votes | % | ± | |
|---|---|---|---|---|---|
| Liberal | Sydney Charles Buxton | 3,939 | 55.9 | ||
| Conservative | William Pelham Bullivant | 3,110 | 44.1 | ||
| Majority | 829 | 11.8 | |||
| Turnout | 9,684 | 72.8 | |||
| Liberal hold | Swing | -6.8 | |||
Elections in the 1900s
| Party | Candidate | Votes | % | ± | |
|---|---|---|---|---|---|
| Liberal | Sydney Charles Buxton | 3,992 | 58.4 | ||
| Conservative | William Pelham Bullivant | 2,840 | 41.6 | ||
| Majority | 1,152 | 16.8 | |||
| Turnout | 10,009 | 68.3 | |||
| Liberal hold | Swing | +2.5 | |||
| Party | Candidate | Votes | % | ± | |
|---|---|---|---|---|---|
| Liberal | Sydney Charles Buxton | 4,546 | 67.0 | ||
| Conservative | George Oldroyd Borwick | 2,235 | 33.0 | ||
| Majority | 2,311 | 34.0 | |||
| Turnout | 9,088 | 74.6 | |||
| Liberal hold | Swing | +8.6 | |||
Elections in the 1910s
| Party | Candidate | Votes | % | ± | |
|---|---|---|---|---|---|
| Liberal | Rt Hon. Sydney Charles Buxton | 4,172 | 57.2 | ||
| Conservative | Leslie Orme Wilson | 3,125 | 42.8 | ||
| Majority | 1,047 | 14.4 | |||
| Turnout | |||||
| Liberal hold | Swing | -9.8 | |||
| Party | Candidate | Votes | % | ± | |
|---|---|---|---|---|---|
| Liberal | Rt Hon. Sydney Charles Buxton | 3,977 | 64.9 | ||
| Conservative | Ellis Ashmead-Bartlett | 2,148 | 35.1 | ||
| Majority | 1,829 | 29.8 | |||
| Turnout | |||||
| Liberal hold | Swing | +7.7 | |||

| Party | Candidate | Votes | % | ± | |
|---|---|---|---|---|---|
| Liberal | Alfred William Yeo | 3,548 | 46.0 | ||
| Conservative | Robin S. Kerr-Clark | 3,270 | 42.4 | ||
| British Socialist Party | John Joseph Jones | 893 | 11.6 | ||
| Majority | 278 | 3.6 | |||
| Turnout | |||||
| Liberal hold | Swing | -13.1 | |||
Elections in the 1950s
| Party | Candidate | Votes | % | ± | |
|---|---|---|---|---|---|
| Labour | Charles William Key | 30,756 | 78.23 | N/A | |
| Conservative | Richard Thomas Henry Lonsdale | 6,088 | 15.48 | N/A | |
| Liberal | Joseph F Purkis | 1,933 | 4.92 | N/A | |
| Communist | H Watson | 540 | 1.37 | N/A | |
| Majority | 24,668 | 62.74 | N/A | ||
| Turnout | 39,317 | 78.39 | N/A | ||
| Registered electors | 50,154 | ||||
| Labour win (new seat) | |||||
| Party | Candidate | Votes | % | ± | |
|---|---|---|---|---|---|
| Labour | Charles William Key | 31,377 | 82.03 | +3.80 | |
| Conservative | Peter Frank Hannibal Emery | 6,875 | 17.97 | +2.49 | |
| Majority | 24,502 | 64.05 | +1.31 | ||
| Turnout | 38,252 | 75.73 | -2.66 | ||
| Registered electors | 50,509 | ||||
| Labour hold | Swing | +0.66 | |||
| Party | Candidate | Votes | % | ± | |
|---|---|---|---|---|---|
| Labour | Charles William Key | 25,642 | 81.52 | -0.51 | |
| Conservative | Gerard Foliott Vaughan | 5,814 | 18.48 | +0.51 | |
| Majority | 19,828 | 63.03 | -1.02 | ||
| Turnout | 31,456 | 64.15 | -11.58 | ||
| Registered electors | 49,038 | ||||
| Labour hold | Swing | -0.51 | |||
| Party | Candidate | Votes | % | ± | |
|---|---|---|---|---|---|
| Labour | Charles William Key | 22,506 | 77.23 | -4.29 | |
| Conservative | Peter Blair Black | 6,635 | 22.77 | +4.29 | |
| Majority | 15,871 | 54.46 | -8.57 | ||
| Turnout | 29,141 | 65.62 | +1.57 | ||
| Registered electors | 44,412 | ||||
| Labour hold | Swing | -4.29 | |||
Elections in the 1960s
| Party | Candidate | Votes | % | ± | |
|---|---|---|---|---|---|
| Labour | Ian Mikardo | 20,271 | 77.71 | +0.48 | |
| Conservative | Kenneth Wilfred Baker | 5,813 | 22.29 | -0.48 | |
| Majority | 14,458 | 55.43 | +0.96 | ||
| Turnout | 26,084 | 58.28 | -7.34 | ||
| Registered electors | 44,756 | ||||
| Labour hold | Swing | +0.48 | |||
| Party | Candidate | Votes | % | ± | |
|---|---|---|---|---|---|
| Labour | Ian Mikardo | 21,071 | 84.51 | +6.80 | |
| Conservative | Roger Holloway | 3,863 | 15.49 | -6.80 | |
| Majority | 17,208 | 69.01 | +13.58 | ||
| Turnout | 24,934 | 57.67 | -0.61 | ||
| Registered electors | 43,236 | ||||
| Labour hold | Swing | +6.80 | |||
Elections in the 1970s
| Party | Candidate | Votes | % | ± | |
|---|---|---|---|---|---|
| Labour | Ian Mikardo | 16,520 | 80.37 | -4.14 | |
| Conservative | Ronald C Denney | 4,036 | 19.63 | +4.14 | |
| Majority | 12,484 | 60.73 | -8.28 | ||
| Turnout | 20,556 | 49.05 | -8.62 | ||
| Registered electors | 41,908 | ||||
| Labour hold | Swing | -4.14 | |||
References
- ↑ Kimber, Richard. "UK General Election results February 1950". Political Science Resources. Retrieved 11 April 2016.
- ↑
- ↑ Kimber, Richard. "UK General Election results February 1951". Political Science Resources. Retrieved 11 April 2016.
- ↑
- ↑ Kimber, Richard. "UK General Election results February 1955". Political Science Resources. Retrieved 11 April 2016.
- ↑
- ↑ Kimber, Richard. "UK General Election results 1959". Political Science Resources. Retrieved 11 April 2016.
- ↑
- ↑ Kimber, Richard. "UK General Election results 1964". Political Science Resources. Retrieved 11 April 2016.
- ↑
- ↑ Kimber, Richard. "UK General Election results 1966". Political Science Resources. Retrieved 11 April 2016.
- ↑
- ↑ Kimber, Richard. "UK General Election results 1970". Political Science Resources. Retrieved 11 April 2016.
- ↑
- Boundaries of Parliamentary Constituencies 1885-1972, compiled and edited by F.W.S. Craig (Parliamentary Reference Publications 1972)
- Leigh Rayment's Historical List of MPs – Constituencies beginning with "P" (part 2)