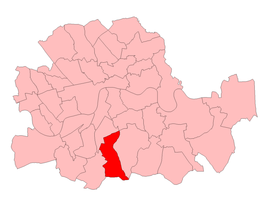
Norwood (UK Parliament constituency)
| Norwood | |
|---|---|
|
Former Borough constituency for the House of Commons | |
| County | Greater London |
| 1885–1997 | |
| Number of members | One |
| Replaced by | Dulwich & West Norwood, Streatham and Vauxhall |
| Created from | Lambeth |


Norwood was a parliamentary constituency in south London which returned one Member of Parliament to the House of Commons of the Parliament of the United Kingdom by the first past the post system.
History
The constituency existed from 1885 until it was abolished for the 1997 general election. It was held by the Conservative Party for the first 60 years of its existence. It then oscillated between the Conservatives and Labour until 1966, from which point it was held by Labour until its abolition.
Boundaries
1885-1918: The ward of Norwood, and parts of the wards of Brixton and Stockwell.
1918-1950: The Metropolitan Borough of Lambeth ward of Norwood, and parts of the wards of Herne Hill and Tulse Hill.
1950-1974: The Metropolitan Borough of Lambeth wards of Herne Hill, Knight's Hill, and Tulse Hill.
1974-1983: The London Borough of Lambeth wards of Herne Hill, Knight's Hill, Leigham, Thurlow Park, and Tulse Hill.
1983-1997: The London Borough of Lambeth wards of Angell, Gipsy Hill, Herne Hill, Knight's Hill, St Martin's, Thurlow Park, and Tulse Hill.
Abolition
In 1997, constituents were divided between the newly created cross-borough (Lambeth & Southwark) seat of Dulwich and West Norwood to the east, Streatham to the west and Vauxhall to the north.
Members of Parliament
| Year | Member | Party | |
|---|---|---|---|
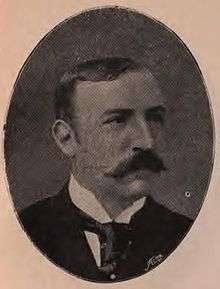
| 1885 | Thomas Lynn Bristowe | Conservative | |
| 1892 | Sir Ernest Tritton | Conservative | |
| 1906 | George Frederic Stewart Bowles | Conservative | |
| 1910 | Harry Simon Samuel | Unionist | |
| 1922 | Walter Greaves-Lord | Unionist | |
| 1935 | Duncan Sandys | Conservative | |
| 1945 | Ronald Chamberlain | Labour | |
| 1950 | John Smyth | Conservative | |
| 1966 | John Fraser | Labour | |
| 1997 | constituency abolished | ||
Election results
Elections in the 1880s
| Party | Candidate | Votes | % | ± | |
|---|---|---|---|---|---|
| Conservative | Thomas Lynn Bristowe | 3,496 | 57.7 | n/a | |
| Liberal | Peter William Clayden | 2,563 | 42.3 | n/a | |
| Majority | 933 | 15.4 | n/a | ||
| Turnout | 7,501 | 80.8 | n/a | ||
| Conservative win (new seat) | |||||
| Party | Candidate | Votes | % | ± | |
|---|---|---|---|---|---|
| Conservative | Thomas Lynn Bristowe | 3,334 | 67.5 | ||
| Liberal | Oscar Browning | 1,606 | 32.5 | ||
| Majority | 1,728 | 35.0 | |||
| Turnout | 7,501 | 65.9 | |||
| Conservative hold | Swing | +9.8 | |||
Elections in the 1890s
| Party | Candidate | Votes | % | ± | |
|---|---|---|---|---|---|
| Conservative | Charles Ernest Tritton | 4,147 | 61.6 | ||
| Liberal | Dr. H.W. Verdon | 2,584 | 38.4 | ||
| Majority | 1,563 | 23.2 | |||
| Turnout | 8,884 | 75.8 | |||
| Conservative hold | Swing | -5.9 | |||
| Party | Candidate | Votes | % | ± | |
|---|---|---|---|---|---|
| Conservative | Charles Ernest Tritton | unopposed | n/a | n/a | |
| Conservative hold | Swing | n/a | |||
Elections in the 1900s
| Party | Candidate | Votes | % | ± | |
|---|---|---|---|---|---|
| Conservative | Charles Ernest Tritton | unopposed | n/a | n/a | |
| Conservative hold | Swing | n/a | |||

| Party | Candidate | Votes | % | ± | |
|---|---|---|---|---|---|
| Conservative | George Frederic Stewart Bowles | 5,567 | 54.0 | n/a | |
| Liberal | Nathaniel William Hubbard | 4,748 | 46.0 | n/a | |
| Majority | 819 | 8.0 | n/a | ||
| Turnout | 12,867 | 80.2 | n/a | ||
| Conservative hold | Swing | n/a | |||
Elections in the 1910s
| Party | Candidate | Votes | % | ± | |
|---|---|---|---|---|---|
| Conservative | Sir Harry Simon Samuel | 6,958 | 57.3 | ||
| Liberal | Sir Alexander Waldemar Lawrence | 5,180 | 42.7 | ||
| Majority | 1,778 | 14.6 | |||
| Turnout | |||||
| Conservative hold | Swing | +3.3 | |||

| Party | Candidate | Votes | % | ± | |
|---|---|---|---|---|---|
| Conservative | Sir Harry Simon Samuel | 6,291 | 59.6 | ||
| Liberal | George Shrubsall | 4,265 | 40.4 | ||
| Majority | 2,026 | 19.2 | |||
| Turnout | |||||
| Conservative hold | Swing | +2.3 | |||
General Election 1914/15:
Another General Election was required to take place before the end of 1915. The political parties had been making preparations for an election to take place and by the July 1914, the following candidates had been selected;
- Unionist: Sir Harry Simon Samuel
- Liberal:
| Party | Candidate | Votes | % | ± | |
|---|---|---|---|---|---|
| Unionist | 12,848 | 65.8 | |||
| NFDDSS | Harold Bignold | 6,665 | 34.2 | n/a | |
| Majority | 6,183 | 31.6 | |||
| Turnout | 40,253 | 48.5 | |||
| Unionist hold | Swing | n/a | |||
- endorsed by Coalition Government
Elections in the 1920s
| Party | Candidate | Votes | % | ± | |
|---|---|---|---|---|---|
| Unionist | Walter Greaves-Lord | 16,121 | 60.8 | ||
| Liberal | Richard Evan Williams Kirby | 6,253 | 23.5 | n/a | |
| Labour | William Archer Hodgson | 4,180 | 15.7 | n/a | |
| Majority | 9,868 | 37.3 | |||
| Turnout | 43,029 | 61.7 | |||
| Unionist hold | Swing | n/a | |||
| Party | Candidate | Votes | % | ± | |
|---|---|---|---|---|---|
| Unionist | Walter Greaves-Lord | 12,725 | 49.3 | -11.5 | |
| Liberal | Frank Dawson Lapthorn | 8,127 | 31.4 | +7.9 | |
| Labour | William Archer Hodgson | 5,002 | 19.3 | +3.6 | |
| Majority | 4,598 | 17.9 | -19.4 | ||
| Turnout | 43,495 | 59.4 | -2.3 | ||
| Unionist hold | Swing | -9.7 | |||
| Party | Candidate | Votes | % | ± | |
|---|---|---|---|---|---|
| Unionist | Walter Greaves-Lord | 22,178 | 71.3 | ||
| Labour | George James Anstey | 8,927 | 28.7 | ||
| Majority | 13,251 | 42.6 | |||
| Turnout | 44,315 | 70.2 | |||
| Unionist hold | Swing | +6.3 | |||
| Party | Candidate | Votes | % | ± | |
|---|---|---|---|---|---|
| Unionist | Sir Walter Greaves-Lord | 19,281 | 50.6 | -20.7 | |
| Labour | William Obrien Reeves | 11,042 | 28.9 | +0.2 | |
| Liberal | Edward Stacey Layton | 7,823 | 20.5 | n/a | |
| Majority | 8,239 | 21.7 | -20.9 | ||
| Turnout | 58,163 | 65.6 | -4.6 | ||
| Unionist hold | Swing | -10.4 | |||
Elections in the 1930s
| Party | Candidate | Votes | % | ± | |
|---|---|---|---|---|---|
| Conservative | Sir Walter Greaves-Lord | 30,851 | 81.0 | ||
| Labour | Mrs. Ann Jane Anstey | 7,217 | 19.0 | ||
| Majority | 23,634 | 62.0 | |||
| Turnout | 59,555 | 63.9 | |||
| Conservative hold | Swing | +20.2 | |||
| Party | Candidate | Votes | % | ± | |
|---|---|---|---|---|---|
| Conservative | Edwin Duncan Sandys | 16,147 | 51.1 | ||
| Labour | Barbara Bodichon Ayrton-Gould | 12,799 | 40.4 | ||
| Independent Conservative | Richard Findlay | 2,698 | 8.5 | n/a | |
| Majority | 3,348 | 10.7 | |||
| Turnout | 59,305 | 53.4 | |||
| Conservative hold | Swing | -25.7 | |||
| Party | Candidate | Votes | % | ± | |
|---|---|---|---|---|---|
| Conservative | Edwin Duncan Sandys | 24,651 | 66.9 | ||
| Labour | Charles William Gibson | 12,195 | 33.1 | ||
| Majority | 12,456 | 33.8 | |||
| Turnout | 59,219 | 62.2 | |||
| Conservative hold | Swing | +11.6 | |||
Elections in the 1940s
General Election 1939/40
Another General Election was required to take place before the end of 1940. The political parties had been making preparations for an election to take place and by the Autumn of 1939, the following candidates had been selected;
- Conservative: Edwin Duncan Sandys
- Labour:
- Liberal:
| Party | Candidate | Votes | % | ± | |
|---|---|---|---|---|---|
| Labour | Ronald Arthur Chamberlain | 16,667 | 47.3 | ||
| Conservative | Edwin Duncan Sandys | 14,644 | 41.5 | ||
| Liberal | Alfred Daniel Wintle | 3,944 | 11.2 | n/a | |
| Majority | 2,023 | 5.8 | |||
| Turnout | 49,445 | 71.3 | |||
| Labour gain from Conservative | Swing | +19.8 | |||
Elections in the 1950s
| Party | Candidate | Votes | % | ± | |
|---|---|---|---|---|---|
| Conservative | John George Smyth | 24,811 | 48.4 | ||
| Labour | Ronald Arthur Chamberlain | 22,736 | 44.3 | ||
| Liberal | Robin Bruce Fredericke | 3,770 | 7.3 | ||
| Majority | 2,075 | 4.1 | |||
| Turnout | 60,961 | 84.2 | |||
| Conservative gain from Labour | Swing | +5.0 | |||
| Party | Candidate | Votes | % | ± | |
|---|---|---|---|---|---|
| Conservative | John George Smyth | 27,200 | 52.9 | ||
| Labour | Ronald Arthur Chamberlain | 24,251 | 47.1 | ||
| Majority | 2,949 | 5.8 | |||
| Turnout | 62,231 | 82.7 | |||
| Conservative hold | Swing | +0.9 | |||
| Party | Candidate | Votes | % | ± | |
|---|---|---|---|---|---|
| Conservative | John George Smyth | 24,831 | 55.6 | ||
| Labour | James Avery Joyce | 19,799 | 44.4 | ||
| Majority | 5,032 | 11.2 | |||
| Turnout | 59,385 | 75.2 | |||
| Conservative hold | Swing | +2.7 | |||
| Party | Candidate | Votes | % | ± | |
|---|---|---|---|---|---|
| Conservative | John George Smyth | 22,958 | 52.6 | ||
| Labour | Leslie Leonard Reeves | 15,975 | 36.6 | ||
| Liberal | Dennis Raymond Chapman | 4,744 | 10.8 | n/a | |
| Majority | 6,983 | 16.0 | |||
| Turnout | 57,807 | 75.6 | |||
| Conservative hold | Swing | +2.4 | |||
Elections in the 1960s
| Party | Candidate | Votes | % | ± | |
|---|---|---|---|---|---|
| Conservative | John George Smyth | 17,624 | 45.5 | ||
| Labour | John Denis Fraser | 17,173 | 44.3 | ||
| Liberal | Dennis Raymond Chapman | 3,929 | 10.2 | ||
| Majority | 451 | 1.2 | |||
| Turnout | 57,090 | 67.8 | |||
| Conservative hold | Swing | -7.4 | |||
| Party | Candidate | Votes | % | ± | |
|---|---|---|---|---|---|
| Labour | John Denis Fraser | 19,103 | 48.8 | ||
| Conservative | W. Douglas Wilson | 16,830 | 42.9 | ||
| Liberal | Michael A. Green | 3,256 | 8.3 | ||
| Majority | 2,273 | 5.9 | |||
| Turnout | 54,592 | 71.8 | |||
| Labour gain from Conservative | Swing | +3.6 | |||
Elections in the 1970s
| Party | Candidate | Votes | % | ± | |
|---|---|---|---|---|---|
| Labour | John Denis Fraser | 16,634 | 47.4 | ||
| Conservative | Peter Temple-Morris | 16,003 | 45.6 | ||
| Liberal | Eric Hawthorne | 2,436 | 7.0 | ||
| Majority | 631 | 1.8 | |||
| Turnout | 54,432 | 64.4 | |||
| Labour hold | Swing | -2.1 | |||
| Party | Candidate | Votes | % | ± | |
|---|---|---|---|---|---|
| Labour | John Denis Fraser | 17,320 | 46.2 | ||
| Conservative | B. Hancock | 13,298 | 35.4 | ||
| Liberal | M. Drake | 6,885 | 18.4 | ||
| Majority | 4,022 | 10.8 | |||
| Turnout | 52,567 | 71.3 | |||
| Labour hold | Swing | +4.5 | |||
| Party | Candidate | Votes | % | ± | |
|---|---|---|---|---|---|
| Labour | John Denis Fraser | 16,449 | 50.2 | ||
| Conservative | B. Hancock | 11,678 | 35.7 | ||
| Liberal | Eric Hawthorne | 4,377 | 13.4 | ||
| Gay Liberal | M.J. Greatbanks | 223 | 0.7 | n/a | |
| Majority | 4,771 | 14.5 | |||
| Turnout | 52,893 | 61.9 | |||
| Labour hold | Swing | +1.9 | |||
| Party | Candidate | Votes | % | ± | |
|---|---|---|---|---|---|
| Labour | John Denis Fraser | 16,282 | 47.3 | ||
| Conservative | J. Pritchard | 14,342 | 41.7 | ||
| Liberal | D. Charlesworth | 3,051 | 8.9 | ||
| National Front | Mrs. C.M. Williams | 707 | 2.1 | n/a | |
| Majority | 1,940 | 5.6 | |||
| Turnout | 48,857 | 70.4 | |||
| Labour hold | Swing | -4.5 | |||
Elections in the 1980s
| Party | Candidate | Votes | % | ± | |
|---|---|---|---|---|---|
| Labour | John Denis Fraser | 16,280 | 44.6 | ||
| Conservative | J.P. Parfitt | 13,397 | 36.7 | ||
| Social Democratic | M.M. Noble | 6,371 | 17.5 | ||
| National Front | Mrs. C.M. Williams | 343 | 0.9 | ||
| Independent | J.C. Sanderson | 123 | 0.3 | n/a | |
| Majority | 2,883 | 7.9 | |||
| Turnout | 55,663 | 65.6 | |||
| Labour hold | Swing | +1.2 | |||
| Party | Candidate | Votes | % | ± | |
|---|---|---|---|---|---|
| Labour | John Denis Fraser | 18,359 | 48.4 | ||
| Conservative | Dominic Charles Roberts Grieve | 13,636 | 36.0 | ||
| Social Democratic | M.M. Noble | 5,579 | 14.7 | ||
| Rainbow | F.M. Jackson | 171 | 0.5 | n/a | |
| Independent Christian Democrat | R.J. Hammond | 151 | 0.4 | n/a | |
| Majority | 4,723 | 12.4 | |||
| Turnout | 56,602 | 67.0 | |||
| Labour hold | Swing | +2.3 | |||
Elections in the 1990s
| Party | Candidate | Votes | % | ± | |
|---|---|---|---|---|---|
| Labour | John Denis Fraser | 18,391 | 53.2 | +4.7 | |
| Conservative | JPE Samways | 11,175 | 32.3 | −3.7 | |
| Liberal Democrat | Mrs SJ Lawman | 4,087 | 11.8 | −2.9 | |
| Green | WSB Collins | 790 | 2.3 | n/a | |
| Natural Law | MC Leighton | 138 | 0.4 | n/a | |
| Majority | 7,216 | 20.9 | +8.4 | ||
| Turnout | 34,581 | 66.1 | −0.8 | ||
| Labour hold | Swing | +4.2 | |||
References
- 1 2 3 4 5 6 7 8 British Parliamentary Election Results 1885-1918, FWS Craig
- 1 2 3 4 5 6 The Liberal Year Book, 1907
- ↑ Debrett's House of Commons & Judicial Bench, 1886
- ↑ Debrett's House of Commons & Judicial Bench, 1901
- ↑ Debrett's House of Commons & Judicial Bench, 1901
- ↑ Debrett's House of Commons & Judicial Bench, 1916
- ↑ Debrett's House of Commons & Judicial Bench, 1916
- ↑ British Parliamentary Election Results 1918-1949, FWS Craig
- ↑ British Parliamentary Election Results 1918-1949, FWS Craig
- ↑ British Parliamentary Election Results 1918-1949, FWS Craig
- ↑ British Parliamentary Election Results 1918-1949, FWS Craig
- ↑ British Parliamentary Election Results 1918-1949, FWS Craig
- ↑ British Parliamentary Election Results 1918-1949, FWS Craig
- ↑ British Parliamentary Election Results 1918-1949, FWS Craig
- ↑ British Parliamentary Election Results 1918-1949, FWS Craig
- ↑ British Parliamentary Election Results 1950-1973, FWS Craig
- ↑ British Parliamentary Election Results 1950-1973, FWS Craig
- ↑ British Parliamentary Election Results 1950-1973, FWS Craig
- ↑ British Parliamentary Election Results 1950-1973, FWS Craig
- ↑ British Parliamentary Election Results 1950-1973, FWS Craig
- ↑ British Parliamentary Election Results 1950-1973, FWS Craig
- ↑ British Parliamentary Election Results 1950-1973, FWS Craig
- ↑ "Politics Resources". Election 1992. Politics Resources. 9 April 1992. Retrieved 6 Dec 2010.
- Leigh Rayment's Historical List of MPs – Constituencies beginning with "N" (part 3)
- Craig, F. W. S. (1989) [1974]. British parliamentary election results 1885–1918 (2nd ed.). Chichester: Parliamentary Research Services. p. 32. ISBN 0-900178-27-2.
- Craig, F. W. S. (1983) [1969]. British parliamentary election results 1918–1949 (3rd ed.). Chichester: Parliamentary Research Services. p. 36. ISBN 0-900178-06-X.
- The Constitutional Year Book 1937 (London: National Union of Conservative and Unionist Associations, 1937)