Holborn and St Pancras South (UK Parliament constituency)
| Holborn and St Pancras South | |
|---|---|
|
Former Borough constituency for the House of Commons | |
|
Holborn & St Pancras South in London 1950-74 | |
| County |
1950–1965: County of London 1965–1983: Greater London |
| 1950–1983 | |
| Number of members | One |
| Replaced by | Holborn & St Pancras |
| Created from | Holborn, St Pancras South East and St Pancras South West |
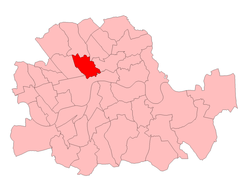
Holborn and St Pancras South was a parliamentary constituency centred on the Holborn district of Central London. It returned one Member of Parliament (MP) to the House of Commons of the Parliament of the United Kingdom, elected by the first-past-the-post voting system.
The constituency was created for the 1950 general election, and abolished for the 1983 general election, when it was largely replaced by the new constituency of Holborn and St Pancras.
Boundaries
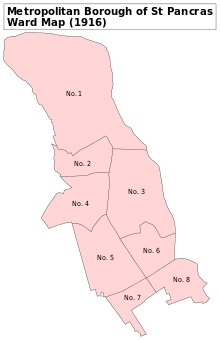
A map showing the wards of St Pancras Metropolitan Borough as they appeared in 1916.
1950-1974: The Metropolitan Borough of Holborn, and wards five, six, seven and eight of the Metropolitan Borough of St Pancras.
1974-1983: The London Borough of Camden wards of Bloomsbury, Euston, Holborn, King's Cross, Regent's Park, and St Pancras.
Members of Parliament
| Election | Member | Party | |
|---|---|---|---|
| 1950 | Santo Jeger | Labour | |
| 1953 by-election | Lena Jeger | Labour | |
| 1959 | Geoffrey Johnson Smith | Conservative | |
| 1964 | Lena Jeger | Labour | |
| 1979 | Frank Dobson | Labour | |
| 1983 | constituency abolished: see Holborn and St Pancras | ||
Election results
Elections in the 1950s
| Party | Candidate | Votes | % | ± | |
|---|---|---|---|---|---|
| Labour | Santo Wayburn Jeger | 19,223 | 48.51 | n/a | |
| Conservative | Peter John Feilding Chapman-Walker | 17,993 | 45.41 | n/a | |
| Liberal | Hilda Mary Adela Buckmaster | 2,411 | 6.08 | n/a | |
| Majority | 1,230 | 3.10 | n/a | ||
| Turnout | 72.10 | n/a | |||
| Labour win | |||||
| Party | Candidate | Votes | % | ± | |
|---|---|---|---|---|---|
| Labour | Santo Wayburn Jeger | 20,332 | 50.18 | ||
| Conservative | Louis Halle Gluckstein | 18,573 | 45.84 | ||
| Liberal | Isaac Joseph Hyam | 1,616 | 3.99 | ||
| Majority | 1,759 | 4.34 | |||
| Turnout | 73.70 | ||||
| Labour hold | Swing | ||||
| Party | Candidate | Votes | % | ± | |
|---|---|---|---|---|---|
| Labour | Lena May Jeger | 15,784 | 52.11 | ||
| Conservative | William Timothy Donovan | 13,808 | 45.59 | ||
| Liberal | Isaac Joseph Hyam | 695 | 2.29 | ||
| Majority | 1,976 | 6.52 | |||
| Turnout | 30,287 | ||||
| Labour hold | Swing | ||||
| Party | Candidate | Votes | % | ± | |
|---|---|---|---|---|---|
| Labour | Lena May Jeger | 17,126 | 49.62 | ||
| Conservative | William Timothy Donovan | 16,195 | 46.92 | ||
| Liberal | Isaac Joseph Hyam | 1,193 | 3.46 | ||
| Majority | 931 | 2.70 | |||
| Turnout | 67.30 | ||||
| Labour hold | Swing | ||||
| Party | Candidate | Votes | % | ± | |
|---|---|---|---|---|---|
| Conservative | Geoffrey Johnson Smith | 17,065 | 50.98 | ||
| Labour | Lena May Jeger | 16,409 | 49.02 | ||
| Majority | 656 | 1.96 | |||
| Turnout | 69.01 | ||||
| Conservative gain from Labour | Swing | ||||
Elections in the 1960s
| Party | Candidate | Votes | % | ± | |
|---|---|---|---|---|---|
| Labour | Lena May Jeger | 15,873 | 54.33 | ||
| Conservative | Geoffrey Johnson Smith | 13,117 | 44.90 | ||
| Independent | Ali Mohammad Bongo Abbas | 226 | 0.77 | ||
| Majority | 2,756 | 9.43 | |||
| Turnout | 67.52 | ||||
| Labour gain from Conservative | Swing | ||||
| Party | Candidate | Votes | % | ± | |
|---|---|---|---|---|---|
| Labour | Lena May Jeger | 16,128 | 59.49 | ||
| Conservative | Julian Michael Edmund Byng | 10,982 | 40.51 | ||
| Majority | 5,146 | 19.98 | |||
| Turnout | 65.54 | ||||
| Labour hold | Swing | ||||
Elections in the 1970s
| Party | Candidate | Votes | % | ± | |
|---|---|---|---|---|---|
| Labour | Lena May Jeger | 12,448 | 55.15 | ||
| Conservative | Julian Michael Edmund Byng | 10,125 | 44.85 | ||
| Majority | 2,323 | 10.29 | |||
| Turnout | |||||
| Labour hold | Swing | ||||
| Party | Candidate | Votes | % | ± | |
|---|---|---|---|---|---|
| Labour | Lena May Jeger | 12,414 | 49.31 | ||
| Conservative | Robert Frederick James Parsons | 8,223 | 32.54 | ||
| Liberal | Thomas Hibbert | 4,632 | 18.33 | ||
| Majority | 4,191 | 16.59 | |||
| Turnout | 64.81 | ||||
| Labour hold | Swing | ||||
| Party | Candidate | Votes | % | ± | |
|---|---|---|---|---|---|
| Labour | Lena May Jeger | 11,790 | 55.94 | ||
| Conservative | Robert Frederick James Parsons | 6,349 | 30.12 | ||
| Liberal | Frederick Michael John Lee | 2,938 | 13.94 | ||
| Majority | 5,441 | 25.81 | |||
| Turnout | 53.81 | ||||
| Labour hold | Swing | ||||
| Party | Candidate | Votes | % | ± | |
|---|---|---|---|---|---|
| Labour | Frank Gordon Dobson | 12,026 | 49.31 | ||
| Conservative | Simon Robert Key | 9,703 | 39.79 | ||
| Liberal | Thomas Hibbert | 2,190 | 8.98 | ||
| National Front | F Theobald | 334 | 1.37 | ||
| Workers Revolutionary | P Farrell | 134 | 0.55 | ||
| Majority | 2,323 | 9.53 | |||
| Turnout | 60.40 | ||||
| Labour hold | Swing | ||||
References
This article is issued from Wikipedia - version of the 5/29/2016. The text is available under the Creative Commons Attribution/Share Alike but additional terms may apply for the media files.