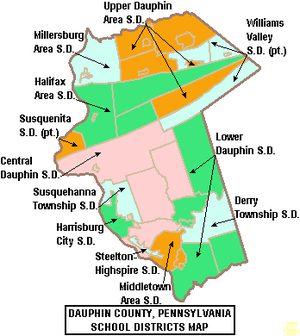
Lower Dauphin School District
| Lower Dauphin School District | |
|---|---|
 | |
| Location | |
|
Dauphin County, Pennsylvania United States | |
| Information | |
| Type | Public school district |
| Established | 1952 |
| School board | 9 locally elected Board of School Directors |
| Superintendent | Dr. Sherri L. Smith salary $145,000 (2013)[1] contract July 1, 2013 to June 30, 2018)[2] |
| Administrator |
Mrs Michelle Shuler, Business Manager, salary $104,549 (2013) |
| Staff |
224 non teaching staff (2013) |
| Faculty |
277 (2013)[3] |
| Grades | K to 12 |
| Pupils |
3,710 pupils (2015)[5] |
| • Kindergarten | 248 (2012), 255 (2010) |
| • Grade 1 | 277 (2012), 279 |
| • Grade 2 | 261 (2012), 278 |
| • Grade 3 | 306 (2012), 277 |
| • Grade 4 | 281 (2012), 314 |
| • Grade 5 | 284 (2012), 302 |
| • Grade 6 | 295 (2012), 313 |
| • Grade 7 | 327 (2012), 300 |
| • Grade 8 | 306 (2012), 335 |
| • Grade 9 | 289 (2012), 299 |
| • Grade 10 | 294 (2012), 323 |
| • Grade 11 | 311 (2012), 307 |
| • Grade 12 | 299 (2012), 298 (2010) |
| Student to teacher ratio | 14.8[4] |
| Budget |
$60.9 million (2014-2015)[9] |
| Tuition | for nonresident and charter school students ES - $9,501.29, HS - $9,163.28 [14] |
| District size | 90 sq mi (230 km2) |
| Per pupil Spending 2010 | $13,576.71 |
| Per pupil Spending 2011 | $13,777.23 (230th in PA for spending) |
| Website | www.ldsd.org |
| [15] | |
Lower Dauphin School District is a midsized, suburban public school district located in central Pennsylvania. The Lower Dauphin School District encompasses approximately 89 square miles (230 km2). The Lower Dauphin School District spans Hummelstown, Pennsylvania, East Hanover Township, Pennsylvania, Londonderry Township, Dauphin County, Pennsylvania, South Hanover Township, Pennsylvania, and Conewago Township, Dauphin County, Pennsylvania. According to 2000 federal census data it served a resident population of 22,546. By 2010, the District's population increased to 24,747 people.[16] The educational attainment levels for the Lower Dauphin School District population (25 years old and over) were 91.2% high school graduates and 28.2% college graduates.[17] The District is one of the 500 public school districts of Pennsylvania.
According to the Pennsylvania Budget and Policy Center, 20% of the District’s pupils lived at 185% or below the Federal Poverty level as shown by their eligibility for the federal free or reduced price school meal programs in 2012.[18] In 2009, the District residents' per capita income was $23,890 a year, while the median family income was $58,643.[19] In Dauphin County, the median household income was $52,371.[20] By 2013, the median household income in the United States rose to $52,100.[21]
According to District officials, in school year 2007-08, the Lower Dauphin School District provided basic educational services to 4,008 pupils through the employment of 315 teachers, 187 full-time and part-time support personnel and 20 administrators. In school year 2009-10, Lower Dauphin School District enrollment declined to 3,938 pupils. The District employed: 326 teachers, 213 full-time and part-time support personnel, and 22 administrators. Lower Dauphin School District received more than $17.3 million in state funding in school year 2009-2010.[22] In school year 2014-15, the Lower Dauphin School District enrollment declined to 3,786 pupils through the employment of 309 teachers, 200 full-time and part-time support personnel and 23 administrators.[23]
Lower Dauphin High School students may choose to attend Dauphin County Technical School for training in the construction and mechanical trades. The District is served by the Capital Area Intermediate Unit 15 which offers a variety of services, including a completely developed K-12 curriculum that is mapped and aligned with the Pennsylvania Academic Standards (available online), shared services, a group purchasing program and a wide variety of special education and special needs services.
Governance
Lower Dauphin School District is governed by 9 individually elected board members (serve four-year terms), the Pennsylvania State Board of Education, the Pennsylvania Department of Education and the Pennsylvania General Assembly.[24] The federal government controls programs it funds like Title I funding for low-income children in the Elementary and Secondary Education Act and President George W. Bush's No Child Left Behind Act, (renamed Every Student Succeeds Act (ESSA) in December 2015) which mandates the district focus resources on student success in acquiring reading and math skills.[25] The school board is required by state law to post a financial report on the district in its website by March of each school year.[26] The Superintendent and Business Manager are appointed by the school board. The Superintendent is the chief administrative officer with overall responsibility for all aspects of operations, including education and finance. The Business Manager is responsible for budget and financial operations. Neither of these officials are voting members of the School Board. The School Board enters into individual employment contracts for these positions. These contracts must be in writing and are subject to public discloure under the state’s Right to Know Act. In Pennsylvania, public school districts are required to give 150 days notice to the Superintendent regarding renewal of the employment contract.[27] Pursuant to Act 141 of 2012 which amended the Pennsylvania School Code, all school districts that have hired superintendents on/after the fall of 2012 are required to develop objective performance standards and post them on the district’s website.[28]
The Commonwealth Foundation for Public Policy Alternatives Sunshine Review gave the school board and district administration a "F" for transparency based on a review of "What information can people find on their school district's website". It examined the school district's website for information regarding; taxes, the current budget, meetings, school board members names and terms, contracts, audits, public records information and more.[29]
Schools
The High School building is located in Hummelstown, as well as its administrative building, Price School building, and one of the elementary schools. The school district was first established in the early 1950s.
- Elementary Schools
- Conewago Elementary School - Principal- Edward Gnall
- East Hanover Elementary School - Principal- Gary Messinger
- Londonderry Elementary School - Principal- Michael Lausch
- Nye Elementary School - Principal- Douglas Winner
- South Hanover Elementary School - Justin Hanula
- Secondary Schools
- Lower Dauphin Middle School - Principal- Daniel Berra
- Price School - alternative education and online program grades 6-11
- Lower Dauphin High School - Principal- Todd Neuhard
Academic achievement
In 2015, the Lower Dauphin School District ranked 76th out of out of 496 Pennsylvania public school districts, by the Pittsburgh Business Times.[30] The ranking is based on the last 3 years of student academic achievement as demonstrated by PSSAs results in: reading, writing, math and science and the three Keystone Exams (literature, Algebra 1, Biology I) in high school.[31] Three school districts were excluded because they do not operate high schools (Saint Clair Area School District, Midland Borough School District, Duquesne City School District). The PSSAs are given to all children in grades 3rd through 8th. Adapted PSSA examinations are given to children in the special education programs. Writing exams were given to children in 5th and 8th grades.
- Overachievers Ranking
In 2012, the Pittsburgh Business Times reported an Overachievers Ranking for 498 Pennsylvania school districts. Lower Dauphin ranked 340th. The paper describes the ranking as: "answers the question - which school districts do better than expectations based upon economics? This rank takes the Honor Roll rank and adds the percentage of students in the district eligible for free and reduced-price lunch into the formula. A district finishing high on this rank is smashing expectations, and any district above the median point is exceeding expectations."[37]
- 2011 - 327th
- 2010 - 335th [38]
- 2009 - 341st
AYP history
In 2012, Lower Dauphin School District declined to Warning Adequate Yearly Progress (AYP) status.[39] In 2011, Lower Dauphin School District achieved AYP status. From 2006 through 2010 the District achieved Adequate Yearly Progress (AYP) status. In 2005, the District was in Making Progress School Improvement I AYP status, while in 2004 the District declined to School Improvement I AYP status. In 2003, the District was in Warning status.[40]
Graduation rate
In 2015, Lower Dauphin School District's graduation rate was 92.95%.[41]
- 2014 - 93.86%.[42]
- 2013 - 93.46%.[43]
- 2012 - 93%.[44]
- 2011 - 96%.[45]
- 2010 - 95%, the Pennsylvania Department of Education issued a new, 4-year cohort graduation rate.[46]
- According to traditional graduation rate calculations
High School
Lower Dauphin High School is located at 201 S Hanover Street, Hummelstown. In 2015, enrollment was reported as 1,174 pupils in 9th through 12th grades, with 15.8% of pupils eligible for a free lunch due to family poverty. Additionally, 15.78% of pupils received special education services, while 2.3% of pupils were identified as gifted.[51] The school employed 88 teachers.[52] Per the Pennsylvania Department of Education, 100% of the teachers were rated "Highly Qualified" under the federal No Child Left Behind Act.
In 2013, enrollment was reported as 1,176 pupils in 9th through 12th grades, with 13% of pupils eligible for a free lunch due to family poverty. Additionally, 15% of pupils received special education services, while 5.9% of pupils were identified as gifted. The school employed 88 teachers.[53] Per the PA Department of Education 100% of the teachers were rated "Highly Qualified" under the federal No Child Left Behind Act. The school is not a federally designated Title I school.
According to the National Center for Education Statistics, in 2011, the School reported an enrollment of 1,193 pupils in grades 9th through 12th, with 184 pupils eligible for a federal free or reduced price lunch due to the family meeting the federal poverty level. In 2011, the School employed 87 teachers yielding a student-teacher ratio of 13:1.[54] According to a report by the Pennsylvania Department of Education, 100% of its teachers were rated "Highly Qualified" under No Child Left Behind.[55]
- 2015 School Performance Profile
Lower Dauphin High School declined to 84.9 out of 100. Reflects on grade level reading, mathematics and science achievement.The PDE reported that 80% of the High School’s students were on grade level in reading/literature. In Algebra 1, 78% of students showed on grade level skills at the end of the course. In Biology I, 69% demonstrated on grade level science understanding at the end of the course.[56] Statewide, 53 percent of schools with an eleventh grade achieved an academic score of 70 or better. Five percent of the 2,033 schools with 11th grade were scored at 90 and above; 20 percent were scored between 80 and 89; 28 percent between 70 and 79; 25 percent between 60 and 69 and 22 percent below 60. The Keystone Exam results showed: 73 percent of students statewide scored at grade-level in English, 64 percent in Algebra I and 59 percent in biology.[57][58]
- 2014 School Performance Profile
Lower Dauphin High School achieved 91.9 out of 100. Reflects on grade level reading, mathematics and science achievement. In reading/literature - 85% were on grade level. In Algebra 1, 77% showed on grade level skills at the end of the course. In Biology, 69% demonstrated on grade level science understanding at the end of the course.[59][60] Statewide, the percentage of high school students who scored proficient and advanced in Algebra I increased to 39.7% to 40.1%. The percentage of high school students who scored proficient and advanced in reading/literature declined to 52.5%. The percentage of high school students who scored proficient and advanced in biology improved from 39.7% to 41.4%.[61]
- 2013 School Performance Profile
Lower Dauphin High School achieved 92.3 out of 100. Reflects on grade level reading, mathematics and science achievement. In reading/literature - 83.5% were on grade level. In Algebra 1, 73% showed on grade level mathematics skills. In Biology, 64% showed on grade level science understanding.[62] According to the Pennsylvania Department of Education, 2,181 public schools (less than 73 percent of Pennsylvania public schools), achieved an academic score of 70 or higher. Pennsylvania 11th grade students no longer take the PSSAs. Instead, beginning in 2012, they take the Keystone Exams at the end of the associated course.[63]
- AYP status history
In 2012, Lower Dauphin Senior High School declined to Warning Adequate Yearly progress (AYP) status due to achieving 10 of 19 metrics measured.[64] In 2011 and 2010, Lower Dauphin Senior High School achieved AYP status.[65] In 2012, the Pennsylvania Department of Education reported that 100% of the 92 teachers at the high school were rated "highly qualified" under No Child Left Behind. The school's enrollment was 1,219 students in grades 9th through 12, with 154 pupils eligible for a federal free or reduced-price lunch due to family poverty.
See Lower Dauphin High School's own wiki page for much more information.
Middle schools
Lower Dauphin Middle School is located at 251 Quarry Road, Hummelstown. In 2015, enrollment was pupils, in grades 6th through 8th, with 22.8% of pupils eligible for a free lunch due to family poverty. Additionally, 16% of pupils received special education services, while 6% of pupils were identified as gifted.[66] According to a 2015 report by the Pennsylvania Department of Education, 100% of its teachers were rated "Highly Qualified" under No Child Left Behind.[67]
In 2013, Lower Dauphin Middle School's enrollment was 924 pupils in grades 6th through 8th, with 18% of the pupils eligible for a free or reduced price lunch due to family poverty. Additionally, 14% of pupils received special education services, while 6.49% are identified as gifted. In 2013, the attendance rate was 95.9%.[68]
- 2015 School Performance Profile
The Pennsylvania Department of Education reported that 68% of 8th grade students at Lower Dauphin Middle School students were on grade level in reading on the PSSAs given in April 2015. In math/Algebra 1, 52% of 8th grade students showed on grade level skills. In science, 73% of the school’s 8th graders demonstrated on grade level science understanding. No eighth grade writing scores were reported. In 7th grade, 69% were on grade level in reading, while 44% showed on grade level math skills. Among 6th graders, 80% were on grade level in reading and 55% were on grade level in mathematics.[69] Statewide 58% of eighth (8th) graders were on grade level in reading, while 29% demonstrated on grade level math skills. Pennsylvania 7th graders were 58% on grade level in reading and 33% demonstrated on grade level math skills. Among sixth (6th) graders, 60.7% were reading on grade level, while 39.7% demonstrated on grade level math skills.[70]
- 2014 School Performance Profile
Lower Dauphin Middle School achieved 78.3 out of 100. Reflects on grade level reading, mathematics and science achievement. In reading/literature - 80% were on grade level. In Algebra 1/Math, 84% showed on grade level mathematics skills. In Science, 71% of 8th graders showed on grade level science understanding. In writing, 83% of the 8th grade students demonstrated on grade level writing skills.[71]
- 2013 School Performance Profile
Lower Dauphin Middle School achieved 89.9 out of 100. Reflects on grade level reading, writing, mathematics and science achievement. In reading, 80% of the students were on grade level. In Mathematics/Algebra 1, 87% of the students showed on grade level skills. In Science, 76.7% of the 8th graders demonstrated on grade level understanding. In writing, 90% of the 8th grade students demonstrated on grade level writing skills.[72]
- AYP history
In 2011 and 2012, the Lower Dauphin Middle School achieved Adequate Yearly Progress (AYP) status.[73] The attendance rate was 94%.[74] In 2010, the attendance rate was 95%.[75]
- 2006 - Making Progress School Improvement Level I status.[76]
- 2005 - declined to School Improvement Level II status. Under No CHild Left Behind, the administration was mandated to inform parents of the poor academic achievement and to offer a transfer to a better achieving school within the district.
- 2004 - declined to School Improvement Level I status. The administration was required by the Pennsylvania Department of Education to develop a plan to improve academic achievement.
- 2003 - Warning AYP status due to lagging academic achievement
- PSSA results
Sixth and seventh grades have been tested in reading and mathematics since 2006. Eighth graders are tested in: reading, writing, mathematics and Science. Beginning in the Spring of 2013, eighth graders, who are enrolled in Algebra I take the Keystone Exam for Algebra I at the end of the course. The testing of 8th grade in reading and mathematics began in 1999.[77] Testing in science began in 2007. The goal is for 100% of students to be on grade level or better in reading and mathematics, by the Spring of 2014. The tests focus on the state's Academic Standards for reading, writing, mathematics and science.[78] The standards were published in 1998 and are mandated by the Pennsylvania State Board of Education.[79] In 2014, the Commonwealth adopted the Pennsylvania Core Standards - Mathematics.[80]
|
|
- 8th Grade Science:
- 2012 - 66% on grade level (13% below basic). State - 59% of 8th graders were on grade level.
- 2011 - 72% (12% below basic). State – 58.3%
- 2010 - 75%, State - 57%
- 2009 - 66%, State - 54%
- 2008 - 69%, State - 53%
|
|
|
6th Grade Math:
|
- Dropout Early Warning System
In 2013, Lower Dauphin School District did not implement a state dropout prevention Early Warning System and Interventions Catalog at the middle school.[89] The process identifies students at risk for dropping out by examining the pupil’s: attendance, behavior and course grades. Interventions are implemented to assist at-risk pupils to remain in school. The program is funded by federal and private dollars.[90]
Price School is located at 101 East High Street, Hummelstown. In 2013, the School's enrollment was 13 pupils in grades 6th through 11th, with 69% of the pupils eligible for a free or reduced price lunch due to family poverty. Additionally, 100% of pupils received special education services, while none are identified as gifted. No School Performance Profile data on annual academic achievement was made available by the State.[91]
Conewago Elementary School
Conewago Elementary School is located at 2809 Hershey Road, Elizabethtown. In 2015, the School's enrollment was 202 pupils in grades kindergarten through 6th, with 19% of pupils receiving a federal free or reduced price meals due to family poverty. Additionally, 13.8% of the pupils receive special education services, while 3.9% are identified as gifted.[92] According to a report by the Pennsylvania Department of Education, 100% of the teachers were rated highly qualified under No Child Left Behind. The school provides half day kindergarten.[93] The school is not a federally designated Title I school.
In 2013, the School's enrollment was 206 pupils in grades kindergarten through 5th, with 16.5% of pupils receiving a federal free or reduced price meals due to family poverty. Additionally, 12% of the pupils receive special education services, while 2.91% are identified as gifted.[94] According to a report by the Pennsylvania Department of Education, 100% of the teachers were rated highly qualified under No Child Left Behind. The school provides half day kindergarten.[95] The school is not a federally designated Title I school.
According to the National Center for Education Statistics, in 2011, enrollment was 188 pupils in grades K through 5th, with 24 pupils receiving a free or reduced price lunch. The School employed 13 teachers yielding a student-teacher ratio of 13:1.[96] Conewago Elementary School achieved Adequate Yearly Progress every school year from 2003 through 2012.[97]
- 2015 School Performance Profile
According to the Pennsylvania Department of Education, 89% of 5th grade students at Conewago Elementary School were on grade level in reading on the PSSAs given in April 2015. In mathematics, 68% of 5th grade students showed on grade level skills. No fifth grade writing scores were reported. In 4th grade, 87% were on grade level in reading, while 74% showed on grade level math skills. In science, 90% of fourth graders showed on grade level understanding. Among third (3rd) graders, just 66% were on grade level in reading and only 58% were on grade level in mathematics.[98] Statewide 61.9% of fifth (5th) graders were on grade level in reading, while 42.8% demonstrated on grade level math skills. Pennsylvania 4th graders were 58.6% on grade level in reading and 44.4% demonstrated on grade level math skills. In science, 77.3% of fourth graders showed on grade level understanding. Among Pennsylvania third (3rd) graders, 62% were reading on grade level, while 48.5% demonstrated on grade level math skills.[99]
- 2014 School Performance Profile
Conewago Elementary School achieved a score of 88.6 out of 100. The score reflects on grade level: reading, science, writing and mathematics achievement. In 2013-14, 86% of the students were reading on grade level in grades 3rd through 5th. In 3rd grade, 100% of the pupils were reading on grade level. In math, 94.7% were on grade level (3rd-5th grades). In 4th grade science, 88% of the pupils demonstrated on grade level understanding. In writing, 83% of 5th grade pupils demonstrated on grade level skills.[100]
- 2013 School Performance Profile
Conewago Elementary School achieved a score of 83 out of 100. The score reflects on grade level: reading, science, writing and mathematics achievement. In 2012-13, 83% of the students were reading on grade level in grades 3rd through 5th. In 3rd grade, 82% of the pupils were reading on grade level. In math, 89% were on grade level (3rd-5th grades). In 4th grade science, 90% of the pupils demonstrated on grade level understanding. In writing 86% of 5th grade pupils demonstrated on grade level writing skills.[101]
East Hanover Elementary School
East Hanover Elementary School is located at 2673 Sand Beach Road, Grantville. In 2015, East Hanover Elementary School's enrollment was 415 pupils in grades kindergarten through 5th, with 25% of pupils receiving a federal free or reduced price meals due to family poverty. Additionally, 13% of the pupils receive special education services, while 2% are identified as gifted.[102] According to a report by the Pennsylvania Department of Education, 100% of the teachers were rated highly qualified under No Child Left Behind. The school provides half day kindergarten.[103] The school is a federally designated Title I school.
In 2013, the enrollment was 402 pupils in grades Kindergarten through 5th, with 24.8% receiving a free or reduced price lunch due to family poverty. Additionally, 13.6% of the pupils receive special education services, while 2.2% are identified as gifted.[104] According to a report by the Pennsylvania Department of Education, 100% of the teachers at East Hanover Elementary School, were rated highly qualified under No Child Left Behind. The school provides half day kindergarten.[105] East Hanover Elementary School is a federally designated Title I school.
According to the National Center for Education Statistics, in 2011, enrollment was 389 pupils in grades kindergarten through 5th, with 83 pupils receiving a free or reduced price lunch. East Hanover Elementary School employed 24 teachers yielding a student-teacher ratio of 16:1.[106] East Hanover Elementary School achieved Adequate Yearly Progress each school year 2003 through 2012.[107]
- 2015 School Performance Profile
According to the Pennsylvania Department of Education, 67% of 5th grade students at East Hanover Elementary School were on grade level in reading on the PSSAs given in April 2015. In mathematics, 58% of 5th grade students showed on grade level skills. No fifth grade writing scores were reported. In 4th grade, 57% were on grade level in reading, while 48% showed on grade level math skills. In science, 78% of fourth graders showed on grade level understanding. Among third (3rd) graders, 79% were on grade level in reading and 66% were on grade level in mathematics.[108]
- 2014 School Performance Profile
East Hanover Elementary School achieved a score of 77.1 out of 100. The score reflects on grade level: reading, science, writing and mathematics achievement. In 2013-14, 79% of the students were reading on grade level in grades 3rd through 5th. In 3rd grade, 79% of the pupils were reading on grade level. In math, 84% were on grade level (3rd-5th grades). In 4th grade science, 87% of the pupils demonstrated on grade level understanding. In writing, only 59% of 5th grade pupils demonstrated on grade level skills.[109]
- 2013 School Performance Profile
East Hanover Elementary School achieved a score of 82.2 out of 100. The score reflects on grade level: reading, science, writing and mathematics achievement. In 2012-13, 78% of the students were reading on grade level in grades 3rd through 5th. In 3rd grade, 81% of the pupils were reading on grade level. In math, 81% were on grade level (3rd-5th grades). In 4th grade science, 85.9% of the pupils demonstrated on grade level understanding. In writing, 83% of 5th grade pupils demonstrated on grade level skills.[110]
Londonderry Elementary School
Londonderry Elementary School is located at 260 Schoolhouse Road, Middletown. In 2015, the School's enrollment was 280 pupils in grades kindergarten through 5th, with 33.9% of pupils receiving a federal free or reduced price meals due to family poverty. Additionally, 18.9% of the pupils receive special education services, while 3.9% are identified as gifted.[111] According to a report by the Pennsylvania Department of Education, 100% of the teachers were rated highly qualified under No Child Left Behind. Londonderry Elementary School provides half day kindergarten.[112] The school is a federally designated Title I school.
In 2013, Londonderry Elementary School enrollment was 341 pupils in grades kindergarten through 5th, with 41% of pupils receiving a federal free or reduced price meals due to family poverty. Additionally, 22% of the pupils receive special education services, while 1.17% are identified as gifted.[113] According to a report by the Pennsylvania Department of Education, 100% of the teachers were rated highly qualified under No Child Left Behind. The school provides half day kindergarten.[114] The school was a federally designated Title I school.
According to the National Center for Education Statistics, in 2010, enrollment was 343 pupils in grades kindergarten through 5th, with 138 pupils receiving a free or reduced price lunch. Londonderry Elementary School employed 32 teachers yielding a student-teacher ratio of 11:1.[115] In 2012, Londonderry Elementary School declined to Warning AYP status due to lagging student achievement in reading and mathematics. In 2011, the School achieved AYP status.[116][117] From 2033 through 2010, Londonderry Elementary School achieved AYP status each school year.
- 2015 School Performance Profile
According to the Pennsylvania Department of Education, 73% of 5th grade students at Londonderry Elementary School were on grade level in reading on the PSSAs given in April 2015. In mathematics, 47% of 5th grade students showed on grade level skills. No fifth grade writing scores were reported. In 4th grade, 72% were on grade level in reading, while 63% showed on grade level math skills. In science, 88% of fourth graders showed on grade level understanding. Among third (3rd) graders, 82% were on grade level in reading and 75% were on grade level in mathematics.[118]
- 2014 School Performance Profile
Londonderry Elementary School achieved a score of 71.6 out of 100. The score reflects on grade level: reading, science, writing and mathematics achievement. In 2013-14, 79% of the students were reading on grade level in grades 3rd through 5th. In 3rd grade, 82% of the pupils were reading on grade level. In math, 81% were on grade level (3rd-5th grades). In 4th grade science, 82% of the pupils demonstrated on grade level understanding. In writing, 47% of 5th grade pupils demonstrated on grade level skills.[119]
- 2013 School Performance Profile
Londonderry Elementary School achieved a score of 85.8 out of 100. The score reflects on grade level: reading, science, writing and mathematics achievement. In 2012-13, 81% of the students were reading on grade level in grades 3rd through 5th. In 3rd grade, 88% of the pupils were reading on grade level. In math, 80% were on grade level (3rd-5th grades). In 4th grade science, 87% of the pupils demonstrated on grade level understanding. In writing, only 65% of 5th grade pupils demonstrated on grade level writing skills.[120]
Nye Elementary School
Nye Elementary School is located at 200 South John Street, Hummelstown. In 2015, the School's enrollment was 368 pupils in grades kindergarten through 5th, with 23% of pupils receiving a federal free or reduced price meals due to family poverty. Additionally, 13.5% of the pupils receive special education services, while 2% are identified as gifted.[121] According to a report by the Pennsylvania Department of Education, 100% of the teachers were rated highly qualified under No Child Left Behind. The school provides half day and full day kindergarten.[122] The school is a federally designated Title I school.
In 2013, Nye Elementary School enrollment was 334 pupils in grades kindergarten through 5th, with 21% of pupils receiving a federal free or reduced price meals due to family poverty. Additionally, 17% of the pupils receive special education services, while 0.90% are identified as gifted.[123] According to a report by the Pennsylvania Department of Education, 100% of the teachers were rated highly qualified under the federal No Child Left Behind Act. The school provided both half day kindergarten and full day kindergarten.[124] The school is a federally designated Title I school.
- 2015 School Performance Profile
According to the Pennsylvania Department of Education, 80% of 5th grade students at Nye Elementary School were on grade level in reading on the PSSAs given in April 2015. In mathematics, 51% of 5th grade students showed on grade level skills. No fifth grade writing scores were reported. In 4th grade, 70% were on grade level in reading, while 52% showed on grade level math skills. In science, 85% of fourth graders showed on grade level understanding. Among third (3rd) graders, 68% were on grade level in reading and 60% were on grade level in mathematics.[125]
- 2014 School Performance Profile
Nye Elementary School achieved a score of 84.2 out of 100. The score reflects on grade level: reading, science, writing and mathematics achievement. In 2013-14, 84% of the students were reading on grade level in grades 3rd through 5th. In 3rd grade, 80% of the pupils were reading on grade level. In math, 89% were on grade level (3rd-5th grades). In 4th grade science, 91% of the pupils demonstrated on grade level understanding. In writing, 81% of 5th grade pupils demonstrated on grade level skills.[126]
- 2013 School Performance Profile
Nye Elementary School achieved a score of 91.9 out of 100. The score reflects on grade level: reading, science, writing and mathematics achievement. In 2012-13, 86% of the students were reading on grade level in grades 3rd through 5th. In 3rd grade, 94% of the pupils were reading on grade level. In math, 94% were on grade level (3rd-5th grades). In 4th grade science, 86% of the pupils demonstrated on grade level understanding. In writing, 88% of 5th grade pupils demonstrated on grade level skills.[127]
- AYP status
In 2003 through 2012, Nye Elementary School achieved AYP status each school year.[128][129]
South Hanover Elementary School
South Hanover Elementary School is located at 15 West 3rd Street, Hershey. In 2015, the School's enrollment was 389 pupils in grades kindergarten through 5th, with 8.7% of pupils receiving a federal free or reduced price meals due to family poverty. Additionally, 10% of the pupils receive special education services, while 5% are identified as gifted.[130] According to a report by the Pennsylvania Department of Education, 100% of the teachers were rated highly qualified under No Child Left Behind. The school provides full day kindergarten.[131] The school is not a federally designated Title I school.
In 2013, South Hanover Elementary School's enrollment was 382 pupils in grades kindergarten through 5th, with 8% of pupils receiving a federal free or reduced price meals due to family poverty. Additionally, 11% of the pupils receive special education services, while 4% are identified as gifted.[132] According to a report by the Pennsylvania Department of Education, 100% of the teachers were rated highly qualified under the federal No Child Left Behind Act. The School provides half day kindergarten.[133] The School is not a federally designated Title I school.
- 2015 School Performance Profile
According to the Pennsylvania Department of Education, 79% of 5th grade students at South Hanover Elementary School were on grade level in reading on the PSSAs given in April 2015. In mathematics, 67% of 5th grade students showed on grade level skills. No fifth grade writing scores were reported. In 4th grade, 79% were on grade level in reading, while 66% showed on grade level math skills. In science, 87% of fourth graders showed on grade level understanding. Among third (3rd) graders, 97% were on grade level in reading and 88% were on grade level in mathematics.[134]
- 2014 School Performance Profile
South Hanover Elementary School achieved a score of 84.5 out of 100. The score reflects on grade level: reading, science, writing and mathematics achievement. In 2013-14, 89% of the students were reading on grade level in grades 3rd through 5th. In 3rd grade, 90% of the pupils were reading on grade level. In math, 94% were on grade level (3rd-5th grades). In 4th grade science, 94% of the pupils demonstrated on grade level understanding. In writing, 79% of 5th grade pupils demonstrated on grade level skills.[135]
- 2013 School Performance Profile
South Hanover Elementary School achieved a score of 88.6 out of 100. The score reflects on grade level: reading, science, writing and mathematics achievement. In 2012-13, 87% of the students were reading on grade level in grades 3rd through 5th. In 3rd grade, 92% of the pupils were reading on grade level. In math, 95% were on grade level (3rd-5th grades). In 4th grade science, 91% of the pupils demonstrated on grade level understanding. In writing, 88% of 5th grade pupils demonstrated on grade level writing skills.[136]
- AYP status
From 2003 through 2012, South hanover Elementary School achieved AYP status each year.[137][138]
Special education
In December 2013, the District administration reported that 604 pupils or 15.6% of the district's pupils received Special Education services, with 37.7% of the identified students having a specific learning disability.[139] In December 2012, the District administration reported that 624 pupils or 16% of the district's pupils received Special Education services, with 38% of the identified students having a specific learning disability.[140]
In December 2010, the District administration reported that 675 pupils or 17% of the district's pupils received Special Education services, with 45% of identified students having specific learning disabilities.[141]
In 2007, Pennsylvania Secretary of Education Gerald Zahorchak testified before the Pennsylvania House Education Committee regarding full day kindergarten. He claimed that districts which offered the program would see a significant decrease in special education students due to early identification and early intervention. He asserted the high cost of full day kindergarten would be recouped by Districts in lower special education costs.[142] Lower Dauphin School District has seen a decrease in the percentage of special education students it serves, without implementing universal all-day kindergarten.
In order to comply with state and federal Individuals with Disabilities Education Act rules and regulations, Lower Dauphin School District engages in identification procedures to ensure that eligible students receive an appropriate educational program consisting of special education and related services, individualized to meet student needs. At no cost to the parents, these services are provided in compliance with state and federal law; and are reasonably calculated to yield meaningful educational benefit and student progress .[143] To identify students who may be eligible for special education services, various screening activities are conducted on an ongoing basis. These screening activities include: review of group-based data (cumulative records, enrollment records, health records, report cards, ability and achievement test scores); hearing, vision, motor, and speech/language screening; and review by the Special Education administration. When screening results suggest that the student may be eligible, the District seeks parental consent to conduct a multidisciplinary evaluation. Parents who suspect their child is eligible may verbally request a multidisciplinary evaluation from a professional employee of the District or contact the district's Special Education Department.[144][145] The IDEA 2004 requires each school entity to publish a notice to parents, in newspapers or other media, including the student handbook and website regarding the availability of screening and intervention services and how to access them.
In 2010, the state of Pennsylvania provided $1,026,815,000 for Special Education services. This funding is in addition to the state's basic education per pupil funding, as well as, all other state and federal funding.[146] The Pennsylvania Special Education funding system assumes that 16% of the district’s students receive special education services. It also assumes that each student’s needs accrue the same level of costs.[147] The state requires each district to have a three-year special education plan to meet the unique needs of its special education students.[148] Overidentification of students, in order to increase state funding, has been an issue in the Commonwealth. Some districts have more than 20% of its students receiving special education services while others have 10% supported through special education.[149] The state requires each public school district and charter school to have a three-year special education plan to meet the unique needs of its special education students.[150] In 2012, the Obama Administration's US Department of Education issued a directive requiring schools include students with disabilities in extracurricular activities, including sports.[151]
The Lower Dauphin School District received a $2,091,242 supplement for special education services in 2010.[152] For the 2011-12, 2012–13 and 2013-14 school years, all Pennsylvania public school districts received the same level of funding for special education that they received in 2010-11. This level funding is provided regardless of changes in the number of pupils who need special education services and regardless of the level of services the respective students required.[153][154] For the 2014-2015 school year, LDSD received an increase to $2,130,595 from the Commonwealth for special education funding, even though the number of pupils served has declined.[155] Additionally, the state provides supplemental funding for extraordinarily impacted students. The District must apply for this added funding.
Gifted education
The District Administration reported that 107 or 2.69% of its students were gifted in 2009. The highest percentage of gifted students reported among all 500 school districts and 100 public charter schools in Pennsylvania was North Allegheny School District with 15.5% of its students identified as gifted.[156] By law, the district must provide mentally gifted programs at all grade levels. The referral process for a gifted evaluation can be initiated by teachers or parents by contacting the student’s building principal and requesting an evaluation. All requests must be made in writing. To be eligible for mentally gifted programs in Pennsylvania, a student must have a cognitive ability of at least 130 as measured on a standardized ability test by a certified school psychologist. Other factors that indicate giftedness will also be considered for eligibility.[157][158]
While Lower Dauphin does offer Gifted Education at all levels, it is frequently requested that parents sign a Notice of Recommended Assignment, or NORA, which is written by the district to recommend that the student receive no further individual education. This request has been frequently made when the student makes the transition from middle school to high school.[159]
Budget
Pennsylvania public school districts budget and expend funds according to procedures mandated by the General Assembly and the Pennsylvania Department of Education (PDE). An annual operating budget is prepared by school district administrative officials. A uniform form is furnished by the PDE and submitted to the board of school directors for approval prior to the beginning of each fiscal year on July 1.
Under Pennsylvania’s Taxpayer Relief Act, Act 1 of the Special Session of 2006, all school districts of the first class A, second class, third class and fourth class must adopt a preliminary budget proposal. The proposal must include estimated revenues and expenditures and the proposed tax rates. This proposed budget must be considered by the Board no later than 90 days prior to the date of the election immediately preceding the fiscal year. The preliminary budget proposal must also be printed and made available for public inspection at least 20 days prior to its adoption. The board of school directors may hold a public hearing on the budget, but are not required to do so. The board must give at least 10 days’ public notice of its intent to adopt the final budget according to Act 1 of 2006.[160]
In 2013, the average teacher salary in Lower Dauphin School District was $56,698 a year.[161] In 2011, the average teacher salary in Lower Dauphin School District was $55,676 a year, while the cost of the benefits teachers receive was $16,691 per employee, for a total annual average teacher compensation of $72,367.69.[162] Lower Dauphin School District teacher and administrator retirement benefits are equal to at least 2.00% x Final Average Salary x Total Credited Service. (Some teachers benefits utilize a 2.50% benefit factor.)[163] After 40 years of service, Pennsylvania public school teachers and administrators can retire with 100% of the average salary of their final 3 years of employment. According to a study conducted at the American Enterprise Institute, in 2011, public school teachers’ total compensation is roughly 50 percent higher than they would likely receive in the private sector. The study found that the most generous benefits that teachers receive are not accounted for in many studies of compensation including: pension, retiree health benefits and job security.[164] In 2014-15, Pennsylvania public school district mandated teacher pension contribution rose to 21.40% of employee salaries and in 2015-16 it rose again to 25.84% of total salaries.[165] In 2014-15, the state mandated District contribution to the teacher pension fund rose to 21.40% of employee salaries and in 2015-16 it rose again to 25.84% of total District salaries.[166]
In 2009, Lower Dauphin School District reported employing 406 teachers and administrators, with a median salary or $55,507 and a top salary of $130,410.[167] The school year is 190 days for new teachers otherwise 189 days. Librarians and guidance counselors receive additional pay for summer time work on a daily rate. Teachers work a 7.5-hour day with a 30-minute duty-free lunch. Extra required work is paid at $30 per hour. Additionally, Lower Dauphin School District teachers receive: a defined benefit pension, health insurance (fully paid by District), dental insurance, vision insurance, liability insurance for teachers, life insurance, professional development reimbursement, 3 paid personal days, 10 paid sick days (which accumulate), Disability leave at 1/2 pay per day, 5 bereavement days and other benefits. The Teachers' union receives 10 days of paid leave to attend union functions outside of the district. Teachers may take leave for professional development with one half their salary. Teacher retirees and their spouse receive health insurance until they qualify for Medicare 100% at the District's cost.[168]
In 2007, Lower Dauphin School District employed 280 teachers. The average teacher salary in the district was $52,152 for 180 days worked.[169] As of 2007, Pennsylvania ranked in the top 10 states in average teacher salaries. When adjusted for cost of living Pennsylvania ranked fourth in the nation for teacher compensation.[170]
Administration costs Lower Dauphin School District administrative costs per pupil in 2008 was $750.69 per pupil. The lowest administrative cost per pupil in Pennsylvania was $398 per pupil.[171] The Pennsylvania School Boards Association keeps statistics on salaries of public school district employees in Pennsylvania. According to the association's report, the average salary for a superintendent for the 2007-08 school year was $122,165. Superintendents and administrators receive a benefit package commensurate with that offered to the district's teachers' union.[172] In November 2009, the school board extended the contract of Superintendent Sherri L. Smith for another five years. Smith will receive a $126,000 salary starting in the 2008-09 school year and a 3.5 percent increase each of the next four years. She will also continue to receive an extensive benefits package.[173][174]
Reserves In 2012, the Administration reported having over $12.8 million in reserves.[175] In 2008, Lower Dauphin School District reported an unreserved designated fund balance of $1,800,000 and an unreserved-undesignated fund balance of $5,732,868.[176] In 2010, Lower Dauphin School District Administration reported an increase to $7,070,308 in the unreserved-undesignated fund balance and $4,800,000 in its unreserved designated fund. Pennsylvania school district reserve funds are divided into two categories – designated and undesignated. The undesignated funds are not committed to any planned project. Designated funds and any other funds, such as capital reserves, are allocated to specific projects. School districts are required by state law to keep 5 percent of their annual spending in the undesignated reserve funds to preserve bond ratings. According to the Pennsylvania Department of Education, from 2003 to 2010, as a whole, Pennsylvania school districts amassed nearly $3 billion in reserved funds.[177]
Audits Pennsylvania Auditor General has conducted several audits of the Lower Dauphin School district. In January 2012, an audit found that Lower Dauphin School District had taken appropriate corrective action in implementing our recommendations pertaining to a certification deficiencies.[178] In 2005 there were multiple findings.[179] In 2010, the certification issue was cited again. The Bureau of School Leadership and Teacher Quality (BSLTQ) issued a final review in July 21, 2009, upholding the deficiency. The resulting subsidy forfeiture was $2,954.[180]
Per pupil spending In 2008, the Lower Dauphin School District per pupil spending was $11,584. This ranked 330th in the commonwealth.[181] In 2010, per pupil spending had risen to $13,576.71 [182] Among the states, Pennsylvania’s total per pupil revenue (including all sources) ranked 11th at $15,023 per student, in 2008-09.[183] In 2007, the Pennsylvania per pupil total expenditures was $12,759.[184]
Tax exemption In March 2012, Lower Dauphin School Board voted (8-1) to grant a six-year tax abatement for the redevelopment of the six-acre Verdelli Farms property on East Second Street in Hummelstown. The developer will not be required to pay any property taxes for six years.[185]
Lower Dauphin School District levies the following taxes: a property tax, a local earned income tax - 0.5%, Occupational Assessment Tax $250 a year and a real estate transfer tax - 0.5%. Pennsylvania exempts pension and social security income from state income tax and local earned income tax. Grants can provide an opportunity to supplement school funding without raising local taxes. Interest earnings on reserve accounts also provide nontax income to the District. In the Commonwealth of Pennsylvania, pension income and Social Security income are exempted from state personal income tax and local earned income tax, regardless of the level of the individual’s personal wealth.[186] The average Pennsylvania public school teacher pension in 2011 exceeded $60,000 a year, plus they receive federal Social Security benefits: both are free of Pennsylvania state income tax and local income tax which funds local public schools.[187]
State basic education funding
According to a report from Representative Todd Stephens office, Lower Dauphin School District receives 32.3% of its annual revenue from the state.[188]
For the 2015-16 school year, Governor Tom Wolf released a partial Basic Education Funding of $4,548,102 to Lower Dauphin School District, in January 2016.[189] This was part of $10.3 billion in school funding withheld from the public schools, by the Governor since the summer of 2015. The Wolf Administration distribution allocated a total of $9,250,857 in BEF for 2015-16 school year.[190] The dispersement did not follow the new Basic Education Fair Funding formula which had been established by the Pennsylvania General Assemby in June 2015.[191][192][193] The district will also receive another $344,360 in state Ready to Learn grant.
For the 2014-15 school year, Lower Dauphin School District received $9,162,532 in State Basic Education funding. The District also received $344,360 in new Ready To Learn Block grant. The State’s enacted Education Budget includes $5,526,129,000 for the 2014-2015 Basic Education Funding.[194] The Education budget also included Accountability Block Grant funding at $100 million and $241 million in new Ready to Learn funding for public schools that focus on student achievement and academic success. The State is paying $500.8 million to Social Security on the school employees behalf and another $1.16 billion to the state teachers pension system (PSERS). In total, Pennsylvania’s Education budget for K-12 public schools is $10 billion. This was a $305 million increase over 2013-2014 state spending and the greatest amount ever allotted by the Commonwealth for its public schools.[195]
For the 2013-14 school year, Lower Dauphin School District received a 2.1% increase or $9,161,946 in Pennsylvania Basic Education Funding. This is $189,085 more than its 2012-13 state funding to the District. Additionally, Lower Dauphin School District will receive $164,878 in Accountability Block Grant funding to focus on academic achievement and level funding for special education services. Among the public school districts in Dauphin County, Derry Township School District received the highest percentage increase at 5.4%. The District has the option of applying for several other state and federal grants to increase revenues. The Commonwealth’s budget increased Basic Education Funding statewide by $123 million to over $5.5 billion. Most of Pennsylvania’s 500 public school districts received an increase of Basic Education Funding in a range of 0.9% to 4%. Eight public school districts received exceptionally high funding of 10% to 16%. The highest increase in state funding was awarded to Austin Area School District which received a 22.5% increase in Basic Education Funding.[196] The state funded the PSERS (Pennsylvania school employee pension fund) with $1,017,000,000 and Social Security payments for school employees of $495 million.[197]
For the 2012-13 school year, the Lower Dauphin School District received $8,972,861 in state Basic Education Funding.[198] The Governor's Executive Budget for 2012-2013 includes $9.34 billion for kindergarten through 12th grade public education, including $5.4 billion in basic education funding, which is an increase of $49 million over the 2011-12 budget. The state also provides $100 million for the Accountability Block grant. The state will also provide $544.4 million for School Employees’ Social Security and $856 million for School Employees’ Retirement fund called PSERS.[199] This amount is a $21,823,000 increase (0.34%) over the 2011-2012 appropriations for Basic Education Funding, School Employees' Social Security, Pupil Transportation, Nonpublic and Charter School Pupil Transportation. Since taking office, Corbett’s first two budgets have restored more than $918 million in support of public schools, compensating for the $1 billion in federal stimulus dollars lost at the end of the 2010-11 school year.
For the 2011-12 school year, Lower Dauphin School District received $8,970,099 in state Basic Education Funding.[200][201] Additionally, the district received $164,878 in Accountability Block Grant funding. The enacted Pennsylvania State Education Budget included $5,354,629,000 for the 2011-2012 Basic Education Funding appropriation. This amount is a $233,290,000 increase (4.6%) over the enacted State appropriation for 2010-2011.[202] The highest increase in state basic education funding was awarded to Duquesne City School District, which got a 49% increase in state funding for 2011-12.[203] In 2010, the district reported that 692 students received free or reduced-price lunches, due to the family meeting the federal poverty level.[204]
For the 2010-11 budget year, Lower Dauphin School District received a 5.58% increase in state basic education funding for a total of $9,903,093. In Dauphin County, the highest increase went to Susquehanna Township School District which received a 15.89% increase in state basic education funding. One hundred fifty school districts in Pennsylvania received a 2% base increase for budget year 2010-11. The highest increase in the state was given to Kennett Consolidated School District of Chester County which was given a 23.65% increase in state funding.[205] The state's hold harmless policy, regarding state basic education funding, continued where a district received at least the same amount as the year before, even where enrollment had significantly declined. The amount of increase each school district receives was set by Governor Edward G. Rendell and then Secretary of Education Gerald Zahorchak, as a part of the state budget proposal given each February. This was the second year of the Governor's policy to fund some districts at a far greater rate than others.
In the 2009-2010 budget year, the Commonwealth of Pennsylvania provided a 4.85% increase in Basic Education Funding for a total of $9,379,533 to the Lower Dauphin School District. The district also received supplemental funding for: Title I (federal funding for low-income students), for district size, a poverty supplement from the Commonwealth and more. Three school districts in Dauphin County received an increase in excess of 5%. In Dauphin County, the highest 2009 state funding increase was 10.66% for Susquehanna Township School District. Muhlenberg School District in Berks County received the highest increase in the commonwealth at 22.31%.[206] The amount of increase each school district receives is determined by then Governor Edward G. Rendell and the Secretary of Education Gerald Zahorchak through the allocation set in the state budget proposal made in February each year.[207]
The state Basic Education Funding to the Lower Dauphin School District in 2008-09 was $8,946,077.37. According to the Pennsylvania Department of Education, 588 students qualified for free or reduced-price lunch due to low family income in 2008.[208]
All Pennsylvania school districts also receive additional funding from the state through several other funding allocations, including Reimbursement of Charter School Expenditures; Special Education Funding; Secondary Career & Technical Education Subsidy; PA Accountability Grants; Ready to LEarn grants and low achieving schools were eligible for Educational Assistance Program Funding. Plus all Pennsylvania school districts receive federal dollars for various programs including: Special Education funding and Title I funding for children from low income families. In 2010, Pennsylvania spent over $24 billion for public education - local, state and federal dollars combined.[209]
Accountability Block Grant
The state provides supplemental funding in the form of accountability block grants. The use of these funds is strictly focused on specific state approved student educational achievement uses. Lower Dauphin School District uses its $447,521 to fund: increasing instructional time, to pay teachers to develop new curriculum, to lower class size for K-3rd grades and to provide Professional Development to teachers. These annual funds are in addition to the state's basic education funding.[210] Schools Districts apply each year for Accountability Block Grants.[211] In 2009-10 the state provided $271.4 million in Accountability Block grants.[212]
Ready to Learn grant
Beginning in the 2014-2015 budget, the State funded a new Ready to Learn Grant for public schools. A total of $100 million is allocated through a formula to districts based on the number of students, level of poverty of community as calculated by its market value/personal income aid ratio (MV/PI AR) and the number of English language learners. Ready to Learn Block Grant funds may be used by the Districts for: school safety; Ready by 3 early childhood intervention programs; individualized learning programs; and science, technology, engineering and math (STEM) programs.[213] Lower Dauphin School District received $344,360 in Ready to Learn Grant dollars in 2014-15 and $385,216 for 2015-16.[214]
Classrooms for the Future grant
The Classroom for the Future state program provided districts with hundreds of thousands of extra state funding to buy laptop computers for each core curriculum high school class (English, Science, History, Math) and paid for teacher training to optimize the computers use. The program was funded from 2006-2009. Lower Dauphin School District received $168,763 for funding in 2006-07. In 2007-08 the district received $300,000. For the 2008-09, school year the district received $67,347 for a total of $536,110. Of the 501 public school districts in Pennsylvania, 447 of them received Classrooms for the Future grant awards.[215]
Hybrid Learning grants
Lower Dauphin High School participated in the pilot year of the state’s Hybrid learning initiative.[216] Hybrid learning uses three learning models to increase student achievement: instruction from the teacher, group activities, and self-instruction through digital content. According to state testing results, among the pilot schools, 88 percent achieved higher academic performance in hybrid classes compared to traditional classes in the same district or statewide benchmarks, 75 percent reported better academic achievement, and all of them met or exceeded academic growth.[217] In 2013-14, the state awarded $633,000 in federal Title 2A funds to accelerate teacher training in the implementation of hybrid learning programs in 50 school buildings in 34 school entities. In 2012, $1.1 million was awarded to 15 districts to launch the first hybrid pilot schools in the state that included more than 1,900 students and 48 teachers.[218]
Environmental Education Grant
The Environmental Education Grant Program was established by the Environmental Education Act of 1993, which mandates that 5 percent of all pollution fines and penalties collected annually by the Department of Environmental Protection be set aside for environmental education. In 2010, Low Dauphin School District was awarded $3,000 to enhance an on-site rain garden by installing rain barrels and coordinating a composting program.[219]
Education Assistance Grant
The state's EAP funding provides for the continuing support of tutoring services and other programs to address the academic needs of eligible students. Funds are available to eligible school districts and full-time career and technology centers (CTC) in which one or more schools have failed to meet at least one academic performance target, as provided for in Section 1512-C of the Pennsylvania Public School Code. In 2010-11, Lower Dauphin School District did not participate. Among public school districts in Dauphin County, the Halifax Area School District received $25,743.[220]
Other grants
Lower Dauphin School District did not participate in: PA Science Its Elementary grants (discontinued effective with 2009-10 budget by Governor Rendell), 2012 Striving Readers Comprehensive Literacy Grant, nor the federal 21st Century Learning grants.
Federal funding
The Lower Dauphin School District received an extra $2,199,655 in ARRA - Federal Stimulus money to be used in specific programs like special education and meeting the academic needs of low-income students.[221] The funding was limited to the 2009-10 and 2010-2011 school years.[222] Due to the temporary nature of the funding, schools were repeatedly advised to use the funds for one-time expenditures like acquiring equipment, making repairs to buildings, training teachers to provide more effective instruction or purchasing books and software.
Race to the Top grant
School district officials did not apply for the Race to the Top federal grant which would have brought the district over one million additional federal dollars for improving student academic achievement.[223] Participation required the administration, the school board and the local teachers' union to sign an agreement to prioritize improving student academic success. In Pennsylvania, 120 public school districts and 56 charter schools agreed to participate.[224] Pennsylvania was not approved for a grant. The failure of districts to agree to participate was cited as one reason that Pennsylvania was not approved.[225]
Title II grants
The Federal government provides annual grants to schools to be used to improve the quality of teacher instructions to pupils. The goal is provide each child in public schools with “Highly Quality” teachers and principals as defined by the state.[226] The funds are sent to the state Department of Education which distributes them to each school district and charter school.[227] Beginning in 2002, the federal funding committed to Title II was $3,175,000,000.
Public school district administrations must apply to the state annually for the Title II funds. In 2012-13, Lower Dauphin School District received $90,460 in federal Title II funding.[228] In 2014-15, Lower Dauphin School District applied for and received $82,896.[229]
English language learners grant
The Federal government provides annual grants to schools to assist in educating immigrant children and children who are identified as limited English proficient.[230] Upon registering for school a language survey is done for all new enrollment pupils, typically in kindergarten or preschool. They identify the primary language spoken at home. This data is collected and submitted to the Pennsylvania Department of Education, which in turn notifies the federal government.[231]
In 2012-13, Lower Dauphin School District received $8,419 in Title III funding for English language learners.[232] For 2014-15, Lower Dauphin School District received $15,113 in Title III funding.[233]
Common Cents state initiative
The Lower Dauphin School Board chose to not participate in the Pennsylvania Department of Education Common Cents program. The program called for the state to audit the district, at no cost to local taxpayers, to identify ways the district could save tax dollars.[234] After the review of the information, the district was not required to implement the recommended cost savings changes.
Real estate taxes
Property tax rates in 2015-16 were set by the Lower Dauphin School Board at 18.4200 mills.[235] A mill is $1 of tax for every $1,000 of a property's assessed value. Irregular property reassessments have become a serious issue in the commonwealth as it creates a significant disparity in taxation within a community and across a region. On the local level, Pennsylvania district revenues are dominated by two main sources: 1) Property tax collections, which account for the vast majority (between 75-85%) of local revenues; and 2) Act 511 tax collections, which are around 15% of revenues for school districts.[236] in Pennsylvania apply only to real estate - land and buildings. The property tax is not levied on cars, business inventory, or other personal property. Certain types of property are exempt from property taxes, including: places of worship, places of burial, private social clubs, charitable and educational institutions and government property. Additionally, service related, disabled US military veterans may seek an exemption from paying property taxes. According to Pennsylvania tax policy, unlike other states, natural gas and oil pipelines are exempted from property taxes.[237] Irregular property reassessments have become a serious issue in the commonwealth as it creates a significant disparity in taxation within a community and across a region. In 2008, the total amount of property tax collected by Pennsylvania public school districts collected statewide declined for the first time since 1980.[238]
According to a report prepared by the Pennsylvania Department of Education, the total real estate taxes collected by all school districts in Pennsylvania rose from $6,474,133,936 in 1999-00 to $10,438,463,356 in 2008-09.[249] The average yearly property tax paid by Dauphin County residents amounts to about 3.48% of their yearly income. Dauphin County is ranked 382nd of the 3143 United States counties for property taxes as a percentage of median income.[250]
Act 1 Adjusted index
The Act 1 of 2006 Index regulates the rates at which each school district can raise property taxes in Pennsylvania. Districts are not allowed to raise taxes above that index unless they allow voters to vote by referendum, or they seek an exception from the state Department of Education. The base index for the 2011-2012 school year is 1.4 percent, but the Act 1 Index can be adjusted higher, depending on a number of factors, such as property values and the personal income of district residents. Act 1 included 10 exceptions, including: increasing pension costs, increases in special education costs, a catastrophe like a fire or flood, increase in health insurance costs for contracts in effect in 2006 or dwindling tax bases. The base index is the average of the percentage increase in the statewide average weekly wage, as determined by the PA Department of Labor and Industry, for the preceding calendar year and the percentage increase in the Employment Cost Index for Elementary and Secondary Schools, as determined by the Bureau of Labor Statistics in the U.S. Department of Labor, for the previous 12-month period ending June 30. For a school district with a market value/personal income aid ratio (MV/PI AR) greater than 0.4000, its index equals the base index multiplied by the sum of .75 and its MV/PI AR for the current year.[251]
The School District Adjusted Index for the Lower Dauphin School District 2006-2007 through 2010-2011.[252]
|
For the 2015-16 budget year, Lower Dauphin School Board did not apply for any exceptions to exceed their Act 1 Index limit. For the school budget 2015-16, 310 Pennsylvania public school districts adopted a resolution certifying that tax rates would not be increased above its Act 1 Index limit. Another 187 school districts adopted a preliminary budget leaving open the option of exceeding the Index limit. Regarding the pension costs exception, 172 school districts received approval to exceed the Index limit in full, while others received a partial approval of their request. For special education costs, 119 districts received approval to exceed their tax limit. No Pennsylvania public school districts received an approval for the grandfathered construction debts exception.[258]
For the 2014-15 budget year, Lower Dauphin School Board did not apply for exceptions to exceed their Act 1 Index limit. In 2014-15, all Pennsylvania school districts were required to make a 21.4% of payroll payment to the teacher’s pension fund (PSERS).[259] For the school budget 2014-15, 316 Pennsylvania public school districts adopted a resolution certifying that tax rates would not be increased above its Act 1 Index limit. Another 181 school districts adopted a preliminary budget leaving open the option of exceeding the Index limit. Districts may apply for multiple exceptions each year. For the pension costs exception, 163 school districts received approval to exceed the Index in full, while others received a partial approval of their request. For special education costs, 104 districts received approval to exceed their tax limit. Seven Pennsylvania public school districts received an approval for the grandfathered construction debts exception.[260]
For the 2013-14 budget year, Lower Dauphin School Board did not apply for exceptions to exceed their Act 1 Index limit. For the school budget year 2013-14, 311 Pennsylvania public school districts adopted a resolution certifying that tax rates would not be increased above their index. Another 171 school districts adopted a preliminary budget leaving open the option of exceeded the Index limit. For the exception for pension costs, 89 school districts received approval to exceed the Index in full while others received a partial approval of their request. For special education costs, 75 districts received approval to exceed their tax limit. For the pension costs exception, 169 school districts received approval to exceed the Index. Eleven Pennsylvania public school districts received an approval for grandfathered construction debts.[261]
For the 2012-13 budget year, Lower Dauphin School Board did not apply for exceptions to exceed the Act 1 Index. For 2012-2013, 274 school districts adopted a resolution certifying that tax rates would not be increased above their index; 223 school districts adopted a preliminary budget leaving open the option of exceeded the Index limit. For the exception for pension costs, 194 school districts received approval to exceed the Index. For special education costs, 129 districts received approval to exceed the tax limit. For the exception for pension costs, 194 school districts received approval to exceed the Index. For special education costs, 129 districts received approval to exceed the tax limit.[262]
For the 2011-12 school year, the Lower Dauphin School Board did not apply for an exception to exceed the Act 1 Index. Each year, the School Board has the option of adopting either 1) a resolution in January certifying they will not increase taxes above their index or 2) a preliminary budget in February. A school district adopting the resolution may not apply for referendum exceptions or ask voters for a tax increase above the inflation index. A specific timeline for these decisions is published annually, by the Pennsylvania Department of Education.[263]
According to a state report, for the 2011-2012 school year budgets, 247 school districts adopted a resolution certifying that tax rates would not be increased above their index; 250 school districts adopted a preliminary budget. Of the 250 school districts that adopted a preliminary budget, 231 adopted real estate tax rates that exceeded their index. Tax rate increases in the other 19 school districts that adopted a preliminary budget did not exceed the school district’s index. Of the districts who sought exceptions: 221 used the pension costs exemption and 171 sought a Special Education costs exemption. Only 1 school district sought an exemption for Nonacademic School Construction Project, while 1 sought an exception for Electoral debt for school construction.[264]
In 2010-11 and 2009-10, the Lower Dauphin School Board did not apply for exceptions to exceed the Act 1 index for the budgets in either year.[265][266]
According to a state report, for the 2011-2012 school year budgets, 247 school districts adopted a resolution certifying that tax rates would not be increased above their index; 250 school districts adopted a preliminary budget. Of the 250 school districts that adopted a preliminary budget, 231 adopted real estate tax rates that exceeded their index. Tax rate increases in the other 19 school districts that adopted a preliminary budget did not exceed the school district’s index. Of the districts who sought exceptions 221 used the pension costs exemption and 171 sought a Special Education costs exemption. Only 1 school district sought an exemption for Nonacademic School Construction Project, while 1 sought an exception for Electoral debt for school construction.[264]
In the Spring of 2010, 135 Pennsylvania school boards asked to exceed their adjusted index. Approval was granted to 133 of them and 128 sought an exception for pension costs increases.[267]
Property tax relief
In 2013, Area School District 6,825 approved homestead properties received $197 each.[268] The decline in amount was related to more residents applying for tax relief and a decline in table games tax revenues. The amount received by the District must be divided equally among all approved residences.[269]
In 2009, the Homestead/Farmstead Property Tax Relief from gambling for the Lower Dauphin School District was $211 per approved permanent primary residence. In the district, 6,380 property owners applied for the tax relief. In Dauphin County, the highest amount of tax relief in 2009, went to Harrisburg School District at $446.[270] The tax relief was subtracted from the total annual school property tax bill. Property owners apply for the relief through the county Treasurer's office. Farmers can qualify for a farmstead exemption on building used for agricultural purposes. The farm must be at least 10 contiguous acres and must be the primary residence of the owner. Farmers can qualify for both the homestead exemption and the farmstead exemption. In Dauphin County, 68.71% of eligible property owners applied for property tax relief in 2009.[271] Pennsylvania awarded the highest property tax relief to residents of the Chester-Upland School District in Delaware County at $632 per homestead and farmstead in 2010.[272]
Additionally, the Pennsylvania Property Tax/Rent Rebate program is provided for low income Pennsylvanians aged 65 and older; widows and widowers aged 50 and older; and people with disabilities age 18 and older. The income limit is $35,000 for homeowners. The maximum rebate for both homeowners and renters is $650. Applicants can exclude one-half (1/2) of their Social Security income, consequently individuals whose income is substantially more than $35,000 may still qualify for a rebate. Individuals must apply annually for the rebate. This can be taken in addition to Homestead/Farmstead Property Tax Relief.[273]
Property taxes in Pennsylvania are relatively high on a national scale. According to the Tax Foundation, Pennsylvania ranked 11th in the U.S. in 2008 in terms of property taxes paid as a percentage of home value (1.34%) and 12th in the country in terms of property taxes as a percentage of income (3.55%).[274]
Wellness policy
Lower Dauphin School Board established a district wellness policy in 2006 - Policy 246.[275] The policy deals with nutritious meals served at school, the control of access to some foods and beverages during school hours, age appropriate nutrition education for all students, and physical education for students K-12. The policy is in response to state mandates and federal legislation (P.L. 108 - 265). The law dictates that each school district participating in a program authorized by the Richard B. Russell National School Lunch Act (42 U.S.C. 1751 et seq) or the Child Nutrition Act of 1966 (42 U.S.C. 1771 et seq) "shall establish a local school wellness policy by School Year 2006."
The legislation placed the responsibility of developing a wellness policy at the local level so the individual needs of each district can be addressed. According to the requirements for the Local Wellness Policy, school districts must set goals for nutrition education, physical activity, campus food provision, and other school-based activities designed to promote student wellness. Additionally, districts were required to involve a broad group of individuals in policy development and to have a plan for measuring policy implementation. Districts were offered a choice of levels of implementation for limiting or prohibiting low nutrition foods on the school campus. In final implementation these regulations prohibit some foods and beverages on the school campus.[276] The Pennsylvania Department of Education required the district to submit a copy of the policy for PDE approval.
For the 2010-11 school year, Lower Dauphin had 698 students who qualified for the District's free lunch and free breakfast programs.[277] The District offers both a free school breakfast and a free or reduced-price lunch to children in low income families. All students attending the school can eat breakfast and lunch. Children from families with incomes at or below 130 percent of the federal poverty level are provided a breakfast and lunch at no cost to the family. Children from families with incomes between 130 and 185 percent of the federal poverty level can be charged no more than 30 cents per breakfast. A foster child whose care and placement is the responsibility of the State or who is placed by a court with a caretaker household is eligible for both a free breakfast and a free lunch. Runaway, homeless and Migrant Youth are also automatically eligible for free meals.[278] The meals are partially funded with federal dollars through the United States Department of Agriculture.[279] In 2013, the USDA issued new restrictions to foods in public schools. The rules apply to foods and beverages sold on all public school district campuses during the day. They limit vending machine snacks to a maximum of 200 calories per item. Additionally, all snack foods sold at school must meet competitive nutrient standards, meaning they must have fruits, vegetables, dairy or protein in them or contain at least 10 percent of the daily value of fiber, calcium, potassium, and Vitamin D.[280] In order to comply with the Healthy, Hunger-Free Kids Act of 2010 all US public school districts are required to raise the price of their school lunches to $2.60 regardless of the actual cost of providing the lunch.[281] The Healthy Hunger-Free Kids Act of 2010 mandates that Districts raise their full pay lunch prices every year until the price of non-subsidized lunches equals the amount the federal government reimburses schools for free meals. That subsidy in 2013-2014 was $2.93.
In 2014, President Obama ordered a prohibition of advertisements for unhealthy foods on public school campuses during the school day.[282] The Food and Drug Administration requires that students take milk as their beverage at lunch. In accordance with this law, any student requesting water in place of milk with their lunch must present a written request, signed by a doctor, documenting the need for water instead of milk.[283][284]
Lower Dauphin School District provides health services as mandated by the Commonwealth and the federal government. Nurses are available in each building to conduct annual health screenings (data reported to the PDE and state Department of Health) and to dispense prescribed medications to students during the school day. Students can be excluded from school unless they comply with all the State Department of Health’s extensive immunization mandates. School nurses monitor each pupil for this compliance.[285][286] Nurses also monitor each child's weight.[287]
Highmark Healthy High 5 grant
In 2011, Nye Elementary School in Lower Dauphin School District received funding through a Highmark Healthy High 5 grant. The School received a $6,026 which was used to purchase Wii Fit ExerGames for integration into the PE curriculum for all students in grades K-5.[288] Beginning in 2006, Highmark Foundation engaged in a 5-year, $100 million program to promote lifelong healthy behaviors in children and adolescents through local nonprofits and schools.
Extracurriculars
The school district offers a wide variety of clubs, activities and an extensive and costly sports program.[289] Article XVI-C of the Public School Code requires the disclosure of interscholastic athletic opportunities for all public secondary school entities in Pennsylvania. All school entities with grades 7-12 are required to annually collect data concerning team and financial information for all male and female athletes beginning with the 2012-13 school year and submit the information to the Pennsylvania Department of Education. Beginning with the 2013-14 school year, all non-school (booster club and alumni) contributions and purchases must also be reported to PDE.[290] Eligibility to participate is determined by the school board in policy.[291][292]
By Pennsylvania law, all K-12 students in the district, including those who attend a private nonpublic school, cyber charter school, charter school and those homeschooled, are eligible to participate in the extracurricular programs, including all athletics. They must meet the same eligibility rules as the students enrolled in the district's schools.[293][294][295]
According to PA Child Abuse Recognition and Reporting Act 126 of 2014, all volunteer coaches and all those who assist in student activities, must have criminal background checks. Like all school district employees, they must also attend an anti child abuse training once every three years.[296][297][298]
Sports
Coaches receive compensation as outlined in the teachers' union contract. When athletic competition exceeds the regular season, additional compensation is paid.[299]
According to PA Child Abuse Recognition and Reporting Act 126 of 2014, all volunteer coaches and all those who assist in student activities, must have criminal background checks. Like all school district employees, they must also attend an anti child abuse training once every three years.[296][297][298]
The District funds:
|
|
- Middle School Sports
|
|
According to PIAA directory July 2014 [300][301]
See also
References
- ↑ Tribune Live.com (2015). "PA Teacher Salaries Database".
- ↑ PDE, ED Names and addresses, 2016
- ↑ NCES, Common Core of Data Lower Dauphin School District, 2013
- 1 2 "Lower Dauphin School District". National Center for Education Statistics. Retrieved 2008-04-27.
- ↑ Pennsylvania Department of Eductaion (November 4, 2015). "Lower Dauphin School District District Fast Facts 2015".
- ↑ Pennsylvania Department of Education (October 4, 2013). "Lower Dauphin School District 2013 Fast Facts".
- ↑ Pennsylvania Department of Education, Lower Dauphin School District Enrollment and projections, July 2010
- ↑ PDE, Enrollment and Projections by LEA, July 2010
- ↑ Monica Von Dobeneck (June 11, 2014). "Lower Dauphin School District passes final budget with no tax increase". PennLive.com.
- ↑ Monica Von Dobeneck., Lower Dauphin School District will not increase taxes in 2013-14, Pennlive.com, May 6, 2013
- ↑ Stephanie Kalina-Metzger., Lower Dauphin schools raise taxes 1.8 percent, Pennlive.com, June 20, 2011
- ↑ Miller, Barbara., Lower Dauphin School District adopts budget without tax hike, Pennlive.com, June 21, 2010
- ↑ Miller, Barbara., Lower Dauphin School District adopts zero increase budget, Pennlive.com, June 22, 2009
- ↑ Pennsylvania Department of Education, Tuition rates per LEA, 2011
- ↑ About the District. Lower Dauphan School District. Retrieved on 2008-04-27.
- ↑ US Census Bureau, 2010 Census Poverty Data by Local Education Agency, 2011
- ↑ proximityone (2014). "School District Comparative Analysis Profiles".
- ↑ Pennsylvania Budget and Policy Center, Education Facts Student Poverty Concentration by LEA, 2012
- ↑ American Fact Finder, US Census Bureau, 2009
- ↑ US Census Bureau (2014). "Pennsylvania Median household income, 2006-2010 by County".
- ↑ Michael Sauter & Alexander E.M. Hess, (August 31, 2013). "America's most popular six-figure jobs". USA Today.
- ↑ Pennsylvania Auditor General (January 2012). "Performance Report Lower Dauphin School District" (PDF).
- ↑ Pennsylvania Auditor General (June 11, 2015). "Lower Dauphin School District performance audit" (PDF).
- ↑ Pennsylvania Public School Code Governance 2010
- ↑ US Department of Education (2015). "Every Student Succeeds Act".
- ↑ Pennsylvania General Assembly (2012). "Act of Jul. 12, 2012, P.L. 1142, No. 141 Section 921-A".
- ↑ Pennsylvania General Assembly, Pennsylvania School Code, 2013
- ↑ Pennsylvania General Assembly (2012). "Act of Jul. 12, 2012, P.L. 1142, No. 141".
- ↑ The Commonwealth Foundation for Public Policy Alternatives. "The Pennsylvania Project". Retrieved May 20, 2010.
- ↑ Pittsburgh Business Times (April 10, 2015). "Guide to Pennsylvania Schools Statewide School District Ranking 2015".
- ↑ Pittsburgh Business Times (April 11, 2014). "What makes up a district's School Performance Profile score?".
- ↑ Pittsburgh Business Times (April 11, 2014). "Guide to Pennsylvania Schools Statewide School District Ranking 2014".
- ↑ Pittsburgh Business Times, Statewide Honor Roll Rankings 2012, April 4, 2012
- ↑ "2011 Statewide Honor Roll Rankings". Pittsburgh Business Times. Retrieved April 2011. Check date values in:
|access-date=(help) - ↑ Pittsburgh Business Times, Statewide honor roll ranking, May 23, 2010
- ↑ "Three of top school districts in state hail from Allegheny County". Pittsburgh Business Times. May 23, 2007.
- ↑ "Overachiever statewide ranking". Pittsburgh Business Times. April 2011.
- ↑ "Overachiever statewide ranking". Pittsburgh Business Times. May 6, 2010.
- ↑ Pennsylvania Department of Education (September 21, 2012). "Lower Dauphin School District AYP Overview 2012".
- ↑ Pennsylvania Department of Education, District AYP status History, 2011
- ↑ Pennsylvania Department of Education, Lower Dauphin School District performance report 2015, November 4, 2015
- ↑ Pennsylvania Department of Education, Lower Dauphin School District performance report 2014, November 6, 2014
- ↑ Pennsylvania Department of Education, Lower Dauphin School District performance report 2013, October 4, 2013
- ↑ Pennsylvania Department of Education (2012). "LOWER DAUPHIN School District AYP Data Table 2012".
- ↑ Pennsylvania Department of Education, LOWER DAUPHIN School District AYP Data Table 2011, September 29, 2011
- ↑ Pennsylvania Department of Education (March 15, 2011). "New 4-year Cohort Graduation Rate Calculation Now Being Implemented".
- ↑ Pennsylvania Department of Education. "Lower Dauphin School District Academic Achievement Report Card 2010 data table".
- ↑ Pennsylvania Department of Education. "Lower Dauphin School District Academic Achievement Report Card 2009".
- ↑ Pennsylvania Department of Education. "Lower Dauphin School District Academic Achievement Report Card 2008".
- ↑ Pennsylvania Partnerships for Children - Pennsylvania High School Graduation Rates 2007
- ↑ Pennsylvania Department of Education (November 4, 2015). "Lower Dauphin High School Fast Facts 2015".
- ↑ US News & World Report, (2015). "Best High Schools database Lower Dauphin HIgh School,".
- ↑ U.S. News & World Report, Best High Schools, 2013
- ↑ National Center for Education Statistics, Common Core Data - Lower Dauphin High School, 2010
- ↑ Pennsylvania Department of Education, Professional Qualifications of Teachers Lower Dauphin High School 2012, September 21, 2012
- ↑ Pennsylvania Department of Education (November 4, 2015). "Lower Dauphin High School School Performance Profile 2015".
- ↑ Jan Murphy (November 4, 2015). "Report card for state's high schools show overall decline". Pennlive.com.
- ↑ Pennsylvania Department of Education (November 4, 2015). "2015 Keystone Exam School Level Data".
- ↑ Pennsylvania Department of Education (November 6, 2014). "Lower Dauphin High School Academic Performance Data 2014".
- ↑ Evamarie Socha (November 6, 2014). "Half of Valley districts see state test scores decline". The Daily Item.
- ↑ Eleanor Chute (November 21, 2014). "Pennsylvania student scores declined with reduced funding, test results show". Pittsburgh Post-Gazette.
- ↑ Pennsylvania Department of Education (October 4, 2013). "Lower Dauphin High School Academic Performance Data 2013".
- ↑ Eleanor Chute & Mary Niederberger (December 11, 2013). "New assessment shows fuller picture of Pa. schools". Pittsburgh Post-Gazette.
- ↑ Pennsylvania Department of Education (2012). "LOWER DAUPHIN Senior High School AYP Overview 2012".
- ↑ Pennsylvania Department of Education, Lower Dauphin Senior High School AYP Overview 2011, September 29, 2011
- ↑ Pennsylvania Department of Education (November 4, 2015). "Lower Dauphin Middle School Fast Facts 2015".
- ↑ Pennsylvania Department of Education, Professional Qualifications of Teachers Lower Dauphin Middle School, November 5, 2015
- ↑ Pennsylvania Department of Education (October 4, 2013). "Lower Dauphin Middle School Fast Facts 2013".
- ↑ Pennsylvania Department of Education (October 1, 2015). "2015 PSSA School Level Data".
- ↑ Pennsylvania Department of Education (October 1, 2015). "2015 PSSA State Level Data".
- ↑ Pennsylvania Department of Education (November 6, 2014). "Lower Dauphin Middle School Academic Performance Data 2014".
- ↑ Pennsylvania Department of Education (October 4, 2013). "Lower Dauphin Middle School Academic Performance Data 2013,".
- ↑ Pennsylvania Department of Education (September 29, 2011). "Lower Dauphin Middle School AYP Overview".
- ↑ Pennsylvania Department of Education (2011). "Lower Dauphin Middle School AYP Data Table 2011".
- ↑ Pennsylvania Department of Education (2010). "Lower Dauphin Middle School AYP Data Table".
- ↑ Pennsylvania Department of Education, AYP Status History by LEA and School 2003-2012, 2013
- ↑ Pennsylvania Department of Education. "IU16-PSSA 95-96 Results by School". Retrieved May 11, 2014.
- ↑ Pennsylvania Department of Education (2014). "Standards Aligned Systems".
- ↑ Pennsylvania Department of Education (2014). "State Academic Standards".
- ↑ Pennsylvania Department of Education (2014). "State Academic Standards Mathematics".
- ↑ Pittsburgh Post Gazette (October 15, 2012). "How is your school doing?".
- ↑ Pennsylvania Department of Education, Lower Dauphin Middle School Academic Achievement Report Card 2011, September 28, 2011
- ↑ Pennsylvania Department of Education, Lower Dauphin Middle School Academic Achievement Report Card 2010, October 20, 2010
- ↑ "Lower Dauphin School District PSSA Results 2009". The Morning Call.
- ↑ Pennsylvania Department of Education, Lower Dauphin School District Academic Achievement Report Card 2008, August 15, 2008
- ↑ Pennsylvania Department of Education, Lower Dauphin Middle School Academic Achievement Report Card 2007, 2007
- ↑ Pennsylvania Department of Education (September 21, 2012). "Lower Dauphin Middle School Academic Achievement Report Card 2012" (PDF).
- ↑ Pennsylvania Department of Education, Lower Dauphin Middle School Academic Achievement Report Card 2009, September 14, 2009
- ↑ Office of First Lady (September 2, 2014). "Pennsylvania First Lady and Acting Secretary of Education Announce 35 Schools Statewide Implementing Dropout Program".
- ↑ Pennsylvania Department of Education, The Early Warning System, 2014
- ↑ Pennsylvania Department of Education (November 6, 2014). "Price School Fast Facts 2014".
- ↑ Pennsylvania Department of Education (November 4, 2015). "Conewago Elementary School Fast Facts 2015".
- ↑ Pennsylvania Department of Education, School Performance Profile, Conewago Elementary School Fast Facts, 2015
- ↑ Pennsylvania Department of Education (October 4, 2013). "Conewago Elementary School Fast Facts 2013".
- ↑ Pennsylvania Department of Education, School Performance Profile, Conewago Elementary School Fast Facts, 2013
- ↑ National Center for Education Statistics, Common Core Data – Conewago Elementary School, 2011
- ↑ Pennsylvania Department of Education (September 21, 2012). "Conewago Elementary School AYP Status 2012".
- ↑ Pennsylvania Department of Education (October 1, 2015). "2015 PSSA School Level Data".
- ↑ Pennsylvania Department of Education (October 1, 2015). "2015 PSSA State Level Data".
- ↑ Pennsylvania Department of Education (November 6, 2014). "Conewago Elementary School Academic Performance Data 2014".
- ↑ Pennsylvania Department of Education (October 4, 2013). "Conewago Elementary School Academic Performance Data 2013".
- ↑ Pennsylvania Department of Education (November 4, 2015). "East Hanover Elementary School Fast Facts 2015".
- ↑ Pennsylvania Department of Education, School Performance Profile, East Hanover Elementary School Fast Facts, 2015
- ↑ Pennsylvania Department of Education (October 4, 2013). "East Hanover Elementary School Fast Facts".
- ↑ Pennsylvania Department of Education, School Performance Profile, East Hanover Elementary School Fast Facts, 2013
- ↑ National Center for Education Statistics, Common Core Data – East Hanover Elementary School, 2011
- ↑ Pennsylvania Department of Education (September 21, 2012). "East Hanover Elementary School AYP Status 2012".
- ↑ Pennsylvania Department of Education (October 1, 2015). "2015 PSSA School Level Data".
- ↑ Pennsylvania Department of Education (November 6, 2014). "East Hanover Elementary School Academic Performance Data 2014".
- ↑ Pennsylvania Department of Education (October 4, 2013). "East Hanover Elementary School Academic Performance Data 2013".
- ↑ Pennsylvania Department of Education (November 4, 2015). "Londonderry Elementary School Fast Facts 2015".
- ↑ Pennsylvania Department of Education, School Performance Profile, Londonderry Elementary School Fast Facts, 2015
- ↑ Pennsylvania Department of Education (October 4, 2013). "Londonderry Elementary School Fast Facts 2013".
- ↑ Pennsylvania Department of Education, School Performance Profile, Londonderry Elementary School Fast Facts, 2013
- ↑ National Center for Education Statistics (2011). "Common Core Data – Londonderry Elementary School".
- ↑ Pennsylvania Department of Education (September 21, 2012). "Londonderry Elementary School AYP Overview 2012".
- ↑ Pennsylvania Department of Education (September 21, 2012). "Londonderry Elementary School Academic report card 2012" (PDF).
- ↑ Pennsylvania Department of Education (October 1, 2015). "2015 PSSA School Level Data".
- ↑ Pennsylvania Department of Education (November 6, 2014). "Londonderry Elementary School Academic Performance Data 2014".
- ↑ Pennsylvania Department of Education (October 4, 2013). "Londonderry Elementary School Academic Performance Data 2013".
- ↑ Pennsylvania Department of Education (November 4, 2015). "Nye Elementary School Fast Facts 2015".
- ↑ Pennsylvania Department of Education, School Performance Profile, Nye School Fast Facts, 2015
- ↑ Pennsylvania Department of Education (October 4, 2013). "Nye Elementary School Fast Facts 2013".
- ↑ Pennsylvania Department of Education, School Performance Profile, Nye Elementary School Fast Facts 2013, 2013
- ↑ Pennsylvania Department of Education (October 1, 2015). "2015 PSSA School Level Data".
- ↑ Pennsylvania Department of Education (November 6, 2014). "Nye Elementary School Academic Performance Data 2014".
- ↑ Pennsylvania Department of Education (October 4, 2013). "Nye Elementary School Academic Performance Data 2013".
- ↑ Pennsylvania Department of Education (September 21, 2012). "Nye Elementary School AYP Overview 2012".
- ↑ Pennsylvania Department of Education (September 21, 2012). "Nye Elementary School Academic Achievement report card 2012" (PDF).
- ↑ Pennsylvania Department of Education (November 4, 2015). "South Hanover Elementary School Fast Facts 2015".
- ↑ Pennsylvania Department of Education, School Performance Profile, South Hanover Elementary School Fast Facts, 2015
- ↑ Pennsylvania Department of Education (October 4, 2013). "South Hanover Elementary School Fast Facts 2013".
- ↑ Pennsylvania Department of Education, School Performance Profile 2013, South Hanover Elementary School, 2013
- ↑ Pennsylvania Department of Education (October 1, 2015). "2015 PSSA School Level Data".
- ↑ Pennsylvania Department of Education (November 6, 2014). "South Hanover Elementary School Academic Performance Data 2014".
- ↑ Pennsylvania Department of Education (October 4, 2013). "South Hanover Elementary School Academic Performance Data 2013".
- ↑ Pennsylvania Department of Education (September 21, 2012). "South Hanover Elementary School AYP Overview 2012".
- ↑ Pennsylvania Department of Education (September 21, 2012). "South Hanover Elementary School Academic Report card 2012" (PDF).
- ↑ Pennsylvania Bureau of Special Education Services (2013). "Lower Dauphin School District Special Education Data Report LEA Performance on State Performance Plan (SPP) Targets".
- ↑ Pennsylvania Bureau of Special Education Services (2012–2013). "Lower Dauphin School District Special Education Data Report LEA Performance on State Performance Plan (SPP) Targets".
- ↑ Pennsylvania Bureau of Special Education Services (2009–2010). "Lower Dauphin School District Special Education Data Report LEA Performance on State Performance Plan (SPP) Targets".
- ↑ Gerald L. Zahorchak, D. Ed. (May 30, 2007). "House Education Committee Hearing on Governor's Proposed Increase for Accountability Block Grants Testimony for Gerald L. Zahorchak, D. Ed. Secretary, Pennsylvania Department of Education" (PDF).
- ↑ Pennsylvania Bureau of Special Education (2008). "Pennsylvania Parent Guide to Special Education Services" (PDF).
- ↑ Pennsylvania Department of Education - School District Administration (January 6, 2011). "Procedural Safeguards Notice".
- ↑ Pennsylvania Department of Education, Bureau of Special Education (September 2005). "Gaskin Settlement Agreement Overview Facts Sheet" (PDF).
- ↑ Pennsylvania Department of Education. "Pennsylvania Special Education Funding".
- ↑ Senator Patrick Browne (November 1, 2011). "Senate Education Committee Holds Hearing on Special Education Funding & Accountability".
- ↑ Pennsylvania Department of Education Amy Morton, Executive Deputy Secretary (November 11, 2011). "Public Hearing: Special Education Funding & Accountability Testimony".
- ↑ Baruch Kintisch Education Law Center (November 11, 2011). "Public Hearing: Special Education Funding & Accountability Testimony" (PDF).
- ↑ Amy Morton, Executive Deputy Secretary, Public Hearing: Special Education Funding & Accountability Testimony, Pennsylvania Department of Education, November 11, 2011
- ↑ US Department of Education, U.S. Department of Education Clarifies Schools' Obligation to Provide Equal Opportunity to Students with Disabilities to Participate in Extracurricular Athletics, January 25, 2013
- ↑ Pennsylvania Department of Education (July 2010). "Special Education Funding from Pennsylvania State_2010-2011".
- ↑ Pennsylvania Department of Education (2011). "Special Education Funding 2011-2012 Fiscal Year".
- ↑ Pennsylvania Department of Education, Investing in PA kids, April 2012
- ↑ Pennsylvania Department of Education, Special Education funding report by LEA 2014-15, July 2014
- ↑ Pennsylvania Department of Education (July 2010). "Gifted Students as Percentage of Total Enrollment by School District/Charter School" (PDF).
- ↑ Pennsylvania Department of Education and Pennsylvania School Board. "CHAPTER 16. Special Education For Gifted Students". Retrieved February 4, 2011.
- ↑ Pennsylvania Department of Education (March 26, 2010). "Special Education for Gifted Students Notice of Parental rights" (PDF).
- ↑ Pennsylvania Department of Education (March 26, 2010). "Special Education for Gifted Students Notice of Parental rights".
- ↑ Pennsylvania General Assembly, Taxpayer Relief Act, Act 1 of the Special Session of 2006, June 27, 2006
- ↑ Pennsylvania Department of Education, Investing in Pennsylvania Students, July 2013
- ↑ Pennsylvania Department of Education, Investing in Pennsylvania Students, July 2012
- ↑ Pennsylvania School Employees Retirement System (2014). "Your PSERS Benefits & Leaving Employment".
- ↑ American Enterprise Institute, (2011). "Assessing the Compensation of Public School Teachers".
- ↑ Pennsylvania School Board Association (February 27, 2015). "Pension, PSERS Background Basics".
- ↑ PSERS Board of Trustees (2015). "Fiscal Year 2015/2016 Employer Contribution Rate" (PDF).
- ↑ Asbury Park Press (2009). "PA. Public School Salaries".
- ↑ Lower Dauphin School Board (2009). "Lower Dauphin School District Teachers' Union Employment Contract 2010".
- ↑ Fenton, Jacob (2009). "Average classroom teacher salary in Dauphin County, 2006-07". The Morning Call.
- ↑ PA Delaware County Times, Teachers need to know enough is enough, April 20, 2010.
- ↑ Fenton, Jacob. Pennsylvania School District Data: Will School Consolidation Save Money?, The Morning Call, Feb 2009.
- ↑ Public School Salaries 11th Annual, Pennsylvania School Board Association, October 2009
- ↑ Long, Jeremy (November 14, 2007). "Superintendent to head LD schools 5 more years". Press And Journal.
- ↑ "Benefits of Learning". Altoona Mirror. August 2007.
- ↑ Pennsylvania Department of Education (2012). "Investing in Pennsylvania Students 2012".
- ↑ Pennsylvania Department of Education. "Fund Balances by Local Education Agency 1997 to 2008".
- ↑ Murphy, Jan., Pennsylvania's public schools boost reserves, CentreDaily Times, September 22, 2010
- ↑ Pennsylvania Auditor General Office (2012). "Lower Dauphin School District Performance Audit Report 2012" (PDF).
- ↑ Pennsylvania Auditor General Office, (2005). "Lower Dauphin School District Performance Audit Report 2005" (PDF).
- ↑ Pennsylvania Auditor General Office, (2005). "Lower Dauphin School District Performance Audit Report 2005" (PDF).
- ↑ Central Pennsylvania School Districts Spending Versus Academic Results
- ↑ Pennsylvania Department of Education (2010). "2009-10 Selected Data - 2009-10 Total Expenditures per ADM".
- ↑ United States Census Bureau (2009). "States Ranked According to Per Pupil Elementary-Secondary Public School System Finance Amounts: 2008-09" (PDF).
- ↑ US Census Bureau (2009). "Total and current expenditures per pupil in fall enrollment in public elementary and secondary education, by function and state or jurisdiction: 2006-07".
- ↑ Kalina-Metzger, Stephanie., Lower Dauphin School Board OKs tax abatement for Verdelli Farms, March 23, 2012
- ↑ Pennsylvania Department of Revenue (April 2010). "Personal Income Taxation Guidelines".
- ↑ John Finnerty (2013). "PA teachers pensions". CNHI Harrisburg Bureau.
- ↑ Pennsylvania Representative Todd Stephens (January 23, 2014). "LEEF Funding Chart 2014".
- ↑ Jan Murphey (January 4, 2016). "Here's the payout your school district gets from the partial 2015-16 state budget". Pennlive.com.
- ↑ Jennifer Wakeman (January 4, 2016). "Harrisburg releases $3.3 billion in delayed funds".
- ↑ Pennsylvania General Assembly (June 26, 2015). "Basic Education Funding Commission".
- ↑ Jan Murphy (January 6, 2016). "School funding distribution gives rise to new battle between Wolf, GOP lawmakers". PennLive.com.
- ↑ Pennsylvania Department of Education (January 2016). "Summary of State Appropriations for Education 2015-2016 Fiscal Year Education Budget".
- ↑ PDE (July 7, 2014). "Enacted Education Budget 2014-2015".
- ↑ Pennsylvania Department of Education, 2014-15 Enacted Education Budget Fast Facts, July 14, 2014
- ↑ Democrat Appropriations Committee, Report on Education funding by LEA, July 2, 2013
- ↑ Pennsylvania Office of the Budget, 2013-14 State Budget Highlights, 2013
- ↑ Senator Jake Corman (June 28, 2012). "Pennsylvania Education funding by Local School District" (PDF).
- ↑ Pennsylvania General Assembly Sen Jake Corman (June 29, 2012). "SB1466 of 2012 General Fund Appropriation".
- ↑ PA Senate Appropriations Committee (June 28, 2011). "School District 2011-12 Funding Report".
- ↑ Pennsylvania Department of Education (July 2011). "Basic Education Funding".
- ↑ Pennsylvania Department of Education (June 30, 2011). "Basic Education Funding".
- ↑ Pennsylvania Department of Education (June 30, 2011). "Basic Education Funding 2011-2012 Fiscal Year".
- ↑ Pennsylvania Department of Education, District Allocations Report 2009, 2009-10
- ↑ Pennsylvania House Appropriations Committee (June 2010). "PA Basic Education Funding-Printout2 2010-2011".
- ↑ Pennsylvania Department of Education (October 2009). "2009-2010 Funding Report by LEA".
- ↑ Office of Budget, (February 2010). "Pennsylvania Budget Proposal".
- ↑ Pennsylvania Department of Education School District Funding Report. October 2009.
- ↑ Governor's Budget Office (2014). "Past Budgets 2013-14 to 2006-07".
- ↑ Pennsylvania Department of Education. "ACCOUNTABILITY BLOCK GRANT Awards".
- ↑ Pennsylvania Department of Education. "PA-PACT Information".
- ↑ Pennsylvania Department of Education (2009). "2009–2010 Accountability block Grant Mid-year report" (PDF).
- ↑ Pennsylvania Department of Education (2013). "Passport for Learning Block Grant".
- ↑ Pennsylvania Department of Education, Ready To learn grant dispersement, January 2016
- ↑ Pennsylvania Auditor General (2008-12-22). "Special Performance Audit Classrooms For the Future grants" (PDF).
- ↑ Monica Von Dobeneck (August 19, 2013). "Lower Dauphin School District will see some changes this school year".
- ↑ Pennsylvania Department of Education Press Office (October 17, 2013). "Acting Secretary of Education Says Hybrid Learning Benefits Students; Highlights Success of First-Year Pilot Program".
- ↑ Pennsylvania Department of Education press release, Governor Corbett Announces $633,000 in Hybrid Learning Grants to 34 School Entities, May 28, 2013
- ↑ DEP Awards Grants to Promote Environmental Education, Stewardship, PA DEP Press Release, May 18, 2010.
- ↑ Pennsylvania Department of Education (2010). "Educational Assistance Program Funding 2010-2011 Fiscal Year".
- ↑ Commonwealth of Pennsylvania. "Dauphin County ARRA FUNDING Report".
- ↑ "School stimulus money". Pittsburgh Post-Gazette. March 12, 2009.
- ↑ Governor's Press Office. (January 20, 2010). "Pennsylvania's 'Race to the Top' Fueled by Effective Reforms, Strong Local Support,".
- ↑ Pennsylvania Department of Education Secretary Gerald Zahorchek (December 2009). "Pennsylvania Race to the Top Letter to Superintendents".
- ↑ U.S. Department of Education, \date=March 29, 2010. "Race to the Top Fund,".
- ↑ PDE (2015). "TITLE II, PART A - TEACHER AND PRINCIAL TRAINING & RECRUITING".
- ↑ PDE (2015). "Federal Programs".
- ↑ PDE, Title IIA egrants 2012-13, 2012
- ↑ PDE, Title IIA egrants 2014-15, 2014
- ↑ US Department of Education (September 15, 2004). "Title III — Language Instruction for Limited English Proficient and Immigrant Students".
- ↑ PDE, English As A Second Language (ESL), 2015
- ↑ PDE (2015). "Title III Supplemental Program".
- ↑ PDE, Title III Grant Allocations 2014-15, 2014
- ↑ Pennsylvania Department of Education (2007). "Common Cents program - Making Every Dollar Count".
- ↑ PDE (October 2015). "Finances RE Tax Rates 2014-15".
- ↑ Pennsylvania Department of Education, (2004). "Act 511 Tax Report,".
- ↑ Katie Colaneri (June 11, 2015). "New pipeline could mean tax bonanza for NJ towns, but for Pa.? Not so much". State Impact NPR.org.
- ↑ Pennsylvania Department of Education, Pennsylvania School Finances_AFR_Local Property Taxes Collected by Districts 2008-09, 2009
- ↑ Pennsylvania Department of Education (2014). "Real Estate Tax Rates by School District 2014-15 Real Estate Mills".
- ↑ Pennsylvania Department of Education (2013). "Real Estate Tax Millage by School District 2013".
- ↑ Pennsylvania Department of Education (2012). "Real Estate Tax Millage by School District 2013".
- ↑ Pennsylvania Department of Education (2011). "Real Estate Tax Millage by School District,".
- ↑ Pennsylvania Department of Education (2010). "Real Estate Tax Millage by School District,".
- ↑ Pennsylvania Department of Education (2009). "Real Estate Tax Millage by School District,".
- ↑ Pennsylvania Department of Revenue (2009). "Real Estate Tax Millage by School District".
- ↑ Pennsylvania Department of Education (2008). "Real Estate Tax Millage by School District,".
- ↑ Pennsylvania Department of Education, Real Estate Tax Millage by School District, 2006
- ↑ Pennsylvania Department of Education, Real Estate Tax Millage by School District, 2005
- ↑ Pennsylvania Department of Education (2009). "Pennsylvania School Finances - Summaries of Annual Financial Report Data 2008-09".
- ↑ Dauphin County Property Taxes 2012, Tax-rates.org, 2012
- ↑ Pennsylvania Department of Education 2010-11 Act 1 of 2006 Referendum Exception Guidelines.
- ↑ Pennsylvania Department of Education (May 2010). "Special Session Act 1 of 2006 School District Adjusted Index for 2006-2007 through 2011-2012,".
- ↑ Pennsylvania Department of Education, 2013-2014 School District Adjusted Index, May 2012
- ↑ Pennsylvania Department of Education, 2014-2015 School District Adjusted Index, September 2013
- ↑ Pennsylvania Department of Education, 2015-2016 School District Adjusted Index, September 2014
- ↑ Pennsylvania Department of Education (September 5, 2015). "2016-2017 School District Adjusted Index,".
- ↑ Pennsylvania Department of Education (2015). "Property Tax Relief".
- ↑ Pennsylvania Department of Education (April 2015). "Taxpayer Relief Act Special Session Act 1 of 2006 Report on Referendum Exceptions For School Year 2015-2016" (PDF).
- ↑ Pennsylvania School Employees, Retirement System, PSERS Chart showing payment mandates 2007-2020, 2014
- ↑ Pennsylvania Department of Education (April 30, 2014). "Report on Referendum Exceptions For School Year 2014-2015".
- ↑ Pennsylvania Department of Education, Report on Referendum Exceptions For School Year 2013-2014, April 2013
- ↑ Pennsylvania Department of Education, Report on Referendum Exceptions For School Year 2012-2013, March 30, 2012
- ↑ Pennsylvania Department of Education (2011). "Special Session Act 1 of 2006 the Taxpayer Relief Act information".
- 1 2 Pennsylvania Department of Education (April 2011). "Report on Exceptions".
- ↑ Pennsylvania Department of Education (April 2010). "Pennsylvania SSAct1_Act1 Exceptions Report 2010-2011 April 2010".
- ↑ Pennsylvania Department of Education (April 2010). "Pennsylvania SSAct1_Act1 Exceptions Report 2009-2010 May 2009".
- ↑ Scarcella, Frank and Pursell, Tricia, Local school tax assessments exceed state averages. The Daily Item, May 25, 2010
- ↑ Pennsylvania Department of Education (May 1, 2013). "2013-2014 Estimated State Property Tax Relief per Homestead".
- ↑ Pennsylvania Gaming Control Board (2014). "Gaming Benefits for Pennsylvanians".
- ↑ Tax Relief per Homestead 2009, Pennsylvania Department of Education Report May 1, 2009
- ↑ Special Report Pennsylvania Property Tax Relief, Auditor General Office, 2-23-2010.
- ↑ Tax Relief per Homestead 5-1-10. Report Pennsylvania Department of Education, May 2010
- ↑ Department of Revenue, (October 2010). "Pennsylvania Property Tax/Rent Rebate Program,".
- ↑ Tax Foundation (September 22, 2009). "New Census Data on Property Taxes on Homeowners,".
- ↑ Lower Dauphin School Board (June 19, 2006). "Lower Dauphin Student Services Report - Strategic Plan and the School Board Policy Manual".
- ↑ Pennsylvania Department of Education — Division of Food and Nutrition. (July 2008). "Nutrition Standards for Competitive Foods in Pennsylvania Schools for the School Nutrition Incentive,".
- ↑ PA Hunger Action Center, School Breakfast Participation Report 2010- 2011, 2011
- ↑ USDA, Child Nutrition Programs - Eligibility Manual for School Meals, 2012
- ↑ Pennsylvania Hunger Action Center, The Pennsylvania School Breakfast Report Card, 2009
- ↑ USDA, Child Nutrition Programs, June 27, 2013
- ↑ United States Department of Agriculture (2011). "Food and Nutrition Service Equity in School Lunch Pricing Fact Sheet" (PDF).
- ↑ Denver Nicks (February 25, 2014). "White House Sets New Limits on Junk Food Ads in Schools". Time Magazine.
- ↑ USDA Food and Nutrition Service (2014). "School Meals FAQ".
- ↑ Monica Eng (November 26, 2012). "Lactose intolerance: When drinking school milk makes students feel sick". Chicago Tribune.
- ↑ Pennsylvania State Department of Health (2010). "Pennsylvania Bulletin Doc. No. 10-984 School Immunizations; Communicable and Noncommunicable Diseases".
- ↑ Pennsylvania Department of Health (2014). "School Immunization Requirements".
- ↑ Pennsylvania Department of Health (2014). "Mandated School Health Screenings".
- ↑ Highmark Foundation, 2011 School Challenge Grants, 2011
- ↑ Pennsylvania Department of Education (2013). "Disclosure of Interscholastic Athletic Opportunities".
- ↑ Pennsylvania Department of Education (2013). "Interscholastic Athletic Opportunities Disclosure Form" (PDF).
- ↑ Lower Dauphin School Board, Lower Dauphin School Policy Manual Extracurriculars Policy 122
- ↑ Lower Dauphin School Board. Lower Dauphin School District Policy Manual Interscholastic Athletics Policy 123
- ↑ Pennsylvania Office of the Governor Press Release (November 10, 2005). "Home-Schooled, Charter School Children Can Participate in School District Extracurricular Activities".
- ↑ Lower Dauphin School Board (June 19, 2006). "Extracurricular Participation by Home Education Students policy 137.1" (PDF).
- ↑ Lower Dauphin School Board (June 19, 2006). "EXTRACURRICULAR PARTICIPATION BY CHARTER/CYBER CHARTER STUDENTS policy 140.1" (PDF).
- 1 2 Eleanor Chute., New Pa. law expands clearance requirements for school volunteers, employees, Pittsburgh Post-Gazette, December 15, 2014
- 1 2 Pennsylvania General Assembly (2014). "ACT 126 – Child Abuse Recognition and Reporting Act".
- 1 2 Ali Stevens., Child Protective Services Law impacts schools, WKOK.com 1070AM, January 6, 2015
- ↑ Lower Dauphin School Board, Lower Dauphin School District Teacher Union Contract, 2014
- ↑ Pennsylvania Interscholastic Athletics Association (2015). "PIAA School Directory".
- ↑ Pennsylvania Interscholastic Athletics Association, PIAA School Directory, 2012
External links
Dauphin County, Pennsylvania Schools | |||||||||||||||||||||||||||||||||||||||||||||
|---|---|---|---|---|---|---|---|---|---|---|---|---|---|---|---|---|---|---|---|---|---|---|---|---|---|---|---|---|---|---|---|---|---|---|---|---|---|---|---|---|---|---|---|---|---|
| |||||||||||||||||||||||||||||||||||||||||||||
| |||||||||||||||||||||||||||||||||||||||||||||
Coordinates: 40°12′18″N 76°39′40″W / 40.20509°N 76.66122°W