Chester Upland School District
| Chester Upland School District | |
|---|---|
 | |
| Address | |
|
1720 Melrose Avenue Chester, Pennsylvania, Delaware County 19013 United States | |
| Information | |
| Type | Public |
| Closed | Columbus Elementary School Jan 3, 2013,[1] Booker T Washington ES (2000), Chester HS - Crozier Allied Health Campus (2012), Chester HS - Science and Discovery Campus (2012), Chester Upland STEM Magnet HS (2013), Edward A Parry MS (2006), Second Chance Academy (2006)[2] |
| Superintendent | Gregory G. Shannon, (July 2013 to July 14, 2018)[3] |
| School number | NCES:4205860 |
| Chairperson |
Francis Barnes, State Appointed Receiver (2015) |
| Administrator |
Mr George Crawford, Business Manager |
| Staff | 328 non teaching staff members(2012)[5] |
| Faculty | 177 teachers (2012),[6] 268 teachers (2010) |
| Grades | K-12 |
| Age | age 3 years (Preschool) to 21 years for special education students |
| Number of students |
2,985 pupils (2014)[7] |
| • Kindergarten | 152 (2014),[11] 166 (2012), 259 (2010), 183 (2006) |
| • Grade 1 | 156 (2014), 162 (2012), 296 (2010), 233 |
| • Grade 2 | 130 (2014), 168 (2012), 223 (2010), 232 |
| • Grade 3 | 158 (2014), 194 (2012), 258 (2010), 254 |
| • Grade 4 | 160 (2014), 205 (2012), 264 (2010), 283 |
| • Grade 5 | 170 (2014), 165 (2012), 263 (2010), 244 |
| • Grade 6 | 154 (2014), 173 (2012), 314 (2010), 295 |
| • Grade 7 | 170 (2014), 266 (2012), 320 (2010), 407 |
| • Grade 8 | 239 (2014), 232 (2012), 277 (2010), 349 |
| • Grade 9 | 532 (2014), 503 (2012), 520 (2010), 503 |
| • Grade 10 | 355 (2014), 315 (2012), 498 (2010), 470 |
| • Grade 11 | 275 (2014), 257 (2012), 294 (2010), 319 |
| • Grade 12 | 235 (2014), 241 (2012), 286 (2010), 323 (2006) |
| • Other | Enrollment projected to decline to 3600 pupils by 2020 |
| Student to teacher ratio | Student/Teacher Ratio: 22:1 |
| Language | English |
| Mascot | Clippers |
| Budget |
$118 million (2014-15)[12] |
| Per Pupil Spending | $12,914 (2008) |
| Per Pupil Spending | $15,327.40 (2010) |
| Website | http://www.chesteruplandsd.org/ |
The Chester Upland School District is a midsized, urban public school district serving the City of Chester, the Borough of Upland and Chester Township in Delaware County, Pennsylvania. The Chester-Upland School District encompasses approximately 5 square miles (13 km2). According to 2000 federal census data, it served a resident population of 44,435. In 2009, the District residents' per capita income was $13,521, while the median family income was $30,900.[15] In the Commonwealth, the median family income was $49,501[16] and the United States median family income was $49,445, in 2010.[17] By 2010, the District's population declined to 41,173 people.[18] The educational attainment levels for the Chester Upland School District population (25 years old and over) were 79.8% high school graduates and 10.2% college graduates.[19]
According to the Pennsylvania Budget and Policy Center, 76.4% of the District’s pupils lived at 185% or below the Federal Poverty Level as demonstrated by their eligibility for the federal free or reduced price school meal programs in 2012.[20] In 2009, the District residents’ per capita income was $13,521, while the median family income was $30,900.[21] In the Commonwealth, the median family income was $49,501 [22] and the United States median family income was $49,445, in 2010.[23] In Delaware County, the median household income was $61,876.[24] By 2013, the median household income in the United States rose to $52,100.[25]
According to Chester-Upland School District officials, in school year 2005–06, the District had 5,003 pupils and 300 teachers, 290 full-time and part-time support personnel, and 20 administrators. Chester-Upland School District received more than $51.1 million in state funding in school year 2005–06. The District has a uniform policy which require students wear tan khaki slacks or skirts and white or navy shirts. District officials reported that the District provided basic educational services to 4,505 pupils. It employed: 343 teachers, 212 full-time and part-time support personnel, and 23 administrators during the 2009-10 school year. The District received $73.4 million in state funding in the 2009-10 school year.
Chester-Upland School District operates a high school (on two campuses) and five elementary schools. High school students may choose to attend Delaware County Technical High School for training in the construction and mechanical trades. The Delaware County Intermediate Unit IU25 provides the District with a wide variety of services like specialized education for disabled students and hearing, speech and visual disability services and professional development for staff and faculty.
History
In 2015 200 members of the area teachers' union voted to work unpaid at the start of the 2015–2016 school year.[26]
Schools
In 2011, nearly 45 percent of Chester Upland School District resident's children attend public charter schools. Many of the community's elementary students attend the K-8 Chester Community Charter School, the state's largest, which academically outperforms the district schools.[27]
- High schools
- Chester High School (Chester)
- Science and Discovery High School (Chester) opened in 2008
- Smedley Allied Health School (Chester) opened in Fall 2008, in the former Smedley Middle School
- STEM at Showalter (8th through 12th 2014)
- Primary schools
- Main Street Elementary School (Upland) PreK through 5th (2014)
- Margaret C. Stetser Elementary School (Chester) PreK through 6th (2014)
- The Village (Chester)
- Toby Farms Elementary School (Chester Township) 3rd through 8th (2014)
- Chester Upland School for the Arts (opened in 2008, plans to become a K-8 school)[28] Preschool through 5th in 2014
Turnaround school district
Chester-Upland School District is identified as a "turnaround district" due to chronic, low student academic achievement. The district is eligible to various supplemental funding like School Improvement Grants. Two of the district's nine schools achieved AYP in reading and math.[29] In 2011, Chester Upland School district is in "Corrective Action II 9th Year" due to chronic low student achievement for 12 years. It is one of three school districts in Pennsylvania that are at this low level.[30] Since 1994, the Pennsylvania Department of Education has engaged in escalating levels of intervention, including providing a wide variety of specialists for interventions, providing tens of millions in extra funding such as the Spring 2011 budget bailout of $20 million, and the mandated repeated change in governance.[31]
Governance
Chester-Upland School District is governed by nine individually elected board members who serve four-year terms, the Pennsylvania State Board of Education, the Pennsylvania Department of Education and the Pennsylvania General Assembly.[32] It is one of four Pennsylvania public school district under financial receivership and overseen by a Chief Recovery Officer. The federal government controls programs it funds like Title I funding for low-income children in the Elementary and Secondary Education Act and the No Child Left Behind Act, which mandates the district focus on reading and math skills. The Superintendent and Business Manager are appointed by the school board. The Superintendent is the chief administrative officer with overall responsibility for all aspects of operations, including education and finance. The Business Manager is responsible for budget and financial operations. Neither of these officials are voting members of the School Board. The School Board enters into individual employment contracts for these positions. In Pennsylvania, public school districts are required to give 150 days notice to the Superintendent regarding renewal of the employment contract.[33]
In 2000, the Chester-Upland School District was declared financially distressed by the Pennsylvania Department of Education, resulting in the appointment of a Special Board of Control. On March 8, 2007, Pennsylvania Secretary of Education Gerald Zahorchak issued a Declaration Concerning Reestablishment of Sound Financial Structure in Chester-Upland School District,[34] stating that the Special Board of Control of the Chester-Upland School District had operated the district for a period sufficient to reestablish a sound financial structure, and, notwithstanding the district's many serious and continuing educational performance and other problems, a sound financial structure had been reestablished in the District. As a result of this declaration, the Empowerment Board of Control was replaced by a new three-member Empowerment Board of Control to address the district's poor educational performance while managing its fiscal condition. On June 30, 2010, the Education Empowerment Act expired and the elected board assumed leadership of the district.[35]
In September 2005, Governor Edward Rendell visited the district. He called for an investigation into its management. He also called on the members of the district's Board of Control to resign. In October, Rendell announced his intent to sue the Board of Control charging a failure to improve the district's financial status and a negligence related to making critical curriculum and program changes. Since its appointment in January 2003, the Board of Control had over-spent its approved budgets by more than $19 million. This is a violation of state law.[36]
From 2006 to 2011, the student population dropped from 4,300 to 3,600, but the number of employees increased from 590 to 720, while the District’s operating budget jumped from $83 million to $114.6 million. In the fall of 2011, the District rehired or recalled dozens of furloughed professionals and other staff members at a cost of $6.45 million, even though it lacked the funds to pay the individuals.[37]
Pursuant to the School District Financial Recovery law, Act 141 of 2012,[38] Joseph P. Watkins was appointed by the State as the District’s Chief Recovery Officer in December 2012.[39] In December 2014, Pennsylvania Secretary of Education, Carolyn Dumaresq petitioned the Delaware County Court of Common Pleas to remove Joseph P. Watkins as receiver of Chester Upland School District and appoint Francis V. Barnes, Ph.D, as the district’s receiver. The action was provoked by Watkins' failure to implement the District's financial recovery plan and his failure to take significant actions to improve the district's academic programs.
Academic achievement
In July 2012, the Pennsylvania Department of Education (PDE) released a report identifying Chester-Upland School District schools as among the lowest-achieving schools for reading and mathematics in 2011. Nine CUSD schools, including Columbus Elementary School, Main Street Elementary School, Stetser Elementary School, The Village at Chester Upland, Toby Farms Elementary School, Chester Upland School of the Arts, Chester High School Crozier Allied Health School, Chester High School Science and Discovery School and Chester High School, are all among the 15% lowest-achieving schools in the Commonwealth. Parents and students may be eligible for scholarships to transfer to another public or nonpublic school through the state's Opportunity Scholarship Tax Credit Program passed in June 2012.[40] The scholarships are limited to those students whose family's income is less than $60,000 annually, with another $12,000 allowed per dependent. Maximum scholarship award is $8,500, with special education students receiving up to $15,000 for a year's tuition. Parents pay any difference between the scholarship amount and the receiving school's tuition rate. Students may seek admission to neighboring public school districts. Each year the PDE publishes the tuition rate for each individual public school district.[41] Among the four neighboring districts, the lowest tuition rate is $8,967 at Penn-Delco School District. Twenty eight public schools in Delaware County are among the lowest-achieving schools in 2011. According to the report, parents in 414 public schools (74 school districts) were offered access to these scholarships. For the 2012–13 school year, seven public school districts in Pennsylvania had all of their schools placed on the list, including: Sto-Rox School District, Chester Upland School District, Clairton City School District, Duquesne City School District, Farrell Area School District, Wilkinsburg Borough School District and Steelton-Highspire School District.[42] Funding for the scholarships comes from donations by businesses which receive a state tax credit for donating.
In 2013, Chester-Upland School District remained on the lowest performing District list. The Pennsylvania Auditor General found that "The Chester Upland School District’s Ineffective Governance Has Prevented It from Meeting Its Primary Mission of Effectively Educating Its Students through the Judicious Use of Citizen Tax Dollars."[43] In 2013 and 2014, Chester High School, Chester Upland School of Arts, Columbus Elementary School, Main Street School and Stetser Elementary School all remain on the lowest achievement list. In 2014, thirty Delaware County public schools were on the list.[44] For 2015, Chester High School, STEM at Showalter, Chester Upland School of Arts, Main Street School, Toby Farms Intermediate School and Stetser Elementary School are all on the lowest achievement list.[45] For 2015-16, thirty-one public schools operating in Delaware County are on the lowest achievement list.
In 1997, the District underwent a massive reorganization plan which included closing failing schools and shifting to a preschool-8th grade model.[46] In 2012, the District again underwent a massive reorganization involving reorganizing to preschool-5th grade and 6th through 8th grade model.[47] When the state intervened it was found that the District’s finances had widespread deviation from recommended financial practices and its annual outside audit repeated numerous exceptions, many for the second or third year in a row.
- Statewide Academic Ranking
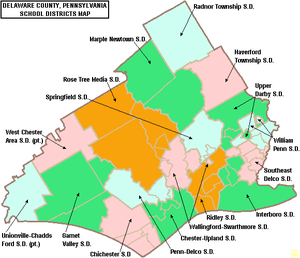
Chester-Upland School District was ranked 494th out of 498 Pennsylvania school districts in 2014, by the Pittsburgh Business Times. The ranking was based on the last three years of student academic performance on the reading, writing, math and science PSSAs.[48] The PSSAs are given to all children in grades 3rd through 8th and the 11th grade in high school. Adapted examinations are given to children in the special education programs. Chester Upland School District ranked 15th out of 15 public school districts in Delaware County. The highest ranking public school district in Delaware County was Radnor Township School District which ranked 4th statewide (2012).[49]
- 2013 – 495th[50]
- 2012 – 496th[51]
- 2011 – 496th
- 2010 – 497th[52]
- 2009 – 497th
- 2008 – 498th
- 2007 – 497th out of 498 school districts.[53]
- Statewide Overachievers Ranking
In 2011, the Pittsburgh Business Times reported an Overachievers Ranking for 498 Pennsylvania school districts. Chester-Upland School District ranked 491st. In 2010, the district ranked 497th. The paper describes the ranking as: "a ranking answers the question – which school districts do better than expectations based upon economics? This rank takes the Honor Roll rank and adds the percentage of students in the district eligible for free and reduced-price lunch into the formula. A district finishing high on this rank is smashing expectations, and any district above the median point is exceeding expectations."[54]
In January 2012, testimony before the Pennsylvania Senate Education Committee Public Hearing on Fiscally Distressed School Districts revealed that 37.3% of the district's students were on grade level in both reading and math as measured on the 2010–11 PSSAs. Statewide 75.3% of public and charter school students were on grade level in both reading and math. Additionally, only two of the district's nine schools had achieved adequate yearly progress as defined by the Pennsylvania Department of Education under No Child Left Behind. No Chester Upland school grade was performing at the statewide level of academic achievement in reading, math or science. In 2004, 22.6% of the students were achieving on grade level in reading and mathematics. At that time 60% of students statewide were on grade level in reading and math.[55]
In 2009, the academic achievement of the students of Chester Upland School District was in the bottom percentile among 500 Pennsylvania school districts. Scale - (0-99; 100 is state best)[56]
In 2011, Chester Upland School District received a $924,300 PreK Counts state grant for taxpayer-funded preschool for 119 three-year-olds and four-year-olds.[57]
District AYP data
In 2012, Chester Upland School District declined to Corrective Action II 9th Year Adequate Yearly Progress (AYP) status having failed to achieve any reading benchmarks and only 1 in 14 mathematics achievement benchmarks.[58] In 2011, Chester Upland School District declined further to Corrective Action II 9th Year Adequate Yearly Progress (AYP) status. Of the 14 Reading measures, the District achieved only one and that was using Safe Harbor, not straight student achievement. In mathematics the District achieved 4 out of 14 measures again by using Safe Harbor.[59] In 2010, Chester Upland School District declined to Corrective Action II 8th Year AYP status. In 2003, Chester Upland School District declined from School Improvement to Corrective Action Level 1 year 1. The District has never achieved Adequate Yearly Progress status in the 12 years it has been measured.[60] In 2011, 94% of Pennsylvania's 500 public school districts achieved the No Child Left Behind Act progress level of 72% of students reading on grade level and 67% of students demonstrating on grade level math. In 2011, 46.9 percent of Pennsylvania school districts achieved Adequate Yearly Progress based on student performance. An additional 37.8 percent of school districts made AYP based on a calculated method called safe harbor, 8.2 percent on the growth model and 0.8 percent on a two-year average performance.
Graduation rate
In 2013, Chester Upland School District's graduation rate was 56%.[61] In 2012, Chester Upland School District's graduation rate was 41%.[62] In 2011, the graduation rate was 50%.[63] In 2010, the Pennsylvania Department of Education issued a new, 4-year cohort graduation rate. Chester Upland School District's rate was 44% for 2010.[64]
- According to traditional graduation rate calculations
In 2007, Johns Hopkins University reported that Chester High School was among 47 Pennsylvania high schools and nationwide nearly 2000 that have expectionally high drop out rates. Nearly 8 percent of Pennsylvania's high schools had high dropout rates, with 60 percent or less of their incoming freshmen making it to graduation.[69][70][71]
College remediation rate
According to a Pennsylvania Department of Education study released in January 2009, "63% of the Chester Upland School District graduates required remediation in mathematics and or reading" before they were prepared to take college level courses in the Pennsylvania State System of Higher Education or community colleges.[72] Fewer than 66% of Pennsylvania high school graduates, who enroll in a four-year college in Pennsylvania, will earn a bachelor's degree within six years. Among Pennsylvania high school graduates pursuing an associate degree, only one in three graduate in three years.[73] Per the Pennsylvania Department of Education, one in three recent high school graduates who attend Pennsylvania's public universities and community colleges takes at least one remedial course in math, reading or English.
Dual enrollment
The district offers a dual enrollment program. This state program permits high school students to take courses, at local higher education institutions, to earn college credits. Students remain enrolled at their high school. The courses count towards high school graduation requirements and towards earning a college degree. The students continue to have full access to activities and programs at their high school. The college credits are offered at a deeply discounted rate. The state offered a small grant to assist students in costs for tuition, fees and books[74] Under the Pennsylvania Transfer and Articulation Agreement, many Pennsylvania colleges and universities accept these credits for students who transfer to their institutions.[75] For the 2009-10 funding year, the school district received a state grant of $20,260 for the program.[76]
SAT scores
In 2014, 118 Chester Upland School District students took the SAT exams. The District's Verbal Average Score was 371. The Math average score was 356. The Writing average score was 352.[77][78] Statewide in Pennsylvania, Verbal Average Score was 497. The Math average score was 504. The Writing average score was 480. The College Board also reported that nationwide scores were: 497 in reading, 513 in math and 487 in writing.[79] In 2014, 1,672,395 students took the SATs in the United States.
In 2013, 109 Chester Upland School District students took the SAT exams. The District's Verbal Average Score was 377. The Math average score was 370. The Writing average score was 366. The College Board reported that statewide scores were: 494 in reading, 504 in math and 482 in writing. The nationwide SAT results were the same as in 2012.[80]
In 2012, 152 Chester Upland School District students took the SAT exams. The District's Verbal Average Score was 357. The Math average score was 338. The Writing average score was 346. The statewide Verbal SAT exams results were: Verbal 491, Math 501, Writing 480. In the USA, 1.65 million students took the exams achieving scores: Verbal 496, Math 514, Writing 488. According to the College Board the maximum score on each section was 800, and 360 students nationwide scored a perfect 2,400.
In 2010–2011, students took the SA exams. The district's Verbal Average Score was 372. The math average score was 358. The writing average score was 323.[81] Pennsylvania ranked 40th among state with SAT scores: Verbal - 493, Math - 501, Writing - 479.[82] In the United States, 1.65 million students took the exam in 2011. They averaged scores were: Verbal 497 (out of 800), Math 514 and in Writing 489.[83]
Graduation requirements
In the Chester-Upland School District, ninth grade students must earn seven credits to be promoted to 10th grade. To move from Grade 10 to Grade 11, 13 credits must have been earned. To be promoted from Grade 11 to 12 the student must have earned a total of 20 credits. The district offers students the opportunity to recover up to two credits, not earned during the previous school year through the Credit Recovery Program, which is offered during the second semester and during the summer.
By law, all Pennsylvania secondary school students must complete a project as a part of their eligibility to graduate from high school. The type of project, its rigor and its expectations are set by the individual school district.[84]
By Pennsylvania School Board regulations, for the graduating classes of 2015 and 2016, students must demonstrate successful completion of secondary level course work in Algebra I, Biology, English Composition, and Literature for which the Keystone Exams serve as the final course exams. Students' Keystone Exam scores shall count for at least one-third of the final course grade.[85][86][87]
Chester High School main campus
Chester High School is an urban, public high school located at 200 West 9th Street. Chester, Pennsylvania. In 2014, enrollment was reported as 841 pupils in 9th through 12th grades, with 78% of pupils eligible for a free lunch due to family poverty. Additionally, 32% of pupils received special education services, while less than 1% of pupils were identified as gifted. The school employed 62 teachers.[88] Per the Pennsylvania Department of Education, just 87% of the teachers were rated "Highly Qualified" under the federal No Child Left Behind Act.
In 2010, the school provided grades 7 through 12. In 2009–10, the school had 1302 pupils, with 78 teachers and a Student/Teacher Ratio of 16.69.[89]
- 2014 School Performance Profile
Chester High School achieved 33.5 out of 100. Reflects on grade level reading, mathematics and science achievement. In reading/literature - 16% were on grade level. In Algebra 1, just 2% showed on grade level skills at the end of the course. In Biology, 1% demonstrated on grade level science understanding at the end of the course.[90][91] Statewide, the percentage of high school students who scored proficient and advanced in Algebra I increased to 39.7% to 40.1%. The percentage of high school students who scored proficient and advanced in reading/literature declined to 52.5%. The percentage of high school students who scored proficient and advanced in biology improved from 39.7% to 41.4%.[92]
According to the Pennsylvania Department of Education, 2,134 of 2,947 Pennsylvania public schools (72 percent of Pennsylvania public schools), achieved an academic score of 70 or higher.[93] Fifty-three percent of schools statewide received lower SPP scores compared with last year's, while 46 percent improved. A handful were unchanged.[94][95]
Compared with last year, the percentage of schools that earned below 60 declined by nearly 1 percent per Secretary of Education Carolyn Dumaresq. She reported that this is an indication that student achievement is improving as school resources are being used better.[96]
- 2013 School Performance Profile
Chester High School achieved 35.3 out of 100. Reflects on grade level reading, mathematics and science achievement. In reading/literature - 24% were on grade level. In Algebra 1, 5% showed on grade level skills. In Biology, 4% showed on grade level science understanding.[97] According to the Pennsylvania Department of Education, 2,181 public schools (less than 73 percent of Pennsylvania public schools), achieved an academic score of 70 or higher. Pennsylvania 11th grade students no longer take the PSSAs. Instead, beginning in 2012, they take the Keystone Exams at the end of the associated course.[98]
- Graduation rate
In 2014, the graduation rate was 57%.[99]
- AYP history
In 2012, Chester High School was in "Corrective Action II 6th Year" due to chronic inadequate student achievement with the students achieving just 1 academic metric out of 10 measured.[104] In 2011, Chester High School was in "Corrective Action II 5th Year" due to chronic low student achievement. In 2010, the school was in "Corrective Action II 4th Year."[105]
- PSSA results
Pennsylvania System of School Assessments, commonly called PSSAs are No Child Left Behind Act related examinations which were administered from 2003 through 2012, in all Pennsylvania public high schools. The exams were administered in the Spring of each school year. The goal was for 100% of students to be on grade level or better in reading and mathematics, by the Spring of 2014. The tests focused on the state's Academic Standards for reading, writing, mathematics and science. The Science exam included content in science, technology, ecology and the environmental studies. The mathematics exam included: algebra I, algebra II, geometry and trigonometry. The standards were first published in 1998 and are mandated by the Pennsylvania State Board of Education.[106]
In 2013, the Commonwealth of Pennsylvania changed its high school assessments to the Keystone Exams in Algebra 1, Reading/literature and Biology1. The exams are given at the end of the course, rather than all in the spring of the student's 11th grade year.[107]
11th Grade Reading:
- 2012 - 21% on grade level, (61% below basic). State - 67% of 11th graders are on grade level.[108]
- 2011 - 15% (64% below basic). State - 69.1% [109]
- 2010 - 24% (60% below basic). State - 66%[110]
- 2009 - 18% (62% below basic). State - 65%[111]
- 2008 - 10% (74% below basic). State - 65%[112]
- 2007 - 9% (76% below basic). State - 65%[113]
11th Grade Math:
- 2012 - 9%, on grade level (80% below basic). State - 59%[114]
- 2011 - 15%, (68% below basic). State - 60.3%[115]
- 2010 - 8%, (83% below basic). State - 59%
- 2009 - 5% (80% below basic). State - 56%.
- 2008 - 3% (87% below basic). State - 56%
- 2007 - 3% (86% below basic). State - 53%
11th Grade Science:
- 2012 - 2% on grade level (63% below basic). State - 42% of 11th graders were on grade level.
- 2011 - 3%, (70% below basic). State - 40% [116]
- 2010 - 1% (56% below basic). State - 39%
- 2009 - 2% (71% below basic). State - 40%[117]
- 2008 - 0.9% (65% below basic). State - 39%
Chester High UNFAIRLY dropped the MCJROTC Program
Chester High School - Smedley Allied Health Campus
In 2012, The Smedley Allied Health Campus achieved AYP. It was the only school in the District to achieve AYP. In 2011, the school was in "Warning" status because it did not achieve Adequate Yearly Progress.[118] The school was established in 2008. It is operated in cooperation with Crozer-Keystone Health System. Students can earn 12 college credits at Widener University prior to graduation. The school focuses on preparing students to pursue health careers through providing opportunities to participate in internships and mentoring programs at Crozer-Keystone hospitals Students earn an Emergency Medical Technician and Certified Nursing Assistant certification. To attend the school, students must complete an application process which includes meeting a grade point average and compliance with the district school attendance requirements. In 2009–10, enrollment was 141 pupils. There were 18 teachers.[119]
- 11th grade PSSA results
- Reading:
- 2012 - 41% on grade level, (26% below basic). State - 67% of 11th graders are on grade level.
- 2011 - 31%, (38% below basic). State - 69.1%[120]
- Math:
- 2012 - 33% on grade level (43% below basic). State - 59% of 11th graders are on grade level.[121]
- 2011 - 21%, (53% below basic). State - 60.3% [122]
- Science:
- 2012 - 7% on grade level (47% below basic). State - 42% of 11th graders were on grade level.
- 2011 - 0%, (83% below basic). State - 40% [123]
Chester High School - Science and Discovery Campus
The School serves 176 students in grades 9-11. The school is operated in partnership with Eastern University. Selected students enrolled in Science and Discovery High School earn college credits while earning credits towards high school graduation. Students receive instruction from college professors on the school's campus. Students receive extra help through tutoring during and after school using computer assisted programs such as Achieve 3000 (reading) and Apangea for mathematics. In September 2011, students staged a walkout in protest over several grievances, including class size and unqualified teachers.[124] According to a Pennsylvania Department of Education report, the school has 16 Non‐Highly Qualified Teachers and 6 with emergency certification. In Pennsylvania, a Highly Qualified teacher is one who: (1) holds full certification, (2) has at least a bachelor's degree, (3) has completed a content area major, (4) has passed a content area test, and (5) has completed teacher education coursework[125] In 2009–10, enrollment was 176 pupils. There were 7 teachers.[126]
- 2013 School Performance Profile
Chester Upland STEM High School achieved 15.8 out of 100. Reflects on grade level reading, mathematics and science achievement. In reading/literature - 30% were on grade level. In Algebra 1, 14% showed on grade level skills. In Biology, 7.7% showed on grade level science understanding.[127] In 2013, no SAT or graduation rate data was reported.
- AYP History
In 2012, Science and Discovery Campus declined to School Improvement AYP status.[128] In 2011, the school was in Warning status because it did not achieve Adequate Yearly Progress.[129]
- 11th grade PSSA results
- Reading:
- 2012 - 28% on grade level, (48% below basic). State - 67% of 11th graders are on grade level.
- 2011 - 34%, (38% below basic). State - 69.1% [130][131]
- Math:
- 2012 - 25% on grade level (45% below basic). In Pennsylvania, 59% of 11th graders are on grade level.[132]
- 2011 - 15% (66% below basic). State - 60.3% [133]
- Science:
- 2012 -11% on grade level (52% below basic). State - 42% of 11th graders were on grade level.
- 2011 - 8% (56% below basic). State - 40% [134]
Columbus Elementary School
Columbus Elementary School is located at 320 W 10th Street, Chester. In 2013, the School's enrollment was 336 pupils in grades Preschool through 5th with 84.8% of pupils receiving a federal free or reduced price meals due to family poverty. Additionally, 19.9% of the pupils receive special education services, while less than 1% are identified as gifted.[135] According to a report by the Pennsylvania Department of Education, only 73% of the teachers were rated highly qualified under No Child Left Behind. The school provides preschool and full day kindergarten.[136] The school is a federally designated Title I school.
- 2013 School Performance Profile
Columbus Elementary School achieved a score of 52 out of 100. The score reflects on grade level: reading, science, writing and mathematics achievement. In 2012-13, only 13.9% of the students were reading on grade level in grades 3rd through 5th. In 3rd grade, 21% of the pupils were reading on grade level. In math, 18% were on grade level (3rd-5th grades). In 4th grade science, just 22% of the pupils demonstrated on grade level understanding. In writing only 12% of 5th grade pupils demonstrated on grade level skills.[137]
- AYP history
In 2012, Columbus Elementary School declined to Corrective Action II 6th Year status due to intractable, low student achievement. In 2011, the School was in Corrective Action II 5th Year status due to ongoing low student achievement. In 2010, the school was in Corrective Action II 4th Year status due to chronic low student achievement in reading and mathematics.[138] In 2011, the attendance rate was 89%, while in 2010 it was 88%.[139] According to the Pennsylvania Department of Education, 41 of the Columbus Elementary School's classroom teachers are Not Highly Qualified. The school is on the state's Persistently failing school list in 2010 and 2011. Under No Child Left Behind, the school is mandated to provide Supplemental Education Services (outside of school tutoring) to assist students to succeed in reading and math. Additionally, the school was required to offer to transfer children to a successful school in the district. In 2009, as part of a district restructuring, eighth grade was added to the school. Seventh grade was added to the school, in 2008. Due to the inadequate achievement, the school is eligible for extra funding through the School Improvement Grants.[140] In 2009–10, enrollment was 828 pupils with 77 children in Preschool. There were 48 teachers.[141]
- PSSA Results
- 8th Grade Reading
- 2012 - 21% on grade level (52% below basic). In Pennsylvania, 79% of 8th graders on grade level.[142]
- 2011 - 21% (62% below basic). State - 81.8%
- 2010 - 34% (44% below basic). State - 81%
8th Grade Math:
- 2012 - 24% on grade level (58% below basic). In Pennsylvania, 76% of 8th graders are on grade level [143]
- 2011 - 11% (68% below basic). State - 76.9%
- 2010 - 8% (71% below basic). State - 75%[144]
8th Grade Science:
- 2012 - 4% on grade level (84% below basic). State – 59% of 8th graders were on grade level.
- 2011 - 4%, (85% below basic). State – 58.3%
- 2010 - 2%, (93% below basic). State – 57%[145]
|
7th Grade Math:
|
|
6th Grade Reading:
|
6th Grade Math:
|
|
5th Grade Reading:
|
5th Grade Math:
|
|
|
- 4th Grade Science
- 2012 - 17%, (54% below basic). State – 82%
- 2011 - 31%, (36% below basic). State – 82.9%
- 2010 - 27%, (50% below basic). State - 81%
- 2009 - 0%, (28% below basic). State - 83%
- 2008 - 30%, (37% below basic). State - 81%
|
|
Main Street Elementary School
Main Street Elementary School is located in the borough of Upland. The school provides a taxpayer-funded preschool and kindergarten through 5th grade in 2013. In 2013, the school's enrollment was 335 pupils, with 49.5% of pupils receiving a federal free or reduced price meals due to family poverty. Additionally, 8.6% of the pupils receive special education services, while no children were identified as gifted.[147] According to a report by the Pennsylvania Department of Education, 96% of the teachers were rated highly qualified under No Child Left Behind. The school provides preschool and full day kindergarten.[148]
- AYP History
In 2012, the school declined to Corrective Action II 6th Year status due to intractable low student math and reading achievement.[149] In 2011, the school was in Corrective Action II 5th Year status due to chronic lagging math and reading achievement.[150] In 2010, the school declined to Corrective Action II 4th Year status due to continuing low student math and reading achievement. The attendance rate was 93% in both 2010 and 2011.[151] In accordance with No Child Left Behind, due to low student achievement, the school was mandated to allow students to transfer to a successful school in the district. Students may transfer to either Stetser Elementary School or Chester Upland School of the Arts. The district must provide transportation.[152] Free tutoring is offered after school to help eligible students improve in reading, mathematics and science. The school has a Title I and Parent- School Community Council which works with parents to improve student performance. In 2009–10, enrollment was 365 pupils with 40 children in preschool. There were 16.5 teachers.[153]
PSSA Results:
|
8th Grade Reading:
|
8th Grade Math: |
8th Grade Science:
- 2012 - 13% on grade level (53% below basic). State – 59% of 8th graders were on grade level.
- 2011 - 19% (49% below basic). State – 58.3%
- 2010 - 15% (76% below basic). State – 57%[157]
- 2009 - 11% (48% below basic). State - 55%[158]
- 2008 - 8% (63% below basic). State - 52%[159]
|
7th Grade Reading |
7th Grade Math:
|
|
6th Grade Reading:
|
6th Grade Math:
|
|
5th Grade Reading:
|
5th Grade Math:
|
|
|
- 4th Grade Science
- 2012 - 52% on grade level (0% below basic), State – 82.9%
- 2011 - 85%, (0% below basic), State – 82.9%
- 2010 - 47%, (22% below basic), State - 81%
- 2009 - 62%, (10% below basic), State - 83%
- 2008 - 43%, (23% below basic), State - 81%
|
|
Chester Upland School for the Arts
The school was established in 2008, by Dr. John Alston in partnership with the Chester Upland School District. It began with an enrollment of 200 children in preschool through 2nd grade. The school provides taxpayer funded preschool through 4th grade in 2011. Fourth grade was added in fall 2010.
In 2013, the school's enrollment was 293 pupils in grades preschool through 5th, with 75% of pupils receiving a federal free or reduced price meals due to family poverty. Additionally, 7% of the pupils receive special education services, while 2.7% are identified as gifted.[162] According to a report by the Pennsylvania Department of Education, 89% of the teachers were rated highly qualified under No Child Left Behind. The school provides preschool and full day kindergarten.[163] The school is a federally designated Title I school.
- 2013 School Performance Profile
Chester Upland School for the Arts achieved a score of 56.3 out of 100. The score reflects on grade level: reading, science, writing and mathematics achievement. In 2012-13, only 30% of the students were reading on grade level in grades 3rd through 5th. In 3rd grade, 28% of the pupils were reading on grade level. In math, 47.5% were on grade level (3rd-5th grades). In 4th grade science, just 66% of the pupils demonstrated on grade level understanding. In writing, only 18% of 5th grade pupils demonstrated on grade level skills.[164]
According to the National Center for Education Statistics, in 2011, enrollment was 322 pupils in grades preschool through 5th, with 239 pupils receiving a free or reduced price lunch. The School employed more than 17 teachers.[165]
In 2010 the school received a three-year $360,000 grant from The Sunshine Lady Foundation (founded by Doris Buffett) which was used to extend the school day that provides: tutoring, club activities, and music, dance and visual-arts classes.[166] In 2009–10, enrollment was 245 pupils with 81 children in preschool. There were 10.5 teachers.[167] In 2011, the attendance rate was 92%, while in 2010 it was 93%. In 2011, the school applied to the Chester Upland School Board to be converted into a charter school. In January 2012, the application was denied without explanation.[168]
- AYP history
In 2012, Chester Upland School for the Arts declined to Warning AYP status due to under achievement in reading and math.[169] In both 2011 and 2010, the school achieved AYP status.[170]
- PSSA Results
- 4th Grade Reading
- 2012 - 61% on grade level (21% below basic). State – 72% reading on grade level[171]
- 2011 - 62%, (22% below basic). State – 73% [172]
- 4th Grade Math
- 2012 - 86% on grade level (11% below basic). State – 82%
- 2011 - 76%, (8% below basic). State – 85%
- 4th Grade Science
- 2012 - 71% on grade level (4% below basic). State – 82%
- 2011 - 76%, (16% below basic). State – 82.9%
- 3rd Grade Reading
- 2012 - 47% on grade level (29% below basic). State – 74%
- 2011 - 58%, (24% below basic). State – 77% [173]
- 2010 - 50%, (19% below basic). State - 75%
- 3rd Grade Math
- 2012 - 68% on grade level (12% below basic). State – 80%
- 2011 - 68%, (11% below basic). State – 83%
- 2010 - 67%, (8% below basic). State - 84% [174]
Stetser Elementary School
Stetser Elementary School is located at 808 E 17th Street, Chester. It provides a taxpayer-funded preschool which begins at age 3 and kindergarten through 5th grade in 2013. The school provides a reading skills intervention program called Reading Recovery for first graders. In 2013, the school's enrollment was 205 pupils, with 80% of pupils receiving a federal free or reduced price meals due to family poverty. Additionally, 15.6% of the pupils receive special education services, while 2% are identified as gifted.[175] According to a report by the Pennsylvania Department of Education, 100% of the teachers were rated highly qualified under No Child Left Behind. The school provides full day kindergarten.[176] The school is a federally designated Title I school.
According to the National Center for Education Statistics, in 2011, Stetser Elementary School's enrollment was 214 pupils in grades preschool through 6th, with 161 pupils receiving a free or reduced price lunch. The School employed 14.8 teachers yielding a student-teacher ratio of 14:1.[177]
The attendance rate was 91% in 2011, while in 2010 it was 89%.[178] In 2011, the school reports that all the teachers are certified and highly qualified. In 2010 the enrollment was 268 students. During the summer of 2011, the pupils participated in First Lady Obama's Healthy Foods Initiative by growing a vegetable garden. The project was supported by an Earth Force Southeastern Pennsylvania service-learning grant and in-kind donations from the Home Depot in Folsom.[179]
- 2013 School Performance Profile
Stetser Elementary School achieved a score of 59 out of 100. The score reflects on grade level: reading, science, writing and mathematics achievement. In 2012-13, only 47% of the students were reading on grade level in grades 3rd through 5th. In 3rd grade, 53.5% of the pupils were reading on grade level. In math, 56% were on grade level (3rd-5th grades). In 4th grade science, just 55% of the pupils demonstrated on grade level understanding. In writing, only 56% of 5th grade pupils demonstrated on grade level skills.[180] In 2013, the attendance rate was 93%
- AYP History
In 2012, Stetser Elementary School declined to a Warning AYP status.[181] In 2011 and 2010, the school achieved AYP status under the No Child Left Behind law based on Pennsylvania's Growth Model.[182] The growth model recognize the improvements in performance represented by significant growth even when the school does not reach targets of on grade level achievement.
- PSSA Results
|
6th Grade Reading:
|
6th Grade Math:
|
|
5th Grade Reading:
|
5th Grade Math:
|
|
|
- 4th Grade Science
- 2012 - 65% on grade level, (26% below basic), State – 82%
- 2011 - 39%, (35% below basic), State – 82.9%
- 2010 - 38%, (26% below basic), State - 81%
- 2009 - 38%, (12% below basic), State - 83%
- 2008 - 25%, (16% below basic), State - 81%
|
|
The Village at Chester Upland School
The school is a suburban school located at 200 Commerce Dr., Chester Township, Pennsylvania. The school provides taxpayer funded preschool for ages 3 and 4, along with kindergarten through eighth grade. In 2011, the school declined to School Improvement Level II status due to continuing inadequate, on grade level achievement in reading and math. It was mandated, by the No Child Left Behind law, to offer students the opportunity to transfer to a successful school within the district. In 2010, the school was in School Improvement Level I status.[185] The school was required to develop a formal school improvement plan that was submitted to the state for approval. The attendance rate was 91% in both years.[186] The school offers a wide variety of extracurriculars and after school programs. The Village Charter School was originally established as a nonprofit charter school in December 1997. In 2002, the school sued the Chester Upland School Board which had withheld the state funding it was mandated to forward to the school.[187][188] In June 2008, the school merged into the Chester Upland School District. The Pennsylvania Auditor General conducted an audit of the school, while it was a charter and found multiple irregularities.[189] In 2009–10, enrollment was 541 pupils, with 59 children in preschool. There were 22.5 teachers.[190]
PSSA Results:
|
8th Grade Reading |
8th Grade Math: |
8th Grade Science:
- 2012 - 11% on grade level (73% below basic). State – 59% of 8th graders were on grade level.
- 2011 - 12%, (64% below basic). State – 58.3%
- 2010 - 5%, (87% below basic). State – 57%[196]
- 2009 - 4%, (75% below basic). State - 55%[197]
- 2008 - 8%, (69% below basic). State - 52%[198]
|
7th Grade Reading
|
7th Grade Math:
|
|
6th Grade Reading:
|
6th Grade Math:
|
|
5th Grade Reading:
|
5th Grade Math:
|
|
|
- 4th Grade Science
- 2012 - 18%, (39% below basic), State – 82%
- 2011 - 49%, (23% below basic), State – 82.9%
- 2010 - 38%, (46% below basic), State - 81%
- 2009 - 55%, (12% below basic), State - 83%
- 2008 - 28%, (38% below basic), State - 81%
|
|
Toby Farms Intermediate School
The school is a suburban school located at 201 Bridgewater Road, Brookhaven, Pennsylvania. In 2013, enrollment was 292 pupils, in grades 6th through 8th, with 81.8% of pupils eligible for a free lunch due to family poverty. Additionally, 20% of pupils received special education services, while 4.4% of pupils were identified as gifted.[199] According to a 2013 report by the Pennsylvania Department of Education, 86% of its teachers were rated "Highly Qualified" under No Child Left Behind.[200]
In 2012, a district wide reorganization plan precipitated by a large decline in enrollment coupled with financial mismanagement resulting in a significant shortfall, the school was made a grade 6th-8th school.
In 2011 the school was a Pre-K - 8 School. The attendance rate was 91% in 2010 and 2011. In response to a district wide decline in enrollment, a middle school was closed and eighth grade was added to the Toby Farms Elementary School for the 2009–10 school year. In 2008–09, 7th grade was added to the Toby Farms. In 2009–10, the school enrollment was reported as 560 with 35.5 teachers, for a student–teacher ratio of 15.77. Preschool enrollment was 59 pupils.[201]
- 2013 School Performance Profile
Toby Farms Intermediate School achieved out of 100. Reflects on grade level reading, writing, mathematics and science achievement. In reading, just 33% of the students were on grade level. In Mathematics/Algebra 1, 47.9% of the students showed on grade level skills. In Science, only 7% of the 8th graders demonstrated on grade level understanding. In writing, 30.9% of the 8th grade students demonstrated on grade level writing skills.[202]
- AYP History
In 2012, Toby Farms Elementary School declined to School Improvement I AYP status. In 2011, the school is in Warning status due to lagging student achievement. In 2010 the school achieved AYP.[203] In compliance with No Child Left Behind, the school administration notified parents they could transfer their child to a successful school with in the district.[204]
PSSA Results: Sixth and seventh grades have been tested in reading and mathematics since 2006. Eighth graders are tested in: reading, writing, mathematics and Science. Beginning in the Spring of 2013, eighth graders, who are enrolled in Algebra I take the Keystone Exam for Algebra I at the end of the course. The testing of 8th grade in reading and mathematics began in 1999, as a state initiative.[205] Testing in science began in 2007. The goal is for 100% of students to be on grade level or better in reading and mathematics, by the Spring of 2014. The tests focus on the state's Academic Standards for reading, writing, mathematics and science.[206] The standards were published in 1998 and are mandated by the Pennsylvania State Board of Education.[207] In 2014, the Commonwealth adopted the Pennsylvania Core Standards - Mathematics.[208]
|
8th Grade Reading: |
8th Grade Math:
|
8th Grade Science:
- 2012 - 10% on grade level (77% below basic). State – 59% of 8th graders were on grade level.
- 2011 - 8% (60% below basic). State – 58.3%
- 2010 - 15% (61% below basic). State – 57%
|
7th Grade Reading:
|
7th Grade Math:
|
|
6th Grade Reading:
|
6th Grade Math:
|
|
5th Grade Reading:
|
5th Grade Math:
|
|
|
- 4th Grade Science
- 2012 - 37%, (41% below basic). State – 82%
- 2011 - 63%, (9% below basic). State – 82.9%
- 2010 - 53%, (16% below basic). State - 81%
- 2009 - 47%, (10% below basic). State - 83%
- 2008 - 49%, (15% below basic). State - 81%
|
|
Showatter Intermediate School
Showatter Intermediate School is located at 1100 West 10th Street, Chester. In 2013, enrollment was 348 pupils, in grades 6th through 8th, with 84% of pupils eligible for a free lunch due to family poverty. Additionally, 18.9% of pupils received special education services, while % of pupils were identified as gifted.[211] According to a 2013 report by the Pennsylvania Department of Education, 73% of its teachers were rated "Highly Qualified" under No Child Left Behind.[212]
- 2013 School Performance Profile
Showatter Intermediate School achieved 43.2 out of 100. Reflects on grade level reading, writing, mathematics and science achievement. In reading, just 21% of the students were on grade level. In Mathematics/Algebra 1, 16% of the students showed on grade level skills. In Science, only 4% of the 8th graders demonstrated on grade level understanding. In writing, 33% of the 8th grade students demonstrated on grade level writing skills.[213]
Special education
In December 2012, the Chester Upland School District administration reported that 618 pupils or 15% of the district's pupils received Special Education services, with 54.9% of the identified students having a specific learning disability.[214] In December 2009, the District administration reported that 205 pupils or 19% of the district's pupils received Special Education services, with 60% of the identified students having a specific learning disability. Special education services in the Commonwealth are provided to students from ages three years to 21 years old. In the 2010-2011 school year, the total student enrollment was more than 1.78 million students with approximately 275,000 students eligible for special education services. Among these students 18,959 were identified with mental retardation and 21,245 students with autism.[215] The largest group of students are identified as Specific Learning Disabilities 126,026 students (46.9 percent) and Speech or Language Impairments with 43,542 students (16.2 percent).
In December 2010, Chester Upland School District administration reported that 902 pupils or 19.9% of the district's pupils received special education services. Sixty percent of special education pupils were identified by the district, as having a specific learning disability.[216]
In 2010, the state of Pennsylvania provided $1,026,815,000 for special education services. This funding is in addition to the state's basic education per pupil funding, as well as, all other state and federal funding.[217] The Pennsylvania's special education funding system assumes that 16% of the district's students receive special education services. It also assumes that each student's needs accrue the same level of costs.[218] The state requires each district to have a three-year special education plan to meet the unique needs of its special education students.[219] Overidentification of students in order to increase state funding has been an issue in Pennsylvania. Some districts have more than 20% of its students receiving special education services while others have 10% supported through special education.[220] In 2012, the Obama Administration's US Department of Education issued a directive requiring schools include students with disabilities in extracurricular activities, including sports.[221]
The Chester Upland School District received $5,008,554 in supplemental funding, for special education services in 2010.[222] For the 2011–12, 2012-2013, 2013-2014 and 2014-2015 school years, all Pennsylvania public school districts received the same level of funding for special education that they received in 2010. This level funding is provided regardless of changes in the number of pupils who need special education services and regardless of the level of services the respective students required.[223] Additionally, the state provides supplemental funding for extraordinarily impacted students. The District must apply for this added funding.
School safety and bullying policy
The Chester Upland School District Administration reported there were 55 incidents involving local law enforcement, including 93 fights and 7 incidents of indecent assault, in 2009.[224] Twenty nine students were charged with assault. According to district officials, there were no incidents of bullying in 2009.
Chester-Upland School Board has provided the District's antibully policy online.[225] The district requires staff and faculty to report bullying.[226] All Pennsylvania schools are required to have an anti-bullying policy incorporated into their Code of Student Conduct. The policy must identify disciplinary actions for bullying and designate a school staff person to receive complaints of bullying. The policy must be available on the school's website and posted in every classroom. All Pennsylvania public schools must provide a copy of its anti-bullying policy to the Office for Safe Schools every year, and shall review their policy every three years. Additionally, the district must conduct an annual review of that policy with students.[227] The Center for Schools and Communities works in partnership with the Pennsylvania Commission on Crime & Delinquency and the Pennsylvania Department of Education to assist schools and communities as they research, select and implement bullying prevention programs and initiatives.[228]
Education standards relating to student safety and antiharassment programs are described in the 10.3. Safety and Injury Prevention in the Pennsylvania Academic Standards for Health, Safety and Physical Education.[229]
Smedley Middle School
Closed in 2009. In its last year, there were 181 eighth graders enrolled in the school. At Smedley Middle School, the district provided 21st Century SKILLS College afterschool programming for 7th and 8th graders. The program included homework help and a wide choice of activities. Rewards were given for attendance.[230] In 2003, the school was in School Improvement level I status due to low student achievement.[231]
|
8th Grade Math:
|
8th Grade Science:
|
7th Grade Reading
|
7th Grade Math:
|
Class action lawsuit
In 2012, the District sued the Commonwealth of Pennsylvania regarding underfunding and payment of the District's outstanding debts. In July 2012 the Commonwealth entered into a settlement which provides: "$20.5 million in funds, which the Commonwealth and the District warrant are sufficient to eliminate past operating debts of the District to vendors, charter schools and district staff through the end of the 2011–12 school year, as well as $9.7 million in additional appropriated funding for 2012–13. The District agrees that it will undertake activities set forth in the Settlement Agreement to improve its special education programs, including adding personnel and development and implementation of a new or revised Special Education Plan. The Commonwealth also agrees that it will appoint a Special Education Officer located in the District with express authority to ensure that students with disabilities in the CUSD receive a free appropriate public education". Additionally, state taxpayers must pay the plaintiffs attorney's fees of $260,000.[236][237]
Recent history
In 1994, Chester Upland was named by the state as the worst-performing school district in Pennsylvania. The District had a multimillion-dollar deficit and its decision-making ability was taken over by the state. A for-profit company, Edison Schools, was hired to try to improve the struggling district's test scores in 2001. After four years it was determined that Edison was not successful in turning the district around. A number of incidents, including an allegation of sexual misconduct on the part of an Edison employee, and policies such as not allowing students to bring home books, led to the state's decision to break its contract with Edison.
The District has regained local public control, but remains one of the lowest-performing in Pennsylvania. 72% of district students are eligible for free or reduced-price lunches, as compared to the state average of 33%. In recent years it has opened a number of selective-admission magnet schools.
Charter schools
Students in the district may also opt to attend a variety of public charter schools, including Widener Partnership Charter School (K-5) (operated by Widener University),[238] Chester Community Charter School (K-8)[239] or one of the statewide cyber charter schools. In 2006, over one third of the district's students have chosen to attend charter schools. By 2011–12, charter attendance at a charter school had risen to over 45%. of the district's pupils.[240] In 2011–12, 2,697 Chester Upland SD students attend CCCS, while 329 attend WPCS.[241]
The Chester Upland School Board rejected the establishment of several charter schools: Chester Charter School for Theater Arts and Excel Charter School, which intended to focus on dropouts, was rejected in fall 2011. In July 2012, the Pennsylvania Charter School Appeal Board approved the school to open for the 2012–13 school year.[242]
Budget
Pennsylvania public school districts budget and expend funds according to procedures mandated by the General Assembly and the Pennsylvania Department of Education (PDE). An annual operating budget is prepared by school district administrative officials. A uniform form is furnished by the PDE and submitted to the board of school directors for approval prior to the beginning of each fiscal year on July 1.
Under Pennsylvania’s Taxpayer Relief Act, Act 1 of the Special Session of 2006, all school districts of the first class A, second class, third class and fourth class must adopt a preliminary budget proposal. The proposal must include estimated revenues and expenditures and the proposed tax rates. This proposed budget must be considered by the Board no later than 90 days prior to the date of the election immediately preceding the fiscal year. The preliminary budget proposal must also be printed and made available for public inspection at least 20 days prior to its adoption. The board of school directors may hold a public hearing on the budget, but are not required to do so. The board must give at least 10 days’ public notice of its intent to adopt the final budget according to Act 1 of 2006.[243]
In August 2015, Chester Upland School District announced it could not pay faculty and staff. It appealed to the state for additional funding. The District has received over $73 million in extra funding over the last five school years. The State Appointed Receiver, Francis Barnes, had sought court approval of a plan which partially addressed a $23.8 million shortfall.[244] The District lost the appeal.[245] Local charter schools educate more than forty percent of the children living in the attendance zone of the Chester Upland School District. They have fled the district due to decades of poor academic outcomes and chronic safety issues. The Wolf Administration and the District created a plan to cut back sharply on the state mandated funding sent to the charter schools.[246]
In July 2015, Francis Barnes was appointed state receiver of the Districts. His appointment came as the state attempted to force out its earlier appointee Joseph Watkins who had served as head of the District since December 2012. Watkins had been appointed by the Corbett Administration to address the financial, safety and academic issues in the District.[247][248]
In 2013, the average teacher salary in Chester Upland School District was $75,069 a year, while the cost of the benefits teachers received was $33,378 per employee, for a total annual average teacher compensation of $108,448.[249] In 2012, the District employed 191 teachers with an average salary of $77,732 and a top salary of $108,000.[250][251] In 2009, the District employed 319 teachers with an average salary of $64,004 and a top salary of $105,000.[252]
In 2009, Chester Upland School District reported employing 316 teachers and administrators with a median salary of $64,004 and a top salary of $205,000.[253] Additionally, the teachers receive a defined benefit pension, health insurance, professional development reimbursement, paid personal days, paid sick days, and other benefits.[254]
Administration costs Chester Upland School District administrative costs per pupil in 2008 was $1,151 per pupil ranking 29th in the Commonwealth for administrative spending. The lowest administrative cost per pupil in Pennsylvania was $398 per pupil.[255] The Pennsylvania School Boards Association collects and maintains statistics on salaries of public school district employees in Pennsylvania. According to the association's report, the average salary for a superintendent, for the 2007-08 school year, was $122,165. Superintendents and administrators receive a benefit package commensurate with that offered to the district's teachers' union.[256] According to PSBA, the median Superintendent salary rose to over $130,000 in 2011.[257] In March 2014, the Board eliminated 9 high cost, administration positions saving $1.4 million, which was repurposed to classroom needs.[258]
The District is funded by a combination of: a property tax, a real estate transfer tax 0.5%, coupled with massive funding through a wide variety of lines items from the Commonwealth of Pennsylvania and a small amount, $5.7 million of its budget from the federal government.[259] Grants can provide an opportunity to supplement school funding without raising local taxes. Interest earnings on accounts also provide nontax income to the District. In the Commonwealth of Pennsylvania, pension income and Social Security income are exempted from state personal income tax and local earned income tax, regardless of the level of the individual’s personal wealth.[260] The average Pennsylvania public school teacher pension in 2011 exceeds $60,000 a year plus they receive federal Social Security benefits: both are free of Pennsylvania state income tax and local income tax which funds local public schools.[261]
State basic education funding
According to a report from Representative Todd Stephens office, Chester Upland School District receives 77.7% of its annual revenue from the state.[262]
For the 2014-15 school year, Chester Upland School District received $60,257,247 in State Basic Education funding. The Chester Upland School District also received $1,265,791 in new Ready To Learn Block grant. The State’s enacted Education Budget includes $5,526,129,000 for the 2014-2015 Basic Education Funding.[263] The Education budget also includes Accountability Block Grant funding at $100 million and $241 million in new Ready to Learn funding for public schools that focus on student achievement and academic success. The State is paying $500.8 million to Social Security on the school employees behalf and another $1.16 billion to the state teachers pension system (PSERS). In total, Pennsylvania’s Education budget for K-12 public schools is $10 billion. This was a $305 million increase over 2013-2014 state spending and the greatest amount ever allotted by the Commonwealth for its public schools.[264]
In the 2013-2014 school year, Chester Upland School District received a 1.1% increase to $59,600,316 in Pennsylvania Basic Education Funding. This was $626,054 more state funding than the previous year. Additionally, Chester Upland School District received $980,044 in Accountability Block Grant funding to focus on academic achievement and level funding for special education services. Among the public school districts in Delaware County, Upper Darby School District received the highest percentage increase in BEF at 11%. Chester Upland District has the option of applying for several other state and federal grants to increase revenues. The Commonwealth’s budget increased Basic Education Funding statewide by $123 million to over $5.5 billion. Most of Pennsylvania’s 500 public school districts received an increase of Basic Education Funding in a range of 0.9% to 4%. Eight public school districts received exceptionally high funding increases of 10% to 16%. The highest increase in state funding was awarded to Austin Area School District which received a 22.5% increase in Basic Education Funding.[265] The highest percent of state spending per student is in the Chester-Upland district, where roughly 78 percent comes from state coffers. In Philadelphia, it is nearly 49 percent.[266] As a part of the education budget, the state provided the PSERS (Pennsylvania school employee pension fund) with $1,017,000,000 and Social Security payments for school employees of $495 million.[267]
For the 2012-13 school year, the Chester Upland School District received $58,965,034.[268] The Governor's Executive Budget for 2012-2013 included $9.34 billion for kindergarten through 12th grade public education, including $5.4 billion in basic education funding, which was an increase of $49 million over the 2011-12 budget. In addition, the Commonwealth provided $100 million for the Accountability Block Grant (ABG) program. Chester Upland School District received an additional $980,044 in ABG funding. The state also provided a $544.4 million payment for School Employees’ Social Security and $856 million for School Employees’ Retirement fund called PSERS.[269] This amount was a $21,823,000 increase (0.34%) over the 2011-2012 appropriations for Basic Education Funding, School Employees' Social Security, Pupil Transportation, Nonpublic and Charter School Pupil Transportation. Since taking office, Corbett’s first two budgets have restored more than $918 million in support of public schools, compensating for the $1 billion in federal stimulus dollars lost at the end of the 2010-11 school year.
In 2011-12 school year, Chester Upland School District received a $49,251,801 allocation of state Basic Education Funding.[270][271] Additionally, Chester Upland School District received $980,044 in Accountability Block Grant funding. The enacted Pennsylvania state Education budget included $5,354,629,000 for the 2011-2012 Basic Education Funding appropriation. This amount was a $233,290,000 increase (4.6%) over the enacted State appropriation for 2010-2011.[272] The highest increase in state basic education funding was awarded to Duquesne City School District of Allegheny County, which got a 49% increase in state funding for 2011-12.[273] In 2010, the District reported that 3,288 students received free or reduced price lunches, due to the family meeting the federal poverty level.[274] Some public school Districts experienced a reduction in funding due to the loss of federal stimulus funding which ended in 2011.
In the 2010-2011 budget year, the Commonwealth of Pennsylvania provided a 2% increase in Basic Education Funding for a total of $43,909,437. Among the districts in Delaware County, the highest increase went to Southeast Delco School District which got a 10.34% increase. One hundred fifty Pennsylvania school districts received the base 2% increase. The highest increase in 2010-2011 was awarded to Kennett Consolidated School District in Chester County, which received a 23.65% increase in state funding.[275] Fifteen (15) Pennsylvania public school districts received a BEF increase of greater than 10%. The state's hold harmless policy regarding state basic education funding continued where each district received at least the same amount as it received the prior school year, even when enrollment had significantly declined. The amount of increase each school district received was set by Governor Edward Rendell and then Secretary of Education Gerald Zahorchak, as a part of the state budget proposal given each February. This was the second year of Governor Rendell’s policy to fund some public school districts at a far greater rate than others.[276]
In the 2009-2010 budget year, the Commonwealth of Pennsylvania provided a 7.45% increase in Basic Education Funding (BEF) for a total of $43,048,467 to Chester Upland School District. Among the districts in Delaware County, the highest increase went to Upper Darby School District which got an 11.61% in BEF. Ninety (90) Pennsylvania public school districts received the base 2% increase. Muhlenberg School District in Berks County received a 22.31% increase in state basic education funding in 2009.[277] The amount of increase each public school district received was set by Governor Edward G. Rendell and the Secretary of Education Gerald Zahorchak, as a part of the state budget proposal.[278]
The state Basic Education Funding to the District in 2008-2009 was $40,065,439.18. According to the Pennsylvania Department of Education, 3,066 district students received free or reduced- price lunches due to low family income in the 2007–2008 school year.[279] According to the U.S. Census Bureau, Pennsylvania spent $7,824 Per Pupil in the year 2000. This amount increased up to $12,085 by the year 2008.[280][281]
All Pennsylvania school districts also received additional funding from the state through several other funding allocations, including: Reimbursement of Charter School Expenditures; Special Education Funding; Secondary Career & Technical Education Subsidy; PA Accountability Grants; and low achieving schools were eligible for Educational Assistance Program Funding. Plus all Pennsylvania school districts receive federal dollars for various programs including: Special Education funding and Title I funding for children from low income families. In 2010, Pennsylvania spent over $24 billion for public education - local, state and federal dollars combined.[282]
Accountability Block Grants
Beginning in 2004-2005, the state launched the Accountability Block Grant school funding. This program has provided $1.5 billion to Pennsylvania’s school districts. The Accountability Block Grant program requires that its taxpayer dollars are focused on specific interventions that are most likely to increase student academic achievement. These interventions include: teacher skills training; All Day Kindergarten; lower class size in Kindergarten through 3rd grade; literacy and math coaching programs (provides teachers with individualized job-embedded professional development to improve their instruction); before or after school tutoring assistance to struggling students. For 2010-11, the District applied for and received $2,660,085 in addition to all other state and federal funding. The District used the funding to provide Full Day kindergarten, class size reduction, K-3 and publicly funded preschool.[283][284] In 2009, 100% of the kindergarteners in Area School District attended full-day kindergarten.[285]
Ready to Learn grant
Beginning in the 2014-2015 budget, the State funded a new Ready to Learn Grant for public schools. A total of $100 million is allocated through a formula to districts based on the number of students, level of poverty of community as calculated by its market value/personal income aid ratio (MV/PI AR) and the number of English language learners. Ready to Learn Block Grant funds may be used by the Districts for: school safety; Ready by 3 early childhood intervention programs; individualized learning programs; and science, technology, engineering and math (STEM) programs.[286]
Chester Upland School District received $1,265,791 in Ready to Learn Grant dollars in addition to State Basic Education funding, Special Education funding, Accountability Block Grant funding, PreK Counts funding, reimbursement for Social Security payments for employees and other state grants which the district must apply to receive.
PreK Counts grant
Chester Upland School District receives state funding to provide taxpayer funded preschool at the elementary schools. For the 2013-14 school year, Chester Upland SD receive a Pre K Counts grant of $948,000.[287] For the 2011 school year, Chester Upland School District was a high priority for funding due to the 62% poverty level of children in the district's attendance area.[288][289][290] Enrollment for Pennsylvania Pre-K Counts is targeted to children living in families earning up to 300 percent of the federal poverty level.
In addition to PreK Counts, the Commonwealth of Pennsylvania also supplements the federal Head Start preschool program with an additional funding on an annual basis. The program is available to low income children residing within the District through private providers. In 2013, Pennsylvania contributed $39,178,000 to Head Start. In 2010, Head Start received $37.6 million in Pennsylvania state education dollars. Since 2003, Pennsylvania has more than doubled the number of preschoolers in publicly funded pre-kindergarten through a mulipronged system including: school-based pre-kindergarten, Pennsylvania Pre-K Counts through private providers, Early Intervention, Head Start and Head Start Supplemental, and the school district’s use of Accountability Block Grants. Over 100,000 Pennsylvania preschoolers participate in state taxpayer funded pre-kindergarten programs. In 2013, the federal government spends $8 billion for preschool programs nationwide.[291] In 2013, Pennsylvania was awarded a $51.7 million federl grant to fund early learning programs.[292] The funding will be used to create 50 Early Childhood Education Community Innovation Zones in areas where the lowest-performing public schools, including charter schools, exist. The federal dollars will not be used to provide seats for children in preschools. Instead the money will be used to build bureaucray and added training for teachers/providers.[293]
Classrooms for the Future grant
The Classroom for the Future state program provided districts with hundreds of thousands of extra state funding to buy laptop computers for each core curriculum high school class (English, Science, History, Math) and paid for teacher training to optimize the computers use. The program was funded from 2006 to 2009. The Chester Upland School District was denied funding by the PDE in 2006-07. In 2007-08, the District received $532,990. The District received $97,248 in 2008-09.[294] Among the public school districts in Delaware County the highest award was given to Upper Darby School District which received $1,508,520. The highest funding statewide was awarded to Philadelphia City School District in Philadelphia County - $9,409,073. The grant program was discontinued by Governor Edward Rendell as part of the 2009-10 state budget.
Science It’s Elementary grant
Columbus Elementary School successfully applied to participate and received a Science It’s Elementary grant in 2008-09.[295] For the 2008-09 school year, the program was offered in 143 schools reaching 66,973 students across the Commonwealth of Pennsylvania.[296] In 2007, the Pennsylvania Department of Education initiated an effort to improve science instruction in the Commonwealth’s public elementary schools. Called Science: It’s Elementary, the program was a hands on instruction approach for elementary science classes that develops problem-solving and critical thinking skills.[297] To encourage schools to adopt the program’s standards aligned curriculum, the state provided a grant to cover the costs of materials and extensive mandatory teacher training.[298] The District was required to develop a three-year implementation plan for the participating school. The School District Administration was required to appoint a district liaison who was paid $3,000 by PDE to serve as the conduit of all information between the district and the Department and its agents along with submitting orders and distributing supplies to implementing teachers. For the 2006-07 state education budget, $10 million was allocated for the program.[299] The grant program was expanded to $14.5 million in the 2008-09 budget. The grant was discontinued in the state’s 2011 budget by Governor Edward G. Rendell.
Education Assistance Grant
The state's EAP funding provides for the continuing support of tutoring services and other programs to address the academic needs of eligible students. Funds are available to eligible school districts and full-time career and technology centers (CTC) in which one or more schools have failed to meet at least one academic performance target, as provided for in Section 1512-C of the Pennsylvania Public School Code. In 2010-2011 the School District received $715,935.[300] The grant was discontinued by Governor Rendell.
Project 720
Project 720 was a high school reform program implemented for three years under the Rendell administration. The intent was to increase academic rigor and improve the instruction of teachers in the Commonwealth’s high schools. Teachers were expected to use data driven instructional practices and to meet the needs of diverse learners.[301] The 720 in the name referred to the number of days a student was in high school in ninth through 12th grades. High school’s applied for funding and were required to agree to report to the PDE their plans, their actions and the outcomes. In 2007-08 budget year, the Commonwealth provided $11 million in funding. Chester Upland School District was one of 161 PA public school districts to apply, receiving $118,664 funding over three years.[302][303] For 2010-11, Project 720 funding was decreased to $1.7 million by Governor Rendell. The grant program was discontinued effective with the 2011-12 state budget.[304]
Other grants
The Chester Upland School District did not participate in: Pennsylvania Department of Environmental Protection's Environmental Education annual grants;[305][306] 2012 Striving Readers Comprehensive Literacy grant;[307] 2013 Safe Schools and Resource Officer grants; 2012 and 2013 Pennsylvania Hybrid Learning Grants.[308]
Federal Stimulus grant
The District received an extra $16,039,537 in American Recovery and Reinvestment Act of 2009 (ARRA) - Federal Stimulus money to be used in specific programs like special education and meeting the academic needs of low-income students.[309][310] The funding was limited to the 2009-2010 and 2010-2011 school years.[311] Due to the temporary nature of the funding, schools were repeatedly advised by the Pennsylvania Department of Education, the Pennsylvania Senate Education Committee, the Governor and the Pennsylvania School Board Association, to use the funds for one-time expenditures like acquiring equipment, making repairs to buildings, training teachers to provide more effective instruction or purchasing books and software.
Race to the Top grant
Chester Upland School District officials applied for the federal Race to the Top grant which would have provided several million dollars, in additional federal funding, to improve student academic achievement.[312] Plus since the District is so low performing with high poverty they would have also gotten $750 per pupil. Participation required the administration, the school board and the local teachers' union to sign an agreement to prioritize improving student academic success. In Pennsylvania, 120 public school districts and 56 charter schools agreed to participate.[313] Pennsylvania was not approved for the grant. The failure of districts to agree to participate was cited as one reason that Pennsylvania was not approved.[314][315][316]
21st Century learning grant
Chester Upland School District received a federal grant which is run by the PDE. The grant calls for the establishment and sustainability of community learning centers that provide additional educational services to students in high-poverty and low-performing schools. The grant was competitive. Applications for the grants were reviewed and scored by a panel of representatives from the educational field and professional grant writers. The District received $838,777. While 101 entities applied for the funding, only 66 were approved including eight charter schools. The District was not funded in 2010. The funding is for the 2012-13 fiscal year was $158,309.[317]
Real estate taxes
Property tax rates in 2014-15 were set by the school board at 56.3478 mills for the City of Chester and 23.9726 mills for Upland Borough/Chester Township property owners.[318] A mill is $1 of tax for every $1,000 of a property's assessed value. Irregular property reassessments have become a serious issue in the commonwealth as it creates a significant disparity in taxation within a community and across a region.[319] Property taxes, in the Commonwealth of Pennsylvania, apply only to real estate - land and buildings. The property tax is not levied on cars, business inventory, or other personal property. Certain types of property are exempt from property taxes, including: places of worship, places of burial, private social clubs, charitable and educational institutions and all government property (local, state and federal). Additionally, service related, disabled US military veterans may seek an exemption from paying property taxes. Pennsylvania school district revenues are dominated by two main sources: 1) Property tax collections, which account for the vast majority (between 75-85%) of local revenues; and 2) Act 511 tax collections, which are around 15% of revenues for school districts.[320] When a Pennsylvania public school district includes municipalities in two counties, each of which has different rates of property tax assessment, a state board equalizes the tax rates between the counties.[321] In 2010, miscalculations by the State Tax Equalization Board (STEB) were widespread in the Commonwealth and adversely impacted funding for many school districts, including those that did not cross county borders.[322]
- 2013-14 - 56.3480 mills for the City of Chester and 25.943 mills for Upland Borough/Chester Township[323][324]
- 2012-13 - 53.1600 mills for the City of Chester and 24.4300 mills for Upland Borough/Chester Township [325]
- 2011-12 - 51.3360 mills for the City of Chester and 24.2620 mills for Upland Borough/Chester Township[326]
- 2010-11 - 51.3360 mills for the City of Chester and 24.2620 mills for Upland Borough/Chester Township[327]
- 2009-10 - 51.3360 mills for the City of Chester and 24.0690 mills for Upland Borough/Chester Township[328]
- 2008-09 - 51.3360 mills for the City of Chester and 23.6620 mills for Upland Borough/Chester Township [329]
- 2007-08 - 51.3360 mills for the City of Chester and 23.4830 mills for Upland Borough/Chester Township[330]
- 2006-07 - 51.3360 mills for the City of Chester and 23.7417 mills for Upland Borough/Chester Township[331]
- 2005-06 - 49.7610 mills for the City of Chester and 23.5000 mills for Upland Borough/Chester Township[332]
Wellness policy
Chester Upland School Board established a district wellness policy.[333] The policy deals with nutritious meals served at school, the control of access to some foods and beverages during school hours, age appropriate nutrition education for all students, and physical education for students K-12. The policy is in response to state mandates and federal legislation (P.L. 108 – 265). The law dictates that each school district participating in a program authorized by the Richard B. Russell National School Lunch Act (42 U.S.C. 1751 et seq) or the Child Nutrition Act of 1966 (42 U.S.C. 1771 et seq) "shall establish a local school wellness policy by School Year 2006." Most districts identified the superintendent and school foodservice director as responsible for ensuring local wellness policy implementation.[334]
The legislation placed the responsibility of developing a wellness policy at the local level so the individual needs of each district can be addressed. According to the requirements for the Local Wellness Policy, school districts must set goals for nutrition education, physical activity, campus food provision, and other school-based activities designed to promote student wellness. Additionally, districts were required to involve a broad group of individuals in policy development and to have a plan for measuring policy implementation. Districts were offered a choice of levels of implementation for limiting or prohibiting low nutrition foods on the school campus. In final implementation these regulations prohibit some foods and beverages on the school campus.[335] The Pennsylvania Department of Education required the district to submit a copy of the policy for approval.
The District offers both a free school breakfast and a free or reduced-price lunch to all its children. All students attending the school can eat breakfast and lunch. Children from families with incomes at or below 130 percent of the federal poverty level are provided a breakfast and lunch at no cost to the family. Children from families with incomes between 130 and 185 percent of the federal poverty level can be charged no more than 30 cents per breakfast. A foster child whose care and placement is the responsibility of the State or who is placed by a court with a caretaker household is eligible for both a free breakfast and a free lunch. Runaway, homeless and Migrant Youth are also automatically eligible for free meals.[336] The meals are partially funded with federal dollars through the United States Department of Agriculture.[337]
In 2013, the USDA issued new restrictions to foods in public schools. The rules apply to foods and beverages sold on all public school district campuses during the day. They limit vending machine snacks to a maximum of 200 calories per item. Additionally, all snack foods sold at school must meet competitive nutrient standards, meaning they must have fruits, vegetables, dairy or protein in them or contain at least 10 percent of the daily value of fiber, calcium, potassium, and Vitamin D.[338] In order to comply with the Healthy, Hunger-Free Kids Act of 2010 all US public school districts are required to raise the price of their school lunches to $2.60 regardless of the actual cost of providing the lunch.[339] The Healthy Hunger-Free Kids Act of 2010 mandates that Districts raise their full pay lunch prices every year until the price of non-subsidized lunches equals the amount the federal government reimburses schools for free meals. That subsidy in 2013-2014 was $2.93.
In 2014, President Obama ordered a prohibition of advertisements for unhealthy foods on public school campuses during the school day.[340] The Food and Drug Administration requires that students take milk as their beverage at lunch. In accordance with this law, any student requesting water in place of milk with their lunch must present a written request, signed by a doctor, documenting the need for water instead of milk.[341]
CHester Upland School District provides health services as mandated by the Commonwealth and the federal government. Nurses are available in each building to conduct annual health screenings (data reported to the PDE and state Department of Health) and to dispense prescribed medications to students during the school day. Students can be excluded from school unless they comply with all the State Department of Health’s extensive immunization mandates. School nurses monitor each pupil for this compliance.[342][343] Nurses also monitor each child's weight.[344]
Extracurriculars
The Chester Upland School District offers a wide variety of clubs, activities and an extensive, publicly funded sports program.[345] Eligibility for participation is determined by school board policy and in compliance with standards set by the Pennsylvania Interscholastic Athletic Association (PIAA).
According to Pennsylvania’s Safety in Youth Sports Act, all sports coaches, paid and volunteer, are required to annually complete the Concussion Management Certification Training and present the certification before coaching.[346][347]
By Pennsylvania law, all K-12 students residing in the district, including those who attend a private nonpublic school, cyber charter school, charter school and those homeschooled, are eligible to participate in the extracurricular programs including all athletics. They must meet the same eligibility rules as the students enrolled in the district's schools.[348]
Coaches receive compensation as outlined in the teachers' union contract. When athletic competition exceeds the regular season, additional compensation is paid.[349]
Sports
The District funds:
- Varsity
|
|
References
- ↑ Philadelphia Inquirer, Chester Upland to close Columbus Elementary, December 21, 2012
- ↑ PDE (2015). "Chester Upland School District Schools".
- ↑ PDE (2015). "ED Names and Adresses Chester Upland School District".
- ↑ PDE, ED Names and Addresses, 2014
- ↑ NCES, Common Core of Data Chester-Upland School District, 2014
- ↑ National Center for Education Statistics (2014). "Common Core of Data Chester Upland School District".
- ↑ Pennsylvania Department of Education (November 6, 2014). "Chester-Upland School District Fast Facts 2014".
- ↑ Pennsylvania Department of Education (October 4, 2013). "Chester-Upland School District Fast Facts 2013".
- ↑ NCES, Common Core of Data - Chester Upland School District 2011-12, 2014
- ↑ Pennsylvania Department of Education (July 20, 2011). "Enrollment and Projections by School District".
- ↑ PDE, Enrollment by LEA 2014, 2015
- ↑ Becky Taylor, Chester Upland School District Press office (July 7, 2014). "CHESTER UPLAND SCHOOL DISTRICT RECEIVER ADOPTS $118.4 MILLION BUDGET" (PDF).
- ↑ Hardy, Dan, Chester Upland school board passes bare-bones budget, Philadelphia inquirer, June 28, 2012
- ↑ Chester Upland Education Empowerment Board (2010). "Chester Upland School District Budget 2010-11" (PDF).
- ↑ US Census Bureau, American Fact Finder, 2009
- ↑ US Census Bureau (2010). "American Fact Finder, State and County quick facts".
- ↑ US Census Bureau (September 2011). "Income, Poverty, and Health Insurance Coverage in the United States: 2010" (PDF).
- ↑ US Census Bureau, 2010 Census Poverty Data by Local Education Agency, 2011
- ↑ proximityone (2014). "School District Comparative Analysis Profiles".
- ↑ Pennsylvania Budget and Policy Center, Education Facts Student Poverty Concentration by LEA, 2012
- ↑ US Census Bureau, American Fact Finder, 2009
- ↑ US Census Bureau (2010). "American Fact Finder, State and County quick facts".
- ↑ US Census Bureau (September 2011). "Income, Poverty, and Health Insurance Coverage in the United States: 2010" (PDF).
- ↑ US Census Bureau (2014). "Pennsylvania Median household income, 2006-2010 by County".
- ↑ Michael Sauter; Alexander E.M. Hess (August 31, 2013). "America's most popular six-figure jobs". USA Today.
- ↑ "In a bankrupt Pa. school district, teachers plan to work for free" (Archive). Washington Post. August 28, 2015. Retrieved on August 31, 2015.
- ↑ Dan Hardy and John P. Martin, Is there a solution for Chester Uplands Problems?, The inquirer, January 23, 2012
- ↑ The Chester Fund, Chester Upland School for the Arts, March 30, 2009.
- ↑ Pennsylvania Department of Education (September 29, 2011). "Chester Upland School District - Schools AYP Table".
- ↑ Pennsylvania Department of Education (September 29, 2011). "State Report: Status of Pennsylvania's Public Schools".
- ↑ Ron Tomalis Sec of Education, Testimony House Appropriations Committee Hearing on Chester Upland School District Financial Crisis, January 2012
- ↑ Pennsylvania Public School Code Governance 2010
- ↑ Pennsylvania General Assembly, Pennsylvania School Code, 2013
- ↑ "PETITION OF:CHESTER-UPLAND SCHOOL DISTRICT, SPECIAL BOARD OF CONTROL" (PDF). June 1, 2007.
- ↑ Pennsylvania Office of Auditor General, Report on Chester Upland School District, 2011
- ↑ Pennsylvania Department of Education, Governor Rendell Directs Education To File Suit To End 'Thorough Mismanagement' In Chester-Upland School District., October 3, 2005
- ↑ Stacy Brown (January 20, 2012). "Education secretary says Chester-Upland school district victim of poor management". PA Independent.
- ↑ Pennsylvania General Assembly (2012). "Governor Corbett Signs Legislation to Aid Financially Distressed Schools".
- ↑ Pennsylvania Department of Education (December 1, 2014). "Acting Secretary of Education Petitions Delaware County Court for Appointment of New Receiver for Chester Upland School District".
- ↑ Pennsylvania Department of Education (July 2012). "Opportunity Scholarship Tax Credit Program".
- ↑ Pennsylvania Department of Education (May 2012). "Tuition rate Fiscal Year 2011–2012".
- ↑ Olsen, Laura, State list of failing schools has 53 in county, Pittsburgh Post Gazette, July 26, 2012
- ↑ Office of the Pennsylvania Auditor General (June 5, 2013). "Chester Upland School District Performance Audit" (PDF).
- ↑ Pennsylvania Department of Education (April 21, 2014). "Opportunity Scholarship Tax Credit Program".
- ↑ PDE, 2015-16 OSTCP list, May 2015
- ↑ Dan Hardy (September 26, 1997). "6 Schools Could Close In Chester Upland The Numbers In The District Have Dropped. Shutting Some Buildings Could Save Money, Officials Say". Philadelphia Inquirer.
- ↑ Public Financial Management (November 13, 2012). "School Districts Financial Recovery Act Recovery Plan - Revised" (PDF).
- ↑ Pittsburgh Business Times (April 11, 2014). "Statewide Honor Roll Rankings Information 2014".
- ↑ Pittsburgh Business Times, Statewide School Academics Ranking - Delaware County Public School Districts, April 6, 2012
- ↑ Pittsburgh Business Times, Statewide Honor Roll Rankings Information 2013, April 4, 2013
- ↑ Pittsburgh Business Times, Statewide Honor Roll Rankings Information 2012, April 6, 2012
- ↑ Pittsburgh Business Times, Statewide Honor Roll Rankings 2010, April 30, 2010
- ↑ "Three of top school districts in state hail from Allegheny County". Pittsburgh Business Times. May 23, 2007. Archived from the original on 2011-07-18.
- ↑ "Overachiever statewide ranking". Pittsburgh Business Times. May 6, 2010.
- ↑ Kintisch, Baruch Esq, Testimony on Fiscally Distressed School Districts before Pennsylvania Senate Education Committee, January 24, 2012
- ↑ The Morning Call, 2009 PSSA RESULTS School District, 2009
- ↑ Pennsylvania Department of Education, Pennsylvania Pre-K Counts Grantees, 2010–11, May 2011
- ↑ Pennsylvania Department of Education (September 21, 2012). "Chester-Upland School District AYP Report 2012".
- ↑ Pennsylvania Department of Education, Chester Upland School District AYP Overview 2011, September 29, 2011
- ↑ Pennsylvania Department of Education, District AYP Report 2003–2011, September 2011
- ↑ "Chester High School Fast Facts 2013". October 4, 2013.
- ↑ Pennsylvania Department of Education (September 21, 2012). "Chester Upland School District AYP Data Table".
- ↑ Pennsylvania Department of Education (September 29, 2011). "Chester Upland School District AYP Data Table".
- ↑ Pennsylvania Department of Education (March 15, 2011). "New 4-year Cohort Graduation Rate Calculation Now Being Implemented".
- ↑ Pennsylvania Department of Education (2010). "Chester Upland School District Academic Achievement Report Card Data table". Archived from the original on 2012-03-27.
- ↑ The Times-Tribune (June 27, 2010). "PA School District Statistical Snapshot Database 2008–09".
- ↑ The Times-Tribune (June 25, 2009). "County School Districts Graduation Rates 2008".
- ↑ Pennsylvania Partnerships for Children (2008). "High School Graduation rate 2007" (PDF).
- ↑ "Schools Have High Dropout Rates,". WPXI.com,. October 29, 2007.
- ↑ Robert Balfanz and Nettie Legters, Locating the Drop out Crisis, Johns Hopkins University, September 2004
- ↑ Robert Balfanz, Center for Social Organization of Schools, Johns Hopkins University (2007). "Schools with a Three Year Average Promoting Power Ratio (Class of 2004, 2005 and 2006) of 60% or Less" (PDF).
- ↑ Pennsylvania Department of Education (January 20, 2009). "Pennsylvania College Remediation Report,". Archived from the original on 2012-05-03.
- ↑ National Center for Education Statistics, IPEDS Integrated Postsecondary Education Data System, 2008
- ↑ Pennsylvania Department of Education. "Dual Enrollment Guidelines".
- ↑ Commonwealth of Pennsylvania (March 2010). "Pennsylvania Transfer and Articulation Agreement".
- ↑ Pennsylvania Department of Education. "Dual Enrollment Grants 2009 10 Fall Grants by School District".
- ↑ PDE, School Performance profile, November 6, 2014
- ↑ Pennsylvania Department of Education (2014). "SAT and ACT Scores".
- ↑ College Board (2014). "2014 College-Bound Seniors State Profile Report" (PDF).
- ↑ College Board (2013). "The 2013 SAT Report on College & Career Readiness".
- ↑ Pennsylvania Department of Education (2011). "Public School SAT Scores 2011". Archived from the original on 2011-10-15.
- ↑ College Board (September 2011). "SAT Scores State By State - Pennsylvania". Archived from the original on 2011-10-08.
- ↑ "While U.S. SAT scores dip across the board, N.J. test-takers hold steady". NJ.com. September 2011.
- ↑ Pennsylvania State Board of Education. "Pennsylvania Code §4.24 (a) High school graduation requirements".
- ↑ Pennsylvania Department of Education (2010). "Keystone Exam Overview" (PDF).
- ↑ Pennsylvania Department of Education (September 2011). "Pennsylvania Keystone Exams Overview". Archived from the original on 2012-03-17.
- ↑ Pennsylvania State Board of Education (2010). "Rules and Regulation Title 22 PA School Code CH. 4".
- ↑ US News; World Report (2014). "Best High Schools Pennsylvania".
- ↑ Nation Center for Education Statistics, CCD Public school data 2009–2010 school year Chester High School - Main Campus, 2010
- ↑ Pennsylvania Department of Education (November 6, 2014). "Chester High School Academic Performance Data 2014".
- ↑ Evamarie Socha (November 6, 2014). "Half of Valley districts see state test scores decline". The Daily Item.
- ↑ Eleanor Chute (November 21, 2014). "Pennsylvania student scores declined with reduced funding, test results show". Pittsburgh Post-Gazette.
- ↑ Acting Secretary of Education Carolyn Dumaresq, Acting Secretary of Education Announces Results of 2013-14 School Performance Profile; Strong Performance in 72 Percent of Schools, November 6, 2014
- ↑ Kathy Boccella; Dylan Purcell; Kristen A. Graham (November 6, 2014). "Pa. school rankings: Downingtown STEM No. 1; Phila. falters". Philadelphia Inquirer.
- ↑ Jan Murphy (November 6, 2014). "More Pa. school scores decline than improve, state report card shows". Pennlive.com.
- ↑ Evamarie Socha (November 6, 2014). "Half of Valley districts see state test scores decline".
- ↑ Pennsylvania Department of Education (October 4, 2013). "Chester High School Academic Performance Data 2013".
- ↑ Eleanor Chute; Mary Niederberger (December 11, 2013). "New assessment shows fuller picture of Pa. schools". Pittsburgh Post-Gazette.
- ↑ PDE, Graduation Rate Chester High School, 2014
- ↑ PDE, Graduation Rate Chester High School, 2013
- ↑ Pennsylvania Department of Education (September 21, 2012). "Chester Upland School District AYP report 2012".
- ↑ Pennsylvania Department of Education, Chester High School AYP DataTable 2011, September 29, 2011
- ↑ Pennsylvania Department of Education, Chester High School AYP DataTable 2010, October 20, 2010
- ↑ Pennsylvania Department of Education (September 29, 2011). "CHESTER High School AYP Overview 2012".
- ↑ Pennsylvania Department of Education, Chester High School AYP Overview 2011, September 29, 2011
- ↑ Pennsylvania Department of Education (2014). "State Academic Standards".
- ↑ Pennsylvania Department of Education (2014). "State Assessment System".
- ↑ Pennsylvania Department of Education (September 21, 2012). "2011-2012 PSSA and AYP Results".
- ↑ Pennsylvania Department of Education (September 29, 2011). "2010-2011 PSSA and AYP Results".
- ↑ Pennsylvania Department of Education (2010). "2009-2010 PSSA and AYP Results".
- ↑ The Times-Tribune. (September 2009). "Grading Our Schools database, 2009 PSSA results,".
- ↑ Pennsylvania Department of Education (August 2008). "2007-2008 PSSA and AYP Results".
- ↑ Pennsylvania Department of Education (2007). "PSSA Math and Reading results".
- ↑ Pennsylvania Department of Education (September 21, 2012). "Chester High School Main Campus Academic Achievement Report Card 2012" (PDF).
- ↑ Pennsylvania Department of Education, Chester High School Main Campus Academic Achievement Report Card 2011, September 29, 2011
- ↑ Pennsylvania Department of Education (September 29, 2011). "2010-2011 PSSA results in Science".
- ↑ The Times-Tribune. (2009). "Grading Our Schools database, 2009 Science PSSA results,".
- ↑ Pennsylvania Department of Education (September 29, 2011). "Chester High School - Crozier Allied Health Campus AYP Overview".
- ↑ NCES, CCD Public school data 2009–2010 school year Chester High School Crozier Allied Health Campus, 2010
- ↑ Pennsylvania Department of Education, 2010–2011 PSSA and AYP Results, September 29, 2011
- ↑ Pennsylvania Department of Education (September 21, 2012). "Chester High School - Crozier Allied Health Campus Academic Achievement Report Card 2012" (PDF).
- ↑ Pennsylvania Department of Education (September 29, 2011). "Chester High School - Crozier Allied Health Campus Academic Achievement Report Card 2011".
- ↑ Pennsylvania Department of Education, 2010–2011 PSSA results in Science, September 29, 2011
- ↑ Dan Hardy (September 14, 2011). "Chester Upland students walk out over crowded classes, schedule changes". Inquirer.
- ↑ Pennsylvania Department of Education, Chester High School - Science and Discovery Campus Professional Qualifications of Teachers, September 29, 2011
- ↑ NCES, CCD Public school data 2009–2010 school year Chester High School - Science and Discovery Campus 2010
- ↑ Pennsylvania Department of Education (October 4, 2013). "Chester Upland STEM High School Academic Performance Data 2013".
- ↑ Pennsylvania Department of Education (September 21, 2012). "Chester High School - Science and Discovery Campus AYP Overview 2012".
- ↑ Pennsylvania Department of Education, Chester High School - Science and Discovery Campus AYP Overview 2011, September 29, 2011
- ↑ Pennsylvania Department of Education (September 29, 2011). "2010-2011 PSSA and AYP Results".
- ↑ Michael Adamek, Principal, Chester Upland School District (August 15, 2011). "Notice of Adequate Yearly Progress, Public School Choice" (PDF).
- ↑ Pennsylvania Department of Education (September 21, 2012). "Chester High School - Science and Discovery Campus Academic Achievement Report Card 2012" (PDF).
- ↑ Pennsylvania Department of Education, Chester High School - Science and Discovery Campus Academic Achievement Report Card 2011, September 29, 2011
- ↑ Pennsylvania Department of Education, 2010–2011 PSSA results in Science, September 29, 2011
- ↑ Pennsylvania Department of Education (October 4, 2013). "Columbus Elementary School Fast Facts 2013".
- ↑ Pennsylvania Department of Education, School Performance Profile, Columbus Elementary School Fast Facts 2013, October 4, 2013
- ↑ Pennsylvania Department of Education (October 4, 2013). "Columbus Elementary School Academic Performance Data 2013".
- ↑ Pennsylvania Department of Education (September 29, 2011). "Columbus Elementary School - School AYP Overview 2010".
- ↑ Pennsylvania Department of Education (September 29, 2011). "Columbus Elementary School - School AYP Data Table".
- ↑ Pennsylvania Department of Education (June 30, 2010). "PDE School Improvement Grants Application" (PDF).
- ↑ NCES, CCD Public school data 2009–2010 school year Columbus Elementary School, 2010
- ↑ Pennsylvania Department of Education (September 21, 2012). "Columbus Elementary School Academic Achievement Report Card 2012" (PDF).
- ↑ Pittsburgh Post Gazette (October 15, 2012). "How is your school doing?".
- ↑ Pennsylvania Department of Education, 2010 PSSAs: Reading, Math, Writing Results, September 14, 2010
- ↑ Pennsylvania Department of Education, Science PSSA 2010 by Schools, August 2010
- ↑ Pennsylvania Department of Education (September 29, 2011). "COLUMBUS Elementary School Chester Upland Academics Report Card 2011" (PDF).
- ↑ Pennsylvania Department of Education (October 4, 2013). "Main Street Elementary School Fast Facts".
- ↑ Pennsylvania Department of Education, School Performance Profile, Main Street Elementary School Fast Facts, 2013
- ↑ Pennsylvania Department of Education (September 21, 2011). "Main Street School AYP Overview 2012".
- ↑ ennsylvania Department of Education, Main Street School AYP Overview 2011, September 29, 2011
- ↑ Pennsylvania Department of Education (September 29, 2011). "MAIN STREET School AYP Data Table".
- ↑ Karen Jones-Rodgers (August 15, 2011). "Main Street Elementary School Notice of Adequate Yearly Progress, Public School Choice" (PDF).
- ↑ NCES, CCD Public school data 2009–2010 school year Main Street School, 2010
- ↑ Pennsylvania Department of Education (August 2008). "Reading and Math PSSA 2008 by Schools".
- ↑ Pennsylvania Department of Education Report (September 14, 2010). "2010 PSSAs: Reading, Math, Writing Results".
- ↑ Pennsylvania Department of Education. "2009 PSSAs: Reading, Math, Writing and Science Results".
- ↑ Pennsylvania Department of Education, Report on Science PSSA 2010 by Schools, August 2010
- ↑ Pennsylvania Department of Education, Report on Science PSSA 2009 by Schools, August 2009
- ↑ Pennsylvania Department of Education, Report Science PSSA 2008 by Schools, August 15, 2008
- ↑ Pennsylvania Department of Education (September 21, 2012). "Main Street School Academic Achievement Report Card 2012" (PDF).
- ↑ Pennsylvania Department of Education, Main Street School Academic Achievement Report Card 2011, September 29, 2011
- ↑ Pennsylvania Department of Education (October 4, 2013). "Chester Upland School for the Arts Fast Facts 2013".
- ↑ Pennsylvania Department of Education, School Performance Profile, Chester Upland School for the Arts Fast Facts 2013, October 4, 2013
- ↑ Pennsylvania Department of Education (October 4, 2013). "Chester Upland School for the Arts Academic Performance Data 2013".
- ↑ National Center for Education Statistics, Common Core Data – Elementary School, 2011
- ↑ Wendy C. Leslie, Chester Upland School of the Arts Receives $360,000 Grant from Doris Buffett's The Sunshine Lady Foundation, June 24, 2010
- ↑ NCES, CCD Public school data 2009–2010 school year Chester Upland School of the Arts, 2010
- ↑ John Kopp (January 26, 2012). "Chester Upland denies proposal for charter school". DelcoTimes.
- ↑ Pennsylvania Department of Education (September 21, 2012). "CHESTER UPLAND SCHOOL OF ARTS - School AYP Overview 2012".
- ↑ Pennsylvania Department of Education (September 29, 2011). "CHESTER UPLAND SCHOOL OF ARTS - School AYP Overview".
- ↑ Pennsylvania Department of Education (September 21, 2012). "CHESTER UPLAND SCHOOL OF ARTS Academic Achievement Report Card 2012".
- ↑ Pennsylvania Department of Education, CHESTER UPLAND SCHOOL OF ARTS Academic Achievement Report Card 2011, September 29, 2011
- ↑ Philadelphia Inquirer (September 29, 2011). "Pennsylvania System of School Assessment results".
- ↑ Pennsylvania Department of Education, CHESTER UPLAND SCHOOL OF ARTS Academic Achievement Report Card 2010, October 20, 2010
- ↑ Pennsylvania Department of Education (October 4, 2013). "Elementary School Fast Facts".
- ↑ Pennsylvania Department of Education, School Performance Profile, Stetser Elementary School Fast Facts, 2013
- ↑ National Center for Education Statistics, Common Core Data – Stetser Elementary School, 2011
- ↑ Pennsylvania Department of Education (September 29, 2011). "Stetser Elementary School AYP Data table".
- ↑ John Kopp, Stetser students grow food, DelCo times, September 13, 2011
- ↑ Pennsylvania Department of Education (October 4, 2013). "Stetser Elementary School Academic Performance Data 2013".
- ↑ Pennsylvania Department of Education (September 21, 2012). "Stetser Elementary School AYP Overview 2012".
- ↑ Pennsylvania Department of Education, Stetser Elementary School AYP Overview 2011, September 29, 2011
- ↑ Pennsylvania Department of Education (September 21, 2012). "Stetser Elementary School Academic Achievement Report Card 2012" (PDF).
- ↑ Pennsylvania Department of Education, Stetser Elementary School Academic Achievement Report Card 2011, September 29, 2011
- ↑ Pennsylvania Department of Education (September 29, 2011). "The Village at Chester Upland School AYP Overview".
- ↑ Pennsylvania Department of Education, The Village at Chester Upland School AYP Data Table, September 29, 2011
- ↑ Commonwealth of Pennsylvania (2002). "Village Charter School v. Chester Upland School District; et al.".
- ↑ Gary Miron; Christopher Nelson; John Risley; with Carolyn Sullins (October 2002). "Strengthening Pennsylvania's Charter School Reform: Findings From the Statewide Evaluation and Discussion of Relevant Policy Issues" (PDF). The Evaluation Center Western Michigan University.
- ↑ Pennsylvania Auditor General (May 2002). "Pennsylvania Auditor General, Village Charter School of Chester-Upland Delaware County, Pennsylvania Audit report".
- ↑ NCES, CCD Public school data 2009–2010 school year The Village at Chester Upland School, 2010
- ↑ Pennsylvania Department of Education (September 21, 2012). "The Village at Chester Upland School Academic Achievement Report Card 2012" (PDF).
- ↑ Pennsylvania Department of Education, The Village at Chester Upland School Academic Achievement Report Card 2011, September 29, 2011
- ↑ Pennsylvania Department of Education, Reading and Math PSSA 2008 by Schools, August 15, 2008
- ↑ Pennsylvania Department of Education, 2010 PSSAs: Reading, Math, Writing Results, September 14, 2010
- ↑ Pennsylvania Department of Education, 2009 PSSAs: Reading, Math, Writing and Science Results, 2009
- ↑ Pennsylvania Department of Education, Report Science PSSA 2010 by Schools, 2010
- ↑ Pennsylvania Department of Education, Report Science PSSA 2009 by Schools, August 2009
- ↑ Pennsylvania Department of Education, Report Science PSSA 2008 by Schools, August 15, 2008
- ↑ Pennsylvania Department of Education (October 4, 2013). "Toby Farms Intermediate School School Fast Facts".
- ↑ Pennsylvania Department of Education, Professional Qualifications of Teachers Toby Farms Intermediate School, October 4, 2013
- ↑ NCES, CCD Public school data 2009–2010 school year Toby Farms Elementary School, 2010
- ↑ Pennsylvania Department of Education (October 4, 2013). "Toby Farms Intermediate School Academic Performance Data 2013".
- ↑ Pennsylvania Department of Education (September 29, 2011). "Toby Farms Elementary School AYP Overview 2011".
- ↑ Doreen Harvell, Principal (August 15, 2011). "Notice of Adequate Yearly Progress, Public School Choice" (PDF).
- ↑ Pennsylvania Department of Education. "IU16-PSSA 95-96 Results by School". Retrieved May 11, 2014.
- ↑ Pennsylvania Department of Education (2014). "Standards Aligned Systems".
- ↑ Pennsylvania Department of Education (2014). "State Academic Standards".
- ↑ Pennsylvania Department of Education (2014). "State Academic Standards Mathematics".
- ↑ Pennsylvania Department of Education (September 21, 2012). "Toby Farms Elementary School Academic Achievement Report Card 2012" (PDF).
- ↑ Pennsylvania Department of Education, Toby Farms Elementary School Academic Achievement Report Card 2011, September 29, 2011
- ↑ Pennsylvania Department of Education (October 4, 2013). "Showatter Intermediate School School Fast Facts 2013".
- ↑ Pennsylvania Department of Education, Professional Qualifications of Teachers Showatter Intermediate School, October 4, 2013
- ↑ Pennsylvania Department of Education (October 4, 2013). "Showatter Intermediate School Academic Performance Data 2013,".
- ↑ Pennsylvania Bureau of Special Education Services (2012–2013). "Chester Upland School District Special Education Data Report LEA Performance on State Performance Plan (SPP) Targets". Archived from the original on 2011-08-24.
- ↑ Pennsylvania Department of Education, Testimony Hearing on Special Education Senate Republican Policy Committee, January 2013
- ↑ Pennsylvania Bureau of Special Education Services (2009–2010). "Chester Upland School District Special Education Data Report LEA Performance on State Performance Plan (SPP) Targets". Archived from the original on 2011-08-24.
- ↑ Pennsylvania Department of Education. "Pennsylvania Special Education Funding".
- ↑ Senator Patrick Browne (November 1, 2011). "Senate Education Committee Holds Hearing on Special Education Funding & Accountability". Archived from the original on 2012-07-23.
- ↑ Pennsylvania Department of Education Amy Morton, Executive Deputy Secretary (November 11, 2011). "Public Hearing: Special Education Funding & Accountability Testimony". Archived from the original on 2012-04-22.
- ↑ Baruch Kintisch Education Law Center (November 11, 2011). "Public Hearing: Special Education Funding & Accountability Testimony" (PDF). Archived from the original (PDF) on 2012-04-22.
- ↑ US Department of Education, U.S. Department of Education Clarifies Schools' Obligation to Provide Equal Opportunity to Students with Disabilities to Participate in Extracurricular Athletics, January 25, 2013
- ↑ Pennsylvania Department of Education (July 2010). "Special Education Funding from Pennsylvania State_2010-2011".
- ↑ Pennsylvania Department of Education (2011). "Special Education Funding 2011–2012 Fiscal Year".
- ↑ Commonwealth of Pennsylvania Safe School Center (2009). "Pennsylvania Safe Schools Online Reports".
- ↑ Chester-Upland School Board. "Anti-Bullying Policy effective December 2006".
- ↑ Chester Upland School District Administration. "Chester Upland School District Bullying Report Procedure" (PDF). Retrieved February 5, 2012.
- ↑ Pennsylvania General Assembly (2006). "Regular Session 2007–2008 House Bill 1067, Act 61 Section 6 page 8".
- ↑ Center for Safe Schools of Pennsylvania (2006). "Bullying Prevention advisory".
- ↑ Pennsylvania State Board of Education (January 11, 2003). "Pennsylvania Academic Standards Health, Safety and Physical Education".
- ↑ CTC Network (October 11, 2007). "Chester Education Foundation Initiative News" (PDF).
- ↑ Dianne Naber (2003). "Pennsylvania No Child Left Behind Performance report" (PDF).
- ↑ Pennsylvania Department of Education, Reading and Math PSSA 2008 by Schools, August 15, 2008
- ↑ Pennsylvania Department of Education, 2009 PSSAs: Reading, Math, Writing and Science Results, 2009
- ↑ Pennsylvania Department of Education Report, Science PSSA 2009 by Schools, August 2009
- ↑ Pennsylvania Department of Education, Report Science PSSA 2008 by Schools, August 15, 2008
- ↑ Commonwealth of Pennsylvania, Chester Upland School District v. Commonwealth of Pennsylvania, et al., C.A. No. 12-132 Notice of hearing, July 2012
- ↑ PILC of Philadelphia (2013). "Funding in the Chester Upland School District".
- ↑ Pennsylvania Department of Education (September 29, 2011). "Widener Partnership Charter School Academic Report Card 2011" (PDF).
- ↑ Pennsylvania Department of Education (September 29, 2011). "Chester Community Charter School Academic Report Card 2011" (PDF).
- ↑ Valerie Strauss, Chester Upland teacher: Who is going to help our schools? Washington Post, January 20, 2012
- ↑ Rep. Joe Markoseck, Chester Upland School District First Symptom of Statewide Issue, January 19, 2012
- ↑ Kopp, John, Appeal board OKs charter school in Chester, The DelcoTimes, July 25, 2012
- ↑ Pennsylvania General Assembly, Taxpayer Relief Act, Act 1 of the Special Session of 2006, June 27, 2006
- ↑ Alex Rose (August 25, 2015). "Expert: Chester Upland drowning in red ink". Delaware County Daily Times.
- ↑ The Associated Press (August 28, 2015). "Philly-area school district says it can't make payroll amid budget stalemate".
- ↑ Laura Benshoff (August 26, 2015). "Judge rejects state plan to rescue Chester Upland district and cut charter payments". Newsworks.
- ↑ Vince Sullivan (July 9, 2015). "Interim receiver appointed for Chester Upland". Delaware County Daily Times.
- ↑ Kathy Boccella (June 25, 2015). "Joe Watkins quits as receiver of Chester Upland schools". Philadelphia Inquirer.
- ↑ Pennsylvania Department of Education (2013). "Investing in Pennsylvania Students".
- ↑ "Chester Upland School District Payroll report 2012". OpenPA Gov.org. 2013. Archived from the original on 2010-11-19.
- ↑ Times Tribune (June 16, 2013). "PA Teacher Profile Database 2011-12".
- ↑ OpenPA Gov.org, Chester Upland School District Payroll report 2009-2010, 2013
- ↑ Asbury Park Press (2009). "PA. Public School Salaries".
- ↑ CHester Upland School Board (2010). "Chester Upland School District Teacher Union Employment Contract 2010". Archived from the original on 2010-11-19.
- ↑ Fenton, Jacob., Pennsylvania School District Data: Will School Consolidation Save Money?, The Morning Call, February 2009
- ↑ Pennsylvania School Board Association (October 2009). "Public School Salaries 11th Annual". Archived from the original on 2008-10-05.
- ↑ Pennsylvania School Board Association (June 22, 2012). "School Management Salaries Report". School Leader News. Archived from the original on 2013-09-21.
- ↑ Vince Sullivan; Delaware County Daily Times (March 13, 2014). "Chester Upland announces elimination of 9 administrative jobs as part of cost saving move".
- ↑ Penn State Cooperative Extension (2010). "What are the Local Taxes in Pennsylvania?, Local Tax Reform Education Project" (PDF).
- ↑ Pennsylvania Department of Revenue (April 2010). "Personal Income Taxation Guidelines".
- ↑ John Finnerty (2013). "PA teachers pensions". CNHI Harrisburg Bureau.
- ↑ Pennsylvania Representative Todd Stephens (January 23, 2014). "LEEF Funding Chart 2014".
- ↑ PDE (July 7, 2014). "Enacted Education Budget 2014-2015".
- ↑ Pennsylvania Department of Education, 2014-15 Enacted Education Budget Fast Facts, July 14, 2014
- ↑ Democrat Appropriations Committee, Report on Education funding by LEA, July 2, 2013
- ↑ Sam Wood; Brian X. McCrone (January 29, 2014). "Montgomery County lawmaker proposes using Pa. horse racing funds for education". Philadelphia Inquirer.
- ↑ Pennsylvania Office of the Budget, 2013-14 State Budget Highlights, 2013
- ↑ Senator Jake Corman (June 28, 2012). "Pennsylvania Education funding by Local School District" (PDF). Archived from the original (PDF) on 2012-07-30.
- ↑ Pennsylvania General Assembly Sen Jake Corman (June 29, 2012). "SB1466 of 2012 General Fund Appropriation".
- ↑ PA Senate Appropriations Committee (June 28, 2011). "School District 2011-12 Funding Report".
- ↑ Pennsylvania Department of Education (July 2011). "Basic Education Funding".
- ↑ Pennsylvania Department of Education (June 30, 2011). "Basic Education Funding".
- ↑ Pennsylvania Department of Education (June 30, 2011). "Basic Education Funding 2011-2012 Fiscal Year".
- ↑ Pennsylvania Department of Education, District Allocations Report 2009, 2009-10
- ↑ Pennsylvania House Appropriations Committee (June 30, 2010). "PA Basic Education Funding-Printout2 2010-2011" (PDF).
- ↑ Office of the Budget (February 2010). "Pennsylvania Budget Proposal 2010".
- ↑ Pennsylvania Department of Education (October 2009). "Funding Allocations by district 2009-10".
- ↑ Pennsylvania Office of Budget (February 2009). "Governor's Budget Proposal 2009 Pennsylvania Department of Education Budget Proposal 2009".
- ↑ Pennsylvania Department of Education, Funding Report by LEA, 2009
- ↑ U.S. Census Bureau., Annual Survey of Local Government Finances., 2000
- ↑ U.S. Census Bureau., 2008 Survey of Local Government Finances – School Systems, 2010
- ↑ Governor's Budget Office (2014). "Past Budgets 2013-14 to 2006-07".
- ↑ Pennsylvania Department of Education, Accountability Block Grant report Grantee list 2010, October 2010
- ↑ Pennsylvania Department of Education (2008). "Accountability Block Grant Mid Year report".
- ↑ Pennsylvania Partnership for Children, Full-Day Kindergarten Enrollment, 2011
- ↑ Pennsylvania Department of Education (2013). "Passport for Learning Block Grant".
- ↑ Pennsylvania Department of Education, Pennsylvania 2013-14 Pre-K Counts Grantees 2013-13, August 2013
- ↑ Pennsylvania Department of Education Early Childhood Advisor, Poverty Level by School District, 2007
- ↑ Office of Child Development and Early Learning (2011). "Pre-K Counts Grantees".
- ↑ Pennsylvania Department of Education - Office of Child Development and Early Learning (2008). "Applicants of PA Pre-K Counts for FY 2008-2009" (PDF).
- ↑ Claudio Sanchez (April 22, 2014). "What Exactly Is 'High-Quality' Preschool?". NPR.org.
- ↑ Jan Murphy (December 19, 2013). "Corbett: What Pa. will do with $51.7 million early learning grant "nothing short of amazing"". Patriot News.
- ↑ US Department of Education (December 19, 2013). "Six States Awarded Race to the Top-Early Learning Challenge (RTT-ELC) Grants to Build Statewide Systems of High-Quality Early Learning".
- ↑ Pennsylvania Auditor General (December 22, 2008). "Classrooms for the Future grants audit" (PDF).
- ↑ Cynthia Pulkowski Director; Science: It’s Elementary (2009). "Science Its Elementary 2008-2009" (PDF). Archived from the original (PDF) on 2014-10-06.
- ↑ Pennsylvania Department of Education, Science: It’s Elementary Grantees Students in 143 Schools Benefit from Intensive Science Curriculum, July 22, 2008
- ↑ Patricia Vathis Pennsylvania Department of Education, Grants and Subsidies Science: It’s Elementary, 2006
- ↑ Pennsylvania Department of Education, 2010-11 Science: It’s Elementary Application Guidelines, July 2010
- ↑ Press Office PDE (August 4, 2009). "Science its Elementary".
- ↑ Pennsylvania Department of Education (2010). "Educational Assistance Program Funding 2010-2011 Fiscal Year".
- ↑ CAIU 15 (2007). "Project 720". Archived from the original on 2015-06-26.
- ↑ Pennsylvania Department of Education (2007). "Transforming Pennsylvania High Schools".
- ↑ Robert Hayes Postupac, PROJECT 720: A CASE STUDY OF HIGH SCHOOL REFORM, University of Pittsburgh, 2011
- ↑ PA Office of the Budget, 2011-12 Budget General Fund - State Appropriations, June 28, 2011
- ↑ Department of Environmental Protection (2014). "Environmental Education Grants".
- ↑ Pennsylvania Department of Environmental Protection (April 22, 2013). "Governor Corbett Awards 92 Grants for Environmental Education and Stewardship".
- ↑ Pennsylvania Department of Education (May 23, 2012). "Pennsylvania Awards $36.1 Million to Strengthen Literacy Programs".
- ↑ Pennsylvania Department of Education Press Office (October 17, 2013). "Acting Secretary of Education Says Hybrid Learning Benefits Students; Highlights Success of First-Year Pilot Program".
- ↑ Commonwealth of Pennsylvania (2009). "County ARRA FUNDING Report". Archived from the original on 2011-03-07.
- ↑ ProPublica (2009). "Recovery Tracker Eye on the stimulus". Archived from the original on 2013-09-27.
- ↑ "School stimulus money". Pittsburgh Post-Gazette. March 12, 2009.
- ↑ Pennsylvania Department of Education, Race To The Top Webinar powerpoint for districts December 2009, December 9, 2009
- ↑ Governor's Press Office release (January 20, 2010). "Pennsylvania's 'Race to the Top' Fueled by Effective Reforms, Strong Local Support,".
- ↑ Race to the Top Fund, U.S. Department of Education, March 29, 2010.
- ↑ Gerald Zahorchak (December 2008). "Pennsylvania Race to the Top Letter to Superintendents" (PDF).
- ↑ Pennsylvania Department of Education (January 19, 2009). "Pennsylvania Race to the Top -School Districts Title I Allocations 2009-10".
- ↑ Pennsylvania Department of Education, Education Secretary Announces $19.78 Million Awarded to Enhance Academic Opportunities for At-Risk Students, July 11, 2012
- ↑ PDE, Real Estate Taxes 2014-15, 2015
- ↑ Pennsylvania Department of Education (2012). "Real Estate Tax Rates by School District 2012-13 Real Estate Mills".
- ↑ Pennsylvania Department of Education (2004). "Act 511 Tax Report".
- ↑ State Tax Equalization Board (2011). "State Tax Equalization Board About US". Archived from the original on 2012-11-14.
- ↑ Pennsylvania Auditor General office - Bureau of Audits (February 2011). "A Special Performance Audit of the Pennsylvania State Tax Equalization Boards" (PDF).
- ↑ Vince Sullivan, Chester Upland residents facing 3.4 percent tax hike, Delaware County Daily Times, June 24, 2014
- ↑ Pennsylvania Department of Education (2014). "Real Estate Tax Rates by School District 2013-14 Real Estate Mills".
- ↑ Pennsylvania Department of Education, Finances_Real Estate Tax Rates 2012-13, 2012
- ↑ Pennsylvania Department of Education (2011). "Real Estate Tax Millage by School District,".
- ↑ Pennsylvania Department of Education (2010). "Real Estate Tax Millage by School District,".
- ↑ Pennsylvania Department of Education, Financial Elements Reports, 2010
- ↑ Pennsylvania Department of Education, Financial Elements Reports 2008-09 Real Estate Mills, 2009
- ↑ Pennsylvania Department of Education, Real Estate Tax Millage by School District, 2008
- ↑ Pennsylvania Department of Education, Real Estate Tax Millage by School District, 2006
- ↑ Pennsylvania Department of Education, Real Estate Tax Millage by School District, 2005
- ↑ Chester Upland School Board, Policy Manual, Student Wellness Policy, 2014
- ↑ Probart C, McDonnell E, Weirich JE, Schilling L, Fekete V (September 2008). "Statewide assessment of local wellness policies in Pennsylvania public school districts.". J Am Diet Assoc. 108 (9): 1497–502. doi:10.1016/j.jada.2008.06.429. PMID 18755322.
- ↑ Pennsylvania Department of Education – Division of Food and Nutrition (July 2008). "Nutrition Standards for Competitive Foods in Pennsylvania Schools for the School Nutrition Incentive".
- ↑ USDA, Child Nutrition Programs - Eligibility Manual for School Meals, 2012
- ↑ Pennsylvania Hunger Action Center, The Pennsylvania School Breakfast Report Card, 2009
- ↑ USDA, Child Nutrition Programs, June 27, 2013
- ↑ United States Department of Agriculture (2011). "Food and Nutrition Service Equity in School Lunch Pricing Fact Sheet" (PDF). Archived from the original (PDF) on 2013-09-22.
- ↑ Denver Nicks (February 25, 2014). "White House Sets New Limits on Junk Food Ads in Schools". Time Magazine.
- ↑ USDA Food and Nutrition Service (2014). "School Meals FAQ".
- ↑ Pennsylvania State Department of Health (2010). "Pennsylvania Bulletin Doc. No. 10-984 School Immunizations; Communicable and Noncommunicable Diseases".
- ↑ Pennsylvania Department of Health (2014). "School Immunization Requirements".
- ↑ Pennsylvania Department of Health (2014). "MANDATED SCHOOL HEALTH SCREENINGS".
- ↑ Pennsylvania Department of Education (2013). "Disclosure of Interscholastic Athletic Opportunities".
- ↑ PA General Assembly (July 1, 2012). "Senate Bill 200 of Session 2011 Safety in Youth Sports Act".
- ↑ UMPC Sports Medicine (2014). "Managing Concussions in Student Athletes: The Safety in Youth Sports Act".
- ↑ Pennsylvania Office of the Governor Press Release (November 10, 2005). "Home-Schooled, Charter School Children Can Participate in School District Extracurricular Activities".
- ↑ Area School Board, Area School District Teacher Union Contract, 2014
External links
- Chester Upland School District
- "After Bailout, Privatization, School District Starts Over", ABC
- District Profile from greatschools.net
Delaware County, Pennsylvania schools | |||||||||||||||||||||||||||||||||||||||||||||||||||||||||||||||||
|---|---|---|---|---|---|---|---|---|---|---|---|---|---|---|---|---|---|---|---|---|---|---|---|---|---|---|---|---|---|---|---|---|---|---|---|---|---|---|---|---|---|---|---|---|---|---|---|---|---|---|---|---|---|---|---|---|---|---|---|---|---|---|---|---|---|
| |||||||||||||||||||||||||||||||||||||||||||||||||||||||||||||||||
| |||||||||||||||||||||||||||||||||||||||||||||||||||||||||||||||||