Chichester School District
| Chichester School District | |
|---|---|
 | |
| Address | |
|
401 Cherry Tree Road Upper Chichester, Pennsylvania, Delaware County 19061 United States | |
| Information | |
| Type | Public |
| Superintendent | Dr. Kathleen Sherman |
| School number | 9 locally elected members |
| Head teacher | Janice Miller Lion, Business Administrator |
| Faculty | 227 teachers (2010) |
| Grades | K-12 |
| Age | 5 years old to 21 years old Special Education |
| Enrollment | 3,364 pupils[1] |
| • Kindergarten | 229 |
| • Grade 1 | 258 |
| • Grade 2 | 244 |
| • Grade 3 | 258 |
| • Grade 4 | 230 |
| • Grade 5 | 268 |
| • Grade 6 | 231 |
| • Grade 7 | 265 |
| • Grade 8 | 239 |
| • Grade 9 | 313 |
| • Grade 10 | 288 |
| • Grade 11 | 274 |
| • Grade 12 | 259 |
| • Other | enrollment projected by PDE to be 3693 pupils by 2020 |
| Color(s) | Maroon & Gray |
| Mascot | Eagles |
| Budget | $62,533,160. (2012–13)[2] |
| Tuition | for nonresident and charter school students ES - $11,752.69, HS - $12,249.59 [3] |
| Website | http://www.chichestersd.org/ |
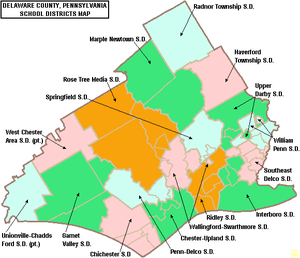
The Chichester School District is a midsized, suburban public school district located in southeastern Delaware County, Pennsylvania. It encompasses approximately 11 square miles covering the Boroughs of Marcus Hook and Trainer and Lower Chichester Township and Upper Chichester Township in Delaware County, Pennsylvania. According to 2000 federal census data, Chichester School District serves a resident population of 24,648. In 2009, the district residents’ per capita income was $20,972, while the median family income was $57,240.[4] In the Commonwealth, the median family income was $49,501[5] and the United States median family income was $49,445, in 2010.[6] According to District officials, in school year 2007–08 the Chichester School District provided basic educational services to 3,571 pupils through the employment of 302 teachers, 239 full-time and part-time support personnel, and 27 administrators. Chichester School District received more than $16.2 million in state funding in school year 2007–08.
Chichester School District is often incorrectly considered part of Aston, Pennsylvania because of the zip-code of the location where the school district is based out of is in Twin Oaks, Pennsylvania (Part of Chichester, Pennsylvania, but commonly associated with the Aston zip-code).
Schools
- Chichester High School (9th-12th) is currently the only high school in the Chichester School District. It is located in Boothwyn, Pennsylvania.
- Chichester Middle School (5th-8th) is currently the only middle school in the Chichester School District. It is located in Boothwyn, Pennsylvania.
There are currently four public elementary schools serving the school district:
- Boothwyn Elementary School (K-4th)
- Hilltop Elementary School (K-4th)
- Linwood Elementary School (K-4th)
- Marcus Hook Elementary School (K-4th)
- Trainer Elementary School previously served the Borough of Trainer, but students now attend Marcus Hook Elementary School
Governance
The school district is governed by 9 individually elected board members (serve four-year terms), the Pennsylvania State Board of Education, the Pennsylvania Department of Education and the Pennsylvania General Assembly.[7] The federal government controls programs it funds like Title I funding for low-income children in the Elementary and Secondary Education Act and the No Child Left Behind Act, which mandates the district focus resources on student success in acquiring reading and math skills.
The Commonwealth Foundation for Public Policy Alternatives Sunshine Review gave the school board and district administration a "C" for transparency based on a review of "What information can people find on their school district's website". It examined the school district's website for information regarding; taxes, the current budget, meetings, school board members names and terms, contracts, audits, public records information and more.[8]
Academic achievement
Chichester School District was ranked 453rd out of 498 Pennsylvania school districts in 2012, by the Pittsburgh Business Times. The ranking was based on student academic achievement as demonstrated on the last three years of the PSSAs for: reading, writing math and science.[9] The PSSAs are given to all children in grades 3rd through 8th and the 11th grade in high school. Adapted examinations are given to children in the special education programs. Chichester School District ranked 12th out of 15 public school districts in Delaware County. The highest ranking public school district in Delaware County was Radnor Township School District which ranked 4th statewide (2012).[10]
- 2011 - 463rd [11]
- 2010 - 454th[12]
- 2009 - 435th
- 2008 - 410th
- 2007 - 385th out of 501 school districts.[13]
- Overachiever Statewide Ranking
In 2012, the Pittsburgh Business Times reported an Overachievers Ranking for 498 Pennsylvania school districts. 'Chichester School District ranked 333rd. The paper describes the ranking as: "a ranking answers the question - which school districts do better than expectations based upon economics? This rank takes the Honor Roll rank and adds the percentage of students in the district eligible for free and reduced-price lunch into the formula. A district finishing high on this rank is smashing expectations, and any district above the median point is exceeding expectations."[14]
- 2011 - 387th
- 2010 - 387th
- 2009 - 377th
- Chichester School District AYP status history
In 2011 and 2010, Chichester School District achieved AYP status under the federal No Child Left Behind act even though the middle school is in Corrective Action and High Schools is in School Improvement status due to low reading and math skills. In 2011, School District achieved Adequate Yearly Progress (AYP). In 2011, 94 percent of the 500 Pennsylvania public school districts achieved the No Child Left Behind Act progress level of 72% of students reading on grade level and 67% of students demonstrating on grade level math. In 2011, 46.9 percent of Pennsylvania school districts achieved Adequate Yearly Progress (AYP) based on student performance. An additional 37.8 percent of school districts made AYP based on a calculated method called safe harbor, 8.2 percent on the growth model and 0.8 percent on a two-year average performance.
In 2009, the academic achievement of the students of Chichester School District was in the bottom 6 percentile among 500 Pennsylvania school districts. Scale - (0-99; 100 is state best)[15]
Graduation rate
In 2011, the graduation rate was 87%.[16] In 2010, the Pennsylvania Department of Education issued a new, 4-year cohort graduation rate. Chichester Senior High School's rate was 73% for 2010.[17]
According to traditional graduation rate calculations:
High school
Chichester High School is located at 3333 Chichester Avenue, Boothwyn. According to the National Center for Education Statistics, in 2010, the school reported an enrollment of 1,140 pupils in grades 9th through 12th, with 453 pupils eligible for a federal free or reduced-price lunch. The school employed 91.5 teachers, yielding a student–teacher ratio of 12:1.[22] According to a report by the Pennsylvania Department of Education, 4 teachers were rated "Non‐Highly Qualified" under No Child Left Behind.[23]
In 2011, the school declined to School Improvement I status, due to several years of not achieving AYP. In 2010, the school was in Warning status due to lagging student academic achievement in reading and mathematics.[24] In 2010, the school had 1140 students with 91 teachers.[25]
11th Grade Reading
- 2011 - 83.9% on grade level, (16% below basic). State - 69.1% of 11th graders are on grade level.[26]
- 2010 - 44% on grade level (36% below basic). In Pennsylvania, 66% of 11th graders are on grade level.[27]
- 2009 - 57% (20% below basic). State - 65%[28]
- 2008 - 52% (28% below basic). State - 65%[29]
- 2007 - 57% (21% below basic). State - 65%[30]
11th Grade Math:
- 2011 - 43%, on grade level (34% below basic). In Pennsylvania, 60.3% of 11th graders are on grade level.[31]
- 2010 - 40%, (40% below basic). State - 59%
- 2009 - 44% (30% below basic). State - 56%.
- 2008 - 41% (38% below basic). State - 56%
- 2007 - 47% (29% below basic). State - 53%
11th Grade Science:
- 2011 - 23% on grade level (26% below basic). State - 40% of 11th graders were on grade level.[32]
- 2010 - 20% (37% below basic). State - 39%
- 2009 - 29% (22% below basic). State - 40%[33]
- 2008 - 22% (22% below basic). State - 39%
College remediation rate
According to a Pennsylvania Department of Education study released in January 2009, 36% of the Chichester Senior High School graduates required remediation in mathematics and or reading before they were prepared to take college level courses in the Pennsylvania State System of Higher Education or community colleges.[34] Less than 66% of Pennsylvania high school graduates, who enroll in a four-year college in Pennsylvania, will earn a bachelor's degree within six years. Among Pennsylvania high school graduates pursuing an associate degree, only one in three graduate in three years.[35] Per the Pennsylvania Department of Education, one in three recent high school graduates who attend Pennsylvania's public universities and community colleges takes at least one remedial course in math, reading or English.
Dual enrollment The high school does not offer the Pennsylvania dual enrollment program which permits students to earn deeply discounted college credits while still enrolled in high school. The program is offered through over 400 school districts at no cost to the district.
SAT scores
From January to June 2011, 138 students took the SAT exams. The district's Verbal Average Score was 453. The Math average score was 463. The Writing average score was 443.[36] Pennsylvania ranked 40th among state with SAT scores: Verbal - 493, Math - 501, Writing - 479.[37] In the United States 1.65 million students took the exam in 2011. They averaged 497 (out of 800) verbal, 514 math and 489 in writing.[38]
Graduation requirements
The Chichester School Board has determined that a pupil must earn 24 credits to graduate, including: Math 3 credits, English 4 credits, social studies 3 credits, science 3 credits, Arts and Humanities 2 credits Physical Education and Health 2.5 credits and 6.5 electives.[39]
By law, all Pennsylvania secondary school students must complete a project as a part of their eligibility to graduate from high school. The type of project, its rigor and its expectations are set by the individual school district.[40]
By Pennsylvania School Board regulations, for the graduating classes of 2015 and 2016, students must demonstrate successful completion of secondary level course work in Algebra I, Biology, English Composition, and Literature for which the Keystone Exams serve as the final course exams. Students’ Keystone Exam scores shall count for at least one-third of the final course grade.[41][42][43]
Middle school
Chichester Middle School provided grades 5th through 8th to 1001 students, in 2010.[44] In 2011, Chichester Middle School declined to Corrective Action I status due to chronic low student achievement.[45] The school was required under No Child Left Behind to allow students to transfer to a successful school within the district.[46] There is one middle school meaning students have no option to change schools except to go to local charter schools like Chester Community Charter School. In 2010, the school was in Making Progress: in School Improvement II status. The school was required to formulate a school improvement plan which it submitted to the Pennsylvania Department of Education for approval. In 2010 the school's attendance rate was 92%. It increased to 93% in 2011.[47] The school had 81 teachers in 2010 yielding a student–teacher ratio of 12.24:1.[48] The school has a principal, 2 assistant principals and a dean of students.[49]
PSSA Results:
|
8th Grade Reading
|
8th Grade Math:
|
- 8th Grade Science:
- 2011 - 52% on grade level (23% below basic). State – 58.3% of 8th graders were on grade level.
- 2010 - 42% (38% below basic). State – 57%[51]
- 2009 - 44% (31% below basic). State - 55%[52]
- 2008 - 40% (28% below basic). State - 52%[53]
|
7th Grade Reading
|
7th Grade Math:
|
|
6th Grade Reading:
|
6th Grade Math:
|
|
5th Grade Reading:
|
5th Grade Math:
|
Elementary schools
Boothwyn Elementary School is located at 2128 Blueball Avenue Boothwyn, PA 19061. According to the National Center for Education Statistics, in 2010, the school reported an enrollment of 252 pupils in grades kindergarten through 4th, with 96 pupils receiving a federal free or reduced-price lunch due to family poverty. The school employed 21 teachers, yielding a student–teacher ratio of 12:1.[54] According to a report by the Pennsylvania Department of Education, 24 classes are taught by teachers who are rated "Non‐Highly Qualified" under No Child Left Behind.[55] In 2010 and 2011, Boothwyn Elementary School achieved AYP status.[56] In 2011, 84% of the students were reading on grade level in grades 3rd and 4th. In math, 91% of the students in 3rd and 4th grades were on grade level and 62% scored advanced. In 4th grade science, 99% of the pupils were on grade level.[57]
Hilltop Elementary School is located at 401 Cherry Tree Road, Aston. According to the National Center for Education Statistics, in 2010, the school reported an enrollment of 391 pupils in grades kindergarten through 4th, with 118 pupils receiving a federal free or reduced-price lunch due to family poverty. The school employed 28.5 teachers, yielding a student–teacher ratio of 13:1.[58] According to a report by the Pennsylvania Department of Education, 30 classes are taught by teachers who are rated "Non‐Highly Qualified" under No Child Left Behind.[59] In 2010 and 2011, Hilltop Elementary School achieved AYP status.[60] In 2011, only 79% of the students were reading on grade level in grades 3rd and 4th. In math, 87% of the students in 3rd and 4th grades were on grade level and 54% scored advanced. In 4th grade science, 80% of the pupils were on grade level.[61]
Linwood Elementary School is located at 1403 Huddell Avenue, Linwood. According to the National Center for Education Statistics, in 2010, the school reported an enrollment of 300 pupils in grades kindergarten through 4th, with 200 pupils receiving a federal free or reduced-price lunch due to family poverty. Linwood is a Title I school. The school employed 28.5 teachers, yielding a student–teacher ratio of 10.53:1.[62] According to a report by the Pennsylvania Department of Education, 34 classes were taught by teachers who were rated "Non‐Highly Qualified" under No Child Left Behind.[63] In 2010 and 2011, Linwood Elementary School achieved AYP status.[64] In 2011, only 74% of the students were reading on grade level in grades 3rd and 4th. In math, 81% of the students in 3rd and 4th grades were on grade level and 41% scored advanced. In 4th grade science, 71% of the pupils were on grade level.[65]
Marcus Hook Elementary School is located at 8th & Market Streets, Marcus Hook. According to the National Center for Education Statistics, in 2010, the school reported an enrollment of 275 pupils in grades kindergarten through 4th, with 208 pupils receiving a federal free or reduced-price lunch due to family poverty. The school is a Title I school. The school employed 25.50 teachers, yielding a student–teacher ratio of 11:1.[66] According to a report by the Pennsylvania Department of Education, 45 classes were taught by teachers who were rated "Non‐Highly Qualified" under No Child Left Behind.[67] In 2011, Marcus Hook Elementary School achieved AYP status. In 2010 the school was in Warning status due to lagging reading skills.[68] In 2011, only 60% of the students were reading on grade level in grades 3rd and 4th. In math, 73% of the students in 3rd and 4th grades were on grade level and 34% scored advanced. In 4th grade science, just 68% of the pupils were on grade level.[69]
Special education
In December 2010, the district administration reported that 620 pupils or 18.2% of the district's pupils received Special Education services.[70]
In order to comply with state and federal Individuals with Disabilities Education Act rules and regulations, the school district engages in identification procedures to ensure that eligible students receive an appropriate educational program consisting of special education and related services, individualized to meet student needs. At no cost to the parents, these services are provided in compliance with state and federal law; and are reasonably calculated to yield meaningful educational benefit and student progress .[71] To identify students who may be eligible for special education services, various screening activities are conducted on an ongoing basis. These screening activities include: review of group-based data (cumulative records, enrollment records, health records, report cards, ability and achievement test scores); hearing, vision, motor, and speech/language screening; and review by the Special Education administration. When screening results suggest that the student may be eligible, the District seeks parental consent to conduct a multidisciplinary evaluation. Parents who suspect their child is eligible may verbally request a multidisciplinary evaluation from a professional employee of the District or contact the district's Special Education Department.[72][73]
In 2010, the state of Pennsylvania provided $1,026,815,000 for special education services. This funding is in addition to the state's basic education per pupil funding, as well as, all other state and federal funding.[74] The Pennsylvania Special Education funding system assumes that 16% of the district’s students receive special education services. It also assumes that each student’s needs accrue the same level of costs.[75] The state requires each district to have a three-year special education plan to meet the unique needs of its special education students.[76] Overidentification of students in order to increase state funding has been an issue in the Commonwealth. Some districts have more than 20% of its students receiving special education services while others have 10% supported through special education.[77]
Chichester School District received a $2,102,486 supplement for special education services in 2010.[78] For the 2011–12 school year, all Pennsylvania public school districts received the same level of funding for special education that they received in 2010. This level funding is provided regardless of changes in the number of pupils who need special education services and regardless of the level of services the respective students required.[79]
Gifted education
The District Administration reported that 88 or 2.4% of its students were gifted in 2009.[80] By law, the district must provide mentally gifted programs at all grade levels. The referral process for a gifted evaluation can be initiated by teachers or parents by contacting the student’s building principal and requesting an evaluation. All requests must be made in writing. To be eligible for mentally gifted programs in Pennsylvania, a student must have a cognitive ability of at least 130 as measured on a standardized ability test by a certified school psychologist. Other factors that indicate giftedness will also be considered for eligibility.[81][82]
Budget
In 2011, the average teacher salary in Chichester School District has risen to $62,791.32 a year, while the cost of the benefits teachers receive was $16,333.76 per employee, for a total annual average teacher compensation of $79,125.08.[83] According to a study conducted at the American Enterprise Institute, in 2011, public school teachers’ total compensation is roughly 50 percent higher than they would likely receive in the private sector. The study found that the most generous benefits that teachers receive are not accounted for in many studies of compensation, including: pension, retiree health benefits and job security.[84]
In 2010, the district reported employing over 393 teachers and administrators with a salary range of $41,200 to $150,800 for 190 days worked. The average salary was $64,327.[85][86]
In 2007, the district employed 243 teachers. The average teacher salary in the district was $56,642 for 190 days worked.[87] As of 2007, Pennsylvania ranked in the top 10 states in average teacher salaries. When adjusted for cost of living Pennsylvania ranked fourth in the nation for teacher compensation.[88] Teachers are required to work 7 hours 30 minutes per school day with a paid, duty-free 45-minute lunch break. Additionally, the teachers receive a defined benefit pension, health insurance (teacher pays 11% of cost), dental insurance, $50,000 in life insurance, professional development reimbursement, 2 paid personal days, 10 paid sick days (which accumulate), 3 days bereavement leave and other benefits. Teachers who assist in the District New Teacher Induction Plan receive an extra $1,500. When a teacher retires, the district pays for health insurance for five years, and a maximum $25,000 retirement bonus. The union's President may take 3 instructional periods per week to conduct union business.[89]
CHichester School District administrative costs per pupil in 2008 was $702.51 per pupil. The lowest administrative cost per pupil in Pennsylvania was $398 per pupil.[90] The Pennsylvania School Boards Association keeps statistics on salaries of public school district employees in Pennsylvania. According to the association's report, the average salary for a superintendent, for the 2007–08 school year, was $122,165. Superintendents and administrators receive a benefit package commensurate with that offered to the district's teachers' union.[91]
Reserves In 2008, the district reported $1,039,420 in an unreserved-designated fund balance. The unreserved-undesignated fund balance was reported as $4,905,842.[92] In 2009–10 the unreserved designated fund balance was $1,448,711.00 and the undesignated unreserved fund had $4,565,000.00. PA school district reserve funds are divided into two categories – designated and undesignated. The undesignated funds are not committed to any planned project. Designated funds and any other funds, such as capital reserves, are allocated to specific projects. School districts are required by state law to keep 5 percent of their annual spending in the undesignated reserve funds to preserve bond ratings. According to the Pennsylvania Department of Education, from 2003 to 2010, as a whole, Pennsylvania school districts amassed nearly $3 billion in reserved funds.[93]
In 2008 the district administration reported that per pupil spending was $16,261 which ranked 37th among Pennsylvania's 501 school districts. In 2010 the per pupil spending had increased to $17,624.45.[94]
In December 2010, the Pennsylvania Auditor General conducted a performance audit of the district. Serious findings regarding school bus drivers lacking proper documentation were reported to the school board and administration.[95]
The district is funded by a combination of: a local earned income tax, a property tax, a real estate transfer tax 0.5%, coupled with substantial funding from the Commonwealth of Pennsylvania and the federal government. In the Commonwealth of Pennsylvania, pension income and Social Security income are exempted from state personal income tax and local earned income tax, regardless of personal wealth.[96]
State basic education funding
In 2011–12, Chichester School District received a $9,586,369 allocation of state Basic Education Funding.[97][98] Additionally, the School District received $216,303 in Accountability Block Grant funding. The enacted Pennsylvania state Education budget includes $5,354,629,000 for the 2011–2012 Basic Education Funding appropriation. This amount is a $233,290,000 increase (4.6%) over the enacted State appropriation for 2010–2011.[99] The highest increase in state basic education funding was awarded to Duquesne City School District, which got a 49% increase in state funding for 2011–12.[100] In 2010, the district reported that 1,573 students received free or reduced-price lunches, due to the family meeting the federal poverty level.[101]
For the 2010–11 budget year, Chichester School District received a 2% increase in BEF for $10,155,073. The highest increase in Delaware County was given to the School District a 10.34% increase in Basic Education Funding. One hundred fifty Pennsylvania school districts received the base 2% increase. Statewide the highest increase in 2010–11 went to Kennett Consolidated School District in Chester County which received a 23.65% increase in state funding.[102]
In the 2009–2010 budget year, the Commonwealth of Pennsylvania provided a 5.93% increase in Basic Education Funding for a total of $10,154,786. Among the districts in Delaware County, the highest increase went to Upper Darby School District which got an 11.61%. The state Basic Education Funding to the district in 2008–09 was $4,787,151.79. Ninety school districts received the base 2% increase. Muhlenberg School District in Berks County received a 22.31% increase in state basic education funding in 2009.[103] The amount of increase each school district receives was set by Governor Rendell and the Secretary of Education as a part of the state budget proposal given each February and the budget negotiations.[104]
According to the Pennsylvania Department of Education, 1,363 district students received free or reduced-price lunches due to low family income in the 2007–2008 school year.[105]
Accountability Block Grants
Beginning in 2004–2005, the state launched the Accountability Block Grant school funding. This program has provided $1.5 billion to Pennsylvania’s school districts. The Accountability Block Grant program requires that its taxpayer dollars are focused on specific interventions that are most likely to increase student academic achievement. These interventions include: teacher training, all-day kindergarten, lower class size K-3rd grade, literacy and math coaching programs that provide teachers with individualized job-embedded professional development to improve their instruction, before or after school tutoring assistance to struggling students. For 2010–11, the district applied for and received $587,101 in addition to all other state and federal funding. The district used the funding to provide full-day kindergarten and to hire teachers as Literacy and math coaches to help teachers improve classroom instruction.[106][107]
Classrooms for the Future grant
The Classroom for the Future state program provided districts with hundreds of thousands of extra state funding to buy laptop computers for each core curriculum high school class (English, Science, History, Math) and paid for teacher training to optimize the computers use. The program was funded from 2006 to 2009. The School District received $12,603 and $403,479 in 2006–07, In 2007–08 the district received $66,091 for a total funding of $482,173. The district received $136,749 in 2008–09.[108] In Delaware County the highest award (1,508,520) was given to Upper Darby School District. The highest funding statewide was awarded to Philadelphia City School District in Philadelphia County - $9,409,073. In 2010, Classrooms for the Future funding was curtailed statewide due to a massive state financial crisis.
Education Assistance grant
The state's EAP funding provides for the continuing support of tutoring services and other programs to address the academic needs of eligible students. Funds are available to eligible school districts and full-time career and technology centers (CTC) in which one or more schools have failed to meet at least one academic performance target, as provided for in Section 1512-C of the Pennsylvania Public School Code. In 2010–11, Chichester School District received $99,302.[109]
School Improvement Grant
In the summer of 2011, the district administration did not apply for School Improvement Grant funding, from the federal government (over $9.9 million available). The high school was eligible for funding due to chronic low achievement. The grant stipulates the funds be used for improving student achievement using one of four federally dictated strategies. The strategies are: transformation, turnaround, restart with new faculty and administration or closure of failing schools.[110] The Pennsylvania Education Secretary awarded $66 million to reform Pennsylvania's lowest-achieving schools in August 2011. The funding is for three years.[111]
For the 2010–11 school year, Chichester School District administration applied for a School Improvement Grant. It was eligible for funding due to the chronic, low achievement at the middle school. The district received $80,676.[112]
In 2010, Pennsylvania received $141 million from the US Department of Education, to turn around its worst-performing schools. The funds were disbursed via a competitive grant program.[113] The Pennsylvania Department of Education has identified 200 Pennsylvania schools as "persistently lowest-achieving," making them eligible for this special funding.[114] Pennsylvania required low performing schools to apply or provide documentation about why they had not applied. The funds must be used, by the district, to turn around schools in one of four ways: school closure, restart - close the school and reopen it as a charter school. The other two options involve firing the principal. One would require at least half the faculty in a chronically poor performing school be dismissed. The second involves intensive teacher training coupled with strong curriculum revision or a longer school day.[115]
Literacy grant
Chichester School District was awarded a $1 million competitive literacy grant. It is to be used to improve reading skills birth through 12th grade. The district was required to develop a lengthy literacy plan, which included outreach into the community. The funds come from a Striving Readers Comprehensive Literacy grant, also referred to as the Keystones to Opportunity grant It is a five-year, competitive federal grant program designed to assist local education agencies in developing and implementing local comprehensive literacy plans. Of the 329 pre-applications by school districts reviewed by the Pennsylvania Department of Education, Chichester School District was one of only 148 entities that were invited to submit a full application. In Delaware County 2 school districts and Chester Community Charter School were each awarded funding for one year.[116] The funds must be used for teacher training, student screening and assessment, targeted interventions for students reading below grade level and research-based methods of improving classroom instruction and practice. Districts must hire literacy coaches. The coaches work with classroom teachers to enhance their literacy teaching skills. Pennsylvania was among six other states, out of the 35 that applied, to be awarded funding. Pennsylvania received $38 million through the federal program. The Department of Education reserved 5% of the grant for administration costs at the state level.
Federal Stimulus grant
The district received an extra $3,502,024 in ARRA - Federal Stimulus money to be used in specific programs like special education and meeting the academic needs of low-income students.[117] The funding was limited to the 2009–10 and 2010–2011 school years.[118] Due to the temporary nature of the funding, schools were repeatedly warned by the legislators, Pennsylvania School Board Association, the Pennsylvania Association of School Business Officials, the PA Department of Education and the US DOE to use the funds for one-time expenditures like acquiring equipment, making vital building repairs or purchasing books and software.
Race to the Top grant
Chichester School District officials applied for the federal Race to the Top grant which would have provided well over one million dollars in additional federal funding to improve student academic achievement.[119] Participation required the administration, the school board and the local teachers' union to sign an agreement to prioritize improving student academic success. In Pennsylvania, 120 public school districts and 56 charter schools agreed to participate.[120] Pennsylvania was not approved for the grant. The failure of districts to agree to participate was cited as one reason that Pennsylvania was not approved.[121][122][123]
Common Cents state initiative
The School Board elected to not participate in the Pennsylvania Department of Education Common Cents program. The program called for the state to audit the district, at no cost to local taxpayers, to identify ways the district could save tax dollars.[124] After the review of the information, the district was not required to implement the recommended cost savings changes.
Real estate taxes
Property tax rates in 2012–13 were set by the Chichester School Board at 38.3 mills. A mill is $1 of tax for every $1,000 of a property's assessed value. Irregular property reassessments have become a serious issue in the commonwealth as it creates a significant disparity in taxation within a community and across a region.[125] Property taxes, in the Commonwealth of Pennsylvania, apply only to real estate - land and buildings. The property tax is not levied on cars, business inventory, or other personal property. Certain types of property are exempt from property taxes, including: places of worship, places of burial, private social clubs, charitable and educational institutions and government property. Additionally, service related, disabled US military veterans may seek an exemption from paying property taxes. Pennsylvania school district revenues are dominated by two main sources: 1) Property tax collections, which account for the vast majority (between 75-85%) of local revenues; and 2) Act 511 tax collections, which are around 15% of revenues for school districts.[126] The school district includes municipalities in two counties, each of which has different rates of property tax assessment, necessitating a state board equalization of the tax rates between the counties.[127]
- 2011–12 - 37.7350 mills [128]
- 2010–11 - 36.2819 mills[129]
- 2009–10 - 34.6017 mills.[130]
- 2008–09 - 33.2950 mills.[131]
- 2007–08 - 31.4700 mills.[132]
Act 1 Adjusted Index
The Act 1 of 2006 Index regulates the rates at which each school district can raise property taxes in Pennsylvania. Districts are not allowed to raise taxes above that index unless they allow voters to vote by referendum, or they seek an exception from the state Department of Education. The base index for the 2011–2012 school year is 1.4 percent, but the Act 1 Index can be adjusted higher, depending on a number of factors, such as property values and the personal income of district residents. Act 1 included 10 exceptions, including: increasing pension costs, increases in special education costs, a catastrophe like a fire or flood, increase in health insurance costs for contracts in effect in 2006 or dwindling tax bases. The base index is the average of the percentage increase in the statewide average weekly wage, as determined by the PA Department of Labor and Industry, for the preceding calendar year and the percentage increase in the Employment Cost Index for Elementary and Secondary Schools, as determined by the Bureau of Labor Statistics in the U.S. Department of Labor, for the previous 12-month period ending June 30. For a school district with a market value/personal income aid ratio (MV/PI AR) greater than 0.4000, its index equals the base index multiplied by the sum of .75 and its MV/PI AR for the current year.[133] In June 2011, the Pennsylvania General Assembly eliminated six of the ten the exceptions to the Act 1 Index.[134] The following exceptions were maintained: 1) costs to pay interest and principal on indebtedness incurred prior to September 4, 2004 for Act 72 schools and prior to June 27, 2006 for non-Act 72 schools; 2) costs to pay interest and principal on electoral debt; 3) costs incurred in providing special education programs and services (beyond what is already paid by the State); and 4) costs due to increases of more than the Index in the school’s share of payments to PSERS (PA school employees pension fund) taking into account the state mandated PSERS contribution rate.[135][136]
The School District Adjusted Index for the Chichester School District 2006–2007 through 2011–2012.[137]
- 2006–07 - 5.2%, Base 3.9%
- 2007–08 - 4.6%, Base 3.4%
- 2008–09 - 5.8%, Base 4.4%
- 2009–10 - 5.4%, Base 4.1%
- 2010–11 - 3.8%, Base 2.9%
- 2011–12 - 1.8%, Base 1.4%
- 2012–13 - 2.2%, Base 1.7%[138]
For the 2012–13 budget year, Chichester School Board apply for an exceptions to exceed the Act 1 Index due to teacher pension costs. For 2012–2013, 274 school districts adopted a resolution certifying that tax rates would not be increased above their index; 223 school districts adopted a preliminary budget leaving open the option of exceeded the Index limit. For the exception for pension costs, 194 school districts received approval to exceed the Index. For special education costs, 129 districts received approval to exceed the tax limit. For the exception for pension costs, 194 school districts received approval to exceed the Index. For special education costs, 129 districts received approval to exceed the tax limit.[139]
For the 2011–12 school year, the Chichester School Board applied for two exceptions to exceed the Act 1 Index: special education and teacher pension. Each year, the School Board has the option of adopting either 1) a resolution in January certifying they will not increase taxes above their index or 2) a preliminary budget in February. A school district adopting the resolution may not apply for referendum exceptions or ask voters for a tax increase above the inflation index. A specific timeline for these decisions is published annually, by the Pennsylvania Department of Education.[140]
According to a state report, for the 2011–2012 school year budgets, 247 school districts adopted a resolution certifying that tax rates would not be increased above their index; 250 school districts adopted a preliminary budget. Of the 250 school districts that adopted a preliminary budget, 231 adopted real estate tax rates that exceeded their index. Tax rate increases in the other 19 school districts that adopted a preliminary budget did not exceed the school district’s index. Of the districts who sought exceptions: 221 used the pension costs exemption and 171 sought a Special Education costs exemption. Only 1 school district sought an exemption for Nonacademic School Construction Project, while 1 sought an exception for Electoral debt for school construction.[141]
Chichester School Board applied for one exception to exceed the Act 1 index for the budget in 2010–2011.[142] For 2009–10 school budget, the Chichester School Board did not apply for exceptions to exceed the Index.[143] In the Spring of 2010, 135 Pennsylvania school boards asked to exceed their adjusted index. Approval was granted to 133 of them and 128 sought an exception for pension costs increases.[144]
Property tax relief
In 2010, the Homestead/Farmstead Property Tax Relief from gambling for the Chichester School District was $322 per approved permanent primary residence. In the district, 5,578 property owners applied for the tax relief.[145] The relief was subtracted from the total annual school property tax bill. Property owners apply for the relief through the county Treasurer's office. Farmers can qualify for a farmstead exemption on building used for agricultural purposes. The farm must be at least 10 contiguous acres (40,000 m2) and must be the primary residence of the owner. Farmers can qualify for both the homestead exemption and the farmstead exemption. In Delaware County, 66.22% of eligible property owners applied for property tax relief in 2009.[146] In Delaware County, the highest amount of tax relief in 2010, went to property owners in Chester Upland School District. They received highest property tax relief in Pennsylvania receiving $632 per approved homestead.[147] This was the third year they were the top recipient.
Additionally, the Pennsylvania Property Tax/Rent Rebate program is provided for low income Pennsylvanians aged 65 and older; widows and widowers aged 50 and older; and people with disabilities age 18 and older. The income limit is $35,000 for homeowners. The maximum rebate for both homeowners and renters is $650. Applicants can exclude one-half (1/2) of their Social Security income, consequently, individual with income much more than $35,000 may still qualify for a rebate. Individuals must apply annually for the rebate. This can be taken in addition to Homestead/Farmstead Property Tax Relief.[148]
Property taxes in Pennsylvania are relatively high on a national scale. According to the Tax Foundation, Pennsylvania ranked 11th in the U.S. in 2008 in terms of property taxes paid as a percentage of home value (1.34%) and 12th in the country in terms of property taxes as a percentage of income (3.55%).[149]
Extracurriculars
The district offers an extensive variety of clubs, activities and sports to students in both the middle school and high school. Eligibility for participation is determined by school board policy.[150]
By Pennsylvania law, all K-12 students in the district, including those who attend a private nonpublic school, cyber charter school, charter school and those homeschooled, are eligible to participate in the extracurricular programs, including all athletics. They must meet the same eligibility rules as the students enrolled in the district's schools.[151]
Private schools
- Holy Family Catholic School (private) located in Aston, PA
References
- ↑ Pennsylvania Department of Education, Enrollment and Projections by LEA, July 2010
- ↑ DiSerafino, Toni., Chichester School District facing 1.5 percent tax hike, Delaware County Times, May 29, 2012
- ↑ Pennsylvania Department of Education, Pennsylvania Public School District Tuition Rates, May 2012
- ↑ US Census Bureau, American Fact Finder, 2009
- ↑ US Census Bureau, (2010). "American Fact Finder, State and County quick facts".
- ↑ US Census Bureau (September 2011). "Income, Poverty, and Health Insurance Coverage in the United States: 2010" (PDF).
- ↑ Pennsylvania Public School Code Governance 2010
- ↑ The Commonwealth Foundation for Public Policy Alternatives. "The Pennsylvania Project". Retrieved May 20, 2010.
- ↑ "Statewide Honor Roll Rankings 2012". Pittsburgh Business Times. April 5, 2012. Archived from the original on 2012-10-23.
- ↑ Pittsburgh Business Times, Statewide School Academics Ranking - Delaware County Public School Districts, April 6, 2012
- ↑ Pittsburgh Business Times. (April 4, 2011). "Statewide Honor Roll Rankings information 2011,". Archived from the original on 2012-01-19.
- ↑ Pittsburgh Business Times. (April 30, 2010). "Statewide Honor Roll Rankings 2010,".
- ↑ "Three of top school districts in state hail from Allegheny County". Pittsburgh Business Times. May 23, 2007. Archived from the original on 2011-07-18.
- ↑ "Overachiever statewide ranking". Pittsburgh Business Times. May 6, 2010.
- ↑ Morning Call, 2009 PSSA RESULTS School District, 2009
- ↑ Pennsylvania Department of Education (September 29, 2011). "Chichester School District AYP Data Table".
- ↑ Pennsylvania Department of Education (March 15, 2011). "New 4-year Cohort Graduation Rate Calculation Now Being Implemented".
- ↑ Pennsylvania Department of Education, Chichester School District Academic Achievement Report Card Data table, 2010
- ↑ The Times-Tribune (June 27, 2010). "PA School District Statistical Snapshot Database 2008–09".
- ↑ The Times-Tribune (June 25, 2009). "Delaware County School Districts Graduation Rates 2008".
- ↑ Pennsylvania Partnerships for Children (2008). "High School Graduation rate 2007" (PDF).
- ↑ National Center for Education Statistics, Common Care Data - Chichester High School, 2010
- ↑ Pennsylvania Department of Education, Professional Qualifications of Teachers Chichester High School, September 29, 2011
- ↑ Pennsylvania Department of Education (September 29, 2011). "CHICHESTER Senior High School - School AYP Overview".
- ↑ National Center for Education Statistics (2010). "CCD Public school data 2009–2010 school year Chichester Senior High School".
- ↑ Pennsylvania Department of Education (September 29, 2011). "2010-2011 PSSA and AYP Results".
- ↑ Pennsylvania Department of Education (2010). "2009-2010 PSSA and AYP Results".
- ↑ The Times-Tribune. (September 2009). "Grading Our Schools database, 2009 PSSA results,".
- ↑ Pennsylvania Department of Education (August 2008). "2007-2008 PSSA and AYP Results".
- ↑ Pennsylvania Department of Education (2007). "PSSA Math and Reading results".
- ↑ Pennsylvania Department of Education (September 29, 2011). "CHICHESTER Senior High School Academic Achievement Report Card 2011" (PDF).
- ↑ Pennsylvania Department of Education (September 29, 2011). "2010-2011 PSSA results in Science".
- ↑ The Times-Tribune. (2009). "Grading Our Schools database, 2009 Science PSSA results,".
- ↑ Pennsylvania Department of Education (January 20, 2009). "Pennsylvania College Remediation Report,". Archived from the original on 2012-05-03.
- ↑ National Center for Education Statistics, IPEDS Integrated Postsecondary Education Data System, 2008
- ↑ Pennsylvania Department of Education (2011). "Public School SAT Scores 2011". Archived from the original on 2011-10-15.
- ↑ College Board (September 2011). "SAT Scores State By State - Pennsylvania". Archived from the original on 2011-10-08.
- ↑ "While U.S. SAT scores dip across the board, N.J. test-takers hold steady". NJ.com. September 2011.
- ↑ Chichester School District Administration (2011). "Ninth Grade Orientation Packet Graduation Requirements" (PDF).
- ↑ Pennsylvania State Board of Education. "Pennsylvania Code §4.24 (a) High school graduation requirements".
- ↑ Pennsylvania Department of Education (2010). "Keystone Exam Overview" (PDF).
- ↑ Pennsylvania Department of Education (September 2011). "Pennsylvania Keystone Exams Overview". Archived from the original on 2012-03-17.
- ↑ Pennsylvania State Board of Education (2010). "Rules and Regulation Title 22 PA School Code CH. 4".
- ↑ NCES, Chichester Middle School Report, 2010
- ↑ Pennsylvania Department of Education (September 29, 2011). "Chichester Middle School School AYP Overview".
- ↑ Chichester School District Administration Paula A. Husar (2011). "PSSA AYP Parent Notification Letter and Data Table" (PDF).
- ↑ Pennsylvania Department of Education (September 29, 2011). "Chichester Middle School School AYP DataTable".
- ↑ National Center of Education Statistics (2010). "CCD Public school data 2009–2010 school year Chichester Middle School Report".
- ↑ Chichester Middle School Administration (2011). "Principals Messages".
- ↑ Pennsylvania Department of Education (September 29, 2011). "Chichester Middle School School Academic Achievement Report Card 2011" (PDF).
- ↑ Pennsylvania Department of Education Report (August 2010). "Science PSSA 2010 by Schools".
- ↑ Pennsylvania Department of Education Report (August 2009). "Science PSSA 2009 by Schools".
- ↑ Pennsylvania Department of Education Report (August 15, 2008). "Science PSSA 2008 by Schools".
- ↑ National Center for Education Statistics, Common Care Data – Boothwyn Elementary School, 2010
- ↑ Pennsylvania Department of Education, Professional Qualifications of Teachers Boothwyn Elementary School, September 29, 2011
- ↑ Pennsylvania Department of Education, Boothwyn Elementary School AYP Overview, September 29, 2011
- ↑ Pennsylvania Department of Education (September 29, 2011). "Boothwyn Elementary School Report Card 2011" (PDF).
- ↑ National Center for Education Statistics, Common Care Data – Hilltop Elementary School, 2010
- ↑ Pennsylvania Department of Education, Professional Qualifications of Teachers Hilltop Elementary School, September 29, 2011
- ↑ Pennsylvania Department of Education, Hilltop Elementary School AYP Overview, September 29, 2011
- ↑ Pennsylvania Department of Education (September 29, 2011). "Hilltop Elementary School Report Card 2011" (PDF).
- ↑ National Center for Education Statistics, Common Care Data – Linwood Elementary School, 2010
- ↑ Pennsylvania Department of Education, Professional Qualifications of Teachers Linwood Elementary School, September 29, 2011
- ↑ Pennsylvania Department of Education, Linwood Elementary School AYP Overview, September 29, 2011
- ↑ Pennsylvania Department of Education (September 29, 2011). "Linwood Elementary School Report Card 2011" (PDF).
- ↑ National Center for Education Statistics, Common Care Data – Marcus Hook Elementary School, 2010
- ↑ Pennsylvania Department of Education, Professional Qualifications of Teachers Marcus Hook Elementary School, September 29, 2011
- ↑ Pennsylvania Department of Education, Marcus Hook Elementary School AYP Overview 2010 and 2011, September 29, 2011
- ↑ Pennsylvania Department of Education (September 29, 2011). "Marcus Hook Elementary School Report Card 2011" (PDF).
- ↑ Pennsylvania Bureau of Special Education Services (2009–2010). "Area School District Special Education Data Report LEA Performance on State Performance Plan (SPP) Targets". Archived from the original on 2011-08-24.
- ↑ Pennsylvania Bureau of Special Education (2008). "Pennsylvania Parent Guide to Special Education Services".
- ↑ Pennsylvania Department of Education - Chichester School District Administration (January 6, 2011). "Child Find Notice".
- ↑ Pennsylvania Department of Education, Bureau of Special Education (September 2005). "Gaskin Settlement Agreement Overview Facts Sheet" (PDF). Archived from the original (PDF) on 2007-10-20.
- ↑ Pennsylvania Department of Education. "Pennsylvania Special Education Funding".
- ↑ Senator Patrick Browne (November 1, 2011). "Senate Education Committee Holds Hearing on Special Education Funding & Accountability". Archived from the original on 2012-07-23.
- ↑ Pennsylvania Department of Education Amy Morton, Executive Deputy Secretary (November 11, 2011). "Public Hearing: Special Education Funding & Accountability Testimony". Archived from the original on 2012-04-22.
- ↑ Baruch Kintisch Education Law Center (November 11, 2011). "Public Hearing: Special Education Funding & Accountability Testimony" (PDF). Archived from the original (PDF) on 2012-04-22.
- ↑ Pennsylvania Department of Education (July 2010). "Special Education Funding from Pennsylvania State_2010-2011".
- ↑ Pennsylvania Department of Education (2011). "Special Education Funding 2011–2012 Fiscal Year".
- ↑ Pennsylvania Department of Education (Revised December 1, 2009 Child Count (Collected July 2010)). "Gifted Students as Percentage of Total Enrollment by School District/Charter School" (PDF). Archived from the original (PDF) on 2016-03-04. Check date values in:
|date=(help) - ↑ Pennsylvania Department of Education and Pennsylvania School Board. "CHAPTER 16. Special Education For Gifted Students". Retrieved February 4, 2011.
- ↑ Pennsylvania Department of Education (March 26, 2010). "Special Education for Gifted Students Notice of Parental rights" (PDF).
- ↑ Pennsylvania Department of Education (2012). "Investing in Pennsylvania Students".
- ↑ American Enterprise Institute, (2011). "Assessing the Compensation of Public School Teachers". Archived from the original on 2013-01-03.
- ↑ Asbury Park Press (2010). "PA. Public School Salaries".
- ↑ Openpagov.org (2009). "Chichester Payroll Report". Archived from the original on 2010-11-19.
- ↑ Fenton, Jacob, (March 2009). "Average classroom teacher salary in Delaware County, 2006–07.". The Morning Call.
- ↑ PA Delaware County Times, Teachers need to know enough is enough, April 20, 2010.
- ↑ Chichester School Board (February 4, 2012). "Chichester School District Teacher Union Employment Contract September 1, 2007 – August 31, 2012". Archived from the original on 2010-11-19.
- ↑ Fenton, Jacob. (February 2009). "Pennsylvania School District Data: Will School Consolidation Save Money?". The Morning Call.
- ↑ Pennsylvania School Board Association (October 2009). "Public School Salaries 11th Annual". Archived from the original on 2008-10-05.
- ↑ Pennsylvania Department of Education (2009). "Fund Balances by Local Education Agency 1997 to 2008".
- ↑ Jan Murphy (September 22, 2010). "Pennsylvania's public schools boost reserves". Archived from the original on 2010-09-23.
- ↑ Pennsylvania Department of Education (2010). "2009-10 Selected Data - 2009–10 Total Expenditures per ADM".
- ↑ Pennsylvania Auditor General (December 2010). "Chichester School District Delaware County, Pennsylvania Performance Audit Report".
- ↑ Pennsylvania Department of Revenue (April 2010). "Personal Income Taxation Guidelines".
- ↑ PA Senate Appropriations Committee (June 28, 2011). "School District 2011–12 Funding Report".
- ↑ Pennsylvania Department of Education (July 2011). "Basic Education Funding".
- ↑ Pennsylvania Department of Education (June 30, 2011). "Basic Education Funding".
- ↑ Pennsylvania Department of Education (June 30, 2011). "Basic Education Funding 2011–2012 Fiscal Year".
- ↑ Pennsylvania Department of Education, District Allocations Report 2009, 2009–10
- ↑ Pennsylvania House Appropriations Committee Education Budget information (June 30, 2010). "PA Basic Education Funding-Printout2 2010–2011" (PDF). Pittsburgh Post-Gazette.
- ↑ Pennsylvania Department of Education (October 2009). "Funding Allocations by district".
- ↑ Pennsylvania Office of Budget (February 2009). "Governor's Budget Proposal 2009 Pennsylvania Department of Education Budget Proposal 2009,".
- ↑ Pennsylvania Department of Education, Funding Report by LEA, 2009
- ↑ Pennsylvania Department of Education (2010). "Accountability Block Grant report Grantee list 2010".
- ↑ Pennsylvania Department of Education (2008). "Accountability Block Grant Mid Year report".
- ↑ Pennsylvania Auditor General (December 22, 2008). "Classrooms for the Future grants audit" (PDF).
- ↑ Pennsylvania Department of Education (2010). "Educational Assistance Program Funding 2010–2011 Fiscal Year".
- ↑ Pennsylvania Department of Education (2011). "Pennsylvania School Improvement Planning".
- ↑ Pennsylvania Department of Education (August 23, 2011). "Education Secretary Announces $66 Million Awarded to Reform Pennsylvania Lowest-Achieving Schools".
- ↑ Pennsylvania Department of Education (2010). "School Improvement grants 2010". Archived from the original on 2011-07-17.
- ↑ Pennsylvania Department of Education. "School Improvement information".
- ↑ Pennsylvania Department of Education. "Pennsylvania School Improvement Grant Components_Stat_Requirements".
- ↑ Pennsylvania Department of Education (June 9, 2010). "Pennsylvania School Improvement Grant Components_Stat_Requirements" (PDF).
- ↑ Pennsylvania Department of Education (May 23, 2012). "Pennsylvania Awards $36.1 Million to Strengthen Literacy Programs".
- ↑ Commonwealth of Pennsylvania (2009). "Delaware County ARRA FUNDING Report".
- ↑ "School stimulus money". Pittsburgh Post-Gazette'. March 12, 2009.
- ↑ Pennsylvania Department of Education (December 9, 2009). "RTTT_Webinar_for_districts_December_2009.pdf".
- ↑ Governor's Press Office release (January 20, 2010). "Pennsylvania's 'Race to the Top' Fueled by Effective Reforms, Strong Local Support,".
- ↑ Race to the Top Fund, U.S. Department of Education, March 29, 2010.
- ↑ Gerald Zahorchak (December 2008). "Pennsylvania Race to the Top Letter to Superintendents" (PDF).
- ↑ Pennsylvania Department of Education (January 2009). "Pennsylvania Race to the Top -School Districts Title I Allocations 2009–10".
- ↑ Pennsylvania Department of Education (2007). "Common Cents program - Making Every Dollar Count".
- ↑ Pennsylvania Department of Education (2011). "Real Estate Tax Rates by School District 2011–12 Real Estate Mills".
- ↑ Pennsylvania Department of Education (2004). "Act 511 Tax Report".
- ↑ State Tax Equalization Board (2011). "State Tax Equalization Board About US". Archived from the original on 2012-11-14.
- ↑ Pennsylvania Department of Education (2011). "Real Estate Tax Millage by School District,".
- ↑ Pennsylvania Department of Education (2010). "Real Estate Tax Millage by School District,".
- ↑ Pennsylvania Department of Education (2010). "Financial Elements Reports".
- ↑ Pennsylvania Department of Education (2009). "Financial Elements Reports 2008–09 Real Estate Mills".
- ↑ Pennsylvania Department of Education (2008). "Real Estate Tax Millage by School District,".
- ↑ Pennsylvania Department of Education (2010). "2010-11 Act 1 of 2006 Referendum Exception Guidelines".
- ↑ Kaitlynn Riely (August 4, 2011). "Law could restrict school construction projects". Pittsburgh Post-Gazette.
- ↑ Pennsylvania General Assembly (June 2011). "SB330 of 2011".
- ↑ Eric Boehm (July 1, 2011). "Property tax reform final piece of state budget". PA Independent.
- ↑ Pennsylvania Department of Education (May 4, 2010). "Special Session Act 1 of 2006 School District Adjusted Index for 2006–2007 through 2010–2011".
- ↑ Pennsylvania Department of Education (May 2011). "2012-2013 School District Adjusted Index Listing".
- ↑ Pennsylvania Department of Education, Report on Referendum Exceptions For School Year 2012–2013, March 30, 2012
- ↑ Pennsylvania Department of Education (2011). "Special Session Act 1 of 2006 the Taxpayer Relief Act information".
- ↑ Pennsylvania Department of Education (April 2011). "Report on Exceptions".
- ↑ Pennsylvania Department of Education (May 2010). "Report on Referendum Exceptions for 2010–2011".
- ↑ Pennsylvania Department of Education (May 2009). "Report on Referendum Exceptions for 2009–2010".
- ↑ Scarcella, Frank; Pursell, Tricia, (May 25, 2010). "Local school tax assessments exceed state averages". The Daily Item.
- ↑ Pennsylvania Department of Education (May 1, 2010). "SSAct1_Property Tax Relief Per HomeStead 2010".
- ↑ Pennsylvania Auditor General Office, (February 23, 2010). "Special Report Pennsylvania Property Tax Relief,".
- ↑ Tax Relief per Homestead 2009, Pennsylvania Department of Education Report May 1, 2010
- ↑ Commonwealth of Pennsylvania Department of Education. "Property Tax/Rent Rebate Program".
- ↑ Tax Foundation (September 22, 2009). "New Census Data on Property Taxes on Homeowners". Archived from the original on 2011-09-06.
- ↑ Chichester Administration (2011). "Athletics".
- ↑ Pennsylvania Office of the Governor Press Release, (November 10, 2005). "Home-Schooled, Charter School Children Can Participate in School District Extracurricular Activities".
Delaware County, Pennsylvania schools | |||||||||||||||||||||||||||||||||||||||||||||||||||||||||||||||||
|---|---|---|---|---|---|---|---|---|---|---|---|---|---|---|---|---|---|---|---|---|---|---|---|---|---|---|---|---|---|---|---|---|---|---|---|---|---|---|---|---|---|---|---|---|---|---|---|---|---|---|---|---|---|---|---|---|---|---|---|---|---|---|---|---|---|
| |||||||||||||||||||||||||||||||||||||||||||||||||||||||||||||||||
| |||||||||||||||||||||||||||||||||||||||||||||||||||||||||||||||||