Hereford and South Herefordshire (UK Parliament constituency)
| Hereford and South Herefordshire | |
|---|---|
|
County constituency for the House of Commons | |
|
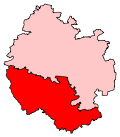
Boundary of Hereford and South Herefordshire in Herefordshire for the 2010 general election. | |
|
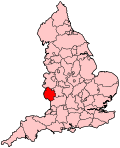
Location of Herefordshire within England. | |
| County | Herefordshire |
| Electorate | 71,352 (December 2010)[1] |
| Current constituency | |
| Created | 2010 |
| Member of parliament | Jesse Norman (Conservative) |
| Number of members | One |
| Created from | Hereford, Leominster |
| Overlaps | |
| European Parliament constituency | West Midlands |
Hereford and South Herefordshire /ˈhɛrᵻfəd ənd saʊθ hɛrᵻfədʃɪər/ is a constituency[n 1] of the House of Commons of the UK Parliament. It comprises the city of Hereford and most of south Herefordshire and is currently represented by Jesse Norman in the Conservative Party.[n 2]
Boundaries
Following a review of parliamentary representation in Herefordshire by the Boundary Commission for England, which took effect at the 2010 general election, the county was allocated two seats. The Hereford and South Herefordshire constituency largely replaced the former Hereford seat, with the remainder of the county covered by the North Herefordshire seat. As well as the city of Hereford, the seat contains the settlements of Golden Valley, Pontrilas and Ross-on-Wye.
The constituency is formed from the following electoral wards:[2]
- Aylestone, Belmont, Central, Golden Valley North, Golden Valley South, Hollington, Kerne Bridge, Llangarron, Penyard, Pontrilas, Ross-on-Wye East, Ross-on-Wye West, St Martins and Hinton, St Nicholas, Stoney Street, Three Elms, Tupsley and Valletts.
Members of Parliament
| Election | Member[3] | Party | |
|---|---|---|---|
| 2010 | constituency replaced Hereford | ||
| 2010 | Jesse Norman | Conservative | |
Elections
Elections in the 2010s
| Party | Candidate | Votes | % | ± | |
|---|---|---|---|---|---|
| Conservative | Jesse Norman | 24,844 | 52.6 | +6.3 | |
| UKIP | Nigel Ely[5] | 7,954 | 16.8 | +13.4 | |
| Labour | Anna Coda | 6,042 | 12.8 | +5.5 | |
| Liberal Democrat | Lucy Hurds[6] | 5,002 | 10.6 | -30.5 | |
| Green | Diana Toynbee [7] | 3,415 | 7.2 | +7.2 | |
| Majority | 16,890 | 35.7 | +30.6 | ||
| Turnout | 47,257 | 66.8 | -0.9 | ||
| Conservative hold | Swing | ||||
| Party | Candidate | Votes | % | ± | |
|---|---|---|---|---|---|
| Conservative | Jesse Norman | 22,366 | 46.2 | +5.2 | |
| Liberal Democrat | Sarah Carr | 19,885 | 41.1 | -2.3 | |
| Labour | Philippa Roberts | 3,506 | 7.2 | -3.0 | |
| UKIP | Valentine Smith | 1,638 | 3.4 | +1.2 | |
| BNP | John Oliver | 986 | 2.0 | +2.0 | |
| Majority | 2,481 | 5.1 | |||
| Turnout | 48,381 | 67.7 | +1.6 | ||
| Conservative gain from Liberal Democrat | Swing | +3.8 | |||
See also
Notes and references
- Notes
- ↑ A county constituency (for the purposes of election expenses and type of returning officer)
- ↑ As with all constituencies, the constituency elects one Member of Parliament (MP) by the first past the post system of election at least every five years.
- References
- ↑ "Electorate Figures - Boundary Commission for England". 2011 Electorate Figures. Boundary Commission for England. 4 March 2011. Retrieved 13 March 2011.
- ↑ Fifth periodical report - Volume 4 Mapping for the Non-Metropolitan Counties and the Unitary Authorities, The Stationery Office, 26 February 2007, ISBN 0-10-170322-8
- ↑ Leigh Rayment's Historical List of MPs – Constituencies beginning with "H" (part 2)
- ↑ "Election Data 2015". Electoral Calculus. Archived from the original on 17 October 2015. Retrieved 17 October 2015.
- ↑ Tanner, Bill (16 January 2015). "Ex SAS soldier to fight for UKIP in Hereford". Hereford Times. Retrieved 22 February 2015.
- ↑ http://electionresults.blogspot.co.uk/2013/04/hereford-herefordshire-south-2015.html
- ↑ http://www.diana4hereford.net/
- ↑ "Election Data 2010". Electoral Calculus. Archived from the original on 17 October 2015. Retrieved 17 October 2015.
- ↑ "Five candidates nominated to stand in Hereford and South Herefordshire". Herefordshire Council. 2010-04-21. Retrieved 2010-05-05.
Coordinates: 52°00′N 2°42′W / 52.0°N 2.7°W