Freedom Front Plus
Freedom Front Plus Vryheidsfront Plus | |
|---|---|
.png) | |
| Leader | Pieter Groenewald |
| Chairperson | Anton Alberts |
| Founded | 1 March 1994 |
| Headquarters | Pretoria, Gauteng, South Africa |
| Ideology |
Afrikaner nationalism, Christian democracy, Economic liberalism, Social conservatism |
| Political position | Right-wing |
| National affiliation | Collective for Democracy |
| International affiliation | Unrepresented Nations and Peoples Organization |
| Colours | Green and Dark orange |
| National Assembly seats |
4 / 400 |
| NCOP seats |
0 / 90 |
| Website | |
|
www | |
The Freedom Front Plus (FF+; Afrikaans: Vryheidsfront Plus, VF+) is a national South African political party that was formed (as the Freedom Front) in 1994. It is led by Pieter Groenewald. Current policy positions include amending affirmative action and land reform to protect the interests of Afrikaners.[1]
Along with other smaller parties, the FF+ has entered into coalition with the larger Democratic Alliance after the 2016 municipal elections to govern Johannesburg, Tshwane and several other municipalities.
Foundation and early years

The Freedom Front was founded on 1 March 1994 by members of the Afrikaner community under Constand Viljoen, after he had left the Afrikaner Volksfront amidst disagreements. Seeking to achieve his goals through political means, Viljoen registered the Freedom Front with the Independent Electoral Commission (IEC) on 4 March 1994 to take part in the April 1994 general elections. (This date has also been given as 7 March.) On 12 March 1994 Viljoen handed in a list of candidates for the FF to the IEC, confirming that his party would take part in the elections. Viljoen considered the election as a chance for an unofficial referendum, and urged Afrikaners to vote for the Freedom Front in their numbers to show support for the idea of a "volkstaat", a separate nation for Afrikaners that would split away from the rest of South Africa.
In the election, under the leadership of General Viljoen, the Freedom Front received 2.2% of the national vote (with 424,555 votes cast), earning nine seats in the National Assembly, and 3.3% (with 639,643 votes cast) of the combined vote to the nine provincial legislatures. This suggested that many Afrikaners had split their vote. The party performed the best in the rural areas of the former Transvaal and Orange Free State, and was noted by the new deputy president Thabo Mbeki as representing possibly as much as half the Afrikaner voting population in these areas, with the strongest support among farmers and the working class.[3]
Freedom Front support would gradually melt away in the coming years, as the party was strung along in ultimately fruitless negotiations with the African National Congress (ANC) to create a volkstaat, making the party lose its importance. It would also receive increased competition from new parties such as the Afrikaner Eenheidsbeweging. In the 1999 election their support dropped to 0.8% (127,217 votes cast) with three seats in the National Assembly and between 1-2% in their stronghold provinces. This represented a respectable portion of the Afrikaner vote, but nowhere near earlier levels. The party's support has remained relatively steady in all elections held since.
In 2001, Viljoen handed over the leadership of the Freedom Front to Pieter Mulder.
Formation of the Freedom Front Plus

In 2003, shortly before the 2004 general election, the Conservative Party, the Afrikaner Eenheidsbeweging and the Freedom Front decided to contest the election as a single entity under the name Freedom Front Plus (FF+), led by Mulder. Later, also the Federal Alliance joined the VF+/FF+.
In the 2004 general election, support for the Freedom Front Plus rose slightly to 0.89% (139,465 votes cast). The party won one seat in most of the provincial legislatures, and four seats in the National Assembly.
In the 2006 municipal elections, the Freedom Front Plus received 1% of the popular vote (252,253 votes cast).
In the 2009 general election, the party received 0.83% (146,796 votes cast) and retained its four seats in the National Assembly but losing its seats in the provincial legislatures of North West, Mpumalanga and Northern Cape. After the elections, the Freedom Front's leader Pieter Mulder was appointed as Deputy Minister of Agriculture, Forestry and Fisheries by the new President Jacob Zuma.
In the 2014 general election, the FF+ increased its vote slightly to 0.9%. It retained its 4 MPs, and also regained a seat in the North West.
The party has enjoyed consistent landslide victories in the Afrikaner enclave Orania.[4]
Leaders
| No. | Image | Name | Term start | Term end | Notes |
|---|---|---|---|---|---|
| 1 | 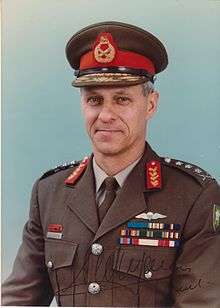 | Constand Viljoen | 1 March 1994 | 26 June 2001 | Chief of the South African Army (1976 – 1980) Chief of the South African Defence Force (1980 – 1985) |
| 2 |  | Pieter Mulder | 26 June 2001 | 12 November 2016 | Deputy Minister of Agriculture, Forestry and Fisheries (2009–2014) |
| 3 | Pieter
Groenewald |
12 November 2016[5] |
Election results
National elections
| Election | Total votes | Share of vote | Seats | +/– | Government |
|---|---|---|---|---|---|
| 1994 | 424,555 | 2.17% | 9 / 400 |
– | in opposition |
| 1999 | 127,217 | 0.80% | 3 / 400 |
|
in opposition |
| 2004 | 139,465 | 0.89% | 4 / 400 |
|
in opposition |
| 2009 | 146,796 | 0.83% | 4 / 400 |
|
in opposition |
| 2014[6] | 165,715 | 0.90% | 4 / 400 |
|
in opposition |
Provincial elections
| Election | Eastern Cape | Free State | Gauteng | Kwazulu-Natal | Limpopo | Mpumalanga | North-West | Northern Cape | Western Cape | |||||||||
|---|---|---|---|---|---|---|---|---|---|---|---|---|---|---|---|---|---|---|
| % | Seats | % | Seats | % | Seats | % | Seats | % | Seats | % | Seats | % | Seats | % | Seats | % | Seats | |
| 1994 | 0.80% | 0/56 | 6.03% | 2/30 | 6.17% | 5/86 | 0.51% | 0/81 | 2.15% | 1/40 | 5.66% | 2/30 | 4.63% | 1/30 | 5.97% | 2/30 | 2.06% | 1/42 |
| 1999 | 0.33% | 0/63 | 2.11% | 1/30 | 1.25% | 1/73 | 0.23% | 0/80 | 0.65% | 0/49 | 1.70% | 1/30 | 1.38% | 1/33 | 1.66% | 1/30 | 0.40% | 0/42 |
| 2004 | 0.26% | 0/63 | 2.47% | 1/30 | 1.34% | 1/73 | 0.28% | 0/80 | 0.60% | 0/49 | 1.24% | 1/30 | 1.32% | 1/33 | 1.55% | 1/30 | 0.62% | 0/42 |
| 2009 | 0.20% | 0/63 | 2.01% | 1/30 | 1.63% | 1/73 | 0.17% | 0/80 | 0.61% | 0/49 | 0.89% | 0/30 | 1.81% | 0/33 | 1.24% | 0/30 | 0.43% | 0/42 |
| 2014[6] | 0.31% | 0/63 | 2.10% | 1/30 | 1.20% | 1/73 | 0.20% | 0/80 | 0.69% | 0/49 | 0.82% | 0/30 | 1.72% | 1/33 | 1.09% | 0/30 | 0.55% | 0/42 |
Municipal elections
| Election | Votes | % |
|---|---|---|
| 1995-96 | 230 845 | 2.7% |
| 2000 | 0.1% | |
| 2006 | 252,253 | 1% |
| 2011 | 153,159 | 0.5% |
| 2016[7] | 307,549 | 0.8% |
See also
- Afrikaner
- Boer Republics
- Whites in South Africa
- Homeland
- Home Rule
- Separatism
- Ethnic nationalism
- Orania, Northern Cape
References
- ↑ FF+ to target DA’s Afrikaner voting base
- ↑ "Freedom Front Policy". Freedom Front. Retrieved 2009-05-17.
- ↑ http://www.politicsweb.co.za/news-and-analysis/unmandated-reflections--thabo-mbeki
- ↑ "Orania votes for FF+". IOL. 23 April 2009.
- ↑ White, Ray. "Pieter Mulder steps down as Freedom Front Plus leader". Retrieved 2016-11-13.
- 1 2 "2014 National and Provincial Elections Results - 2014 National and Provincial Election Results". IEC. Retrieved 11 May 2014.
- ↑ "Results Summary - All Ballots" (PDF). elections.org.za. Retrieved 11 August 2016.
External links
| By province | |||||||||||
|---|---|---|---|---|---|---|---|---|---|---|---|
| Political movements |
| ||||||||||
| Trade unions and Social movements | see South Africa trade unions
| ||||||||||
| Law | see South African law | ||||||||||
| Terrorism | |||||||||||
| Political culture |
| ||||||||||
| Other | |||||||||||