East Lycoming School District
| East Lycoming School District | |
|---|---|
 | |
| Address | |
|
349 Cemetery Street Hughesville, Pennsylvania, Lycoming County 17737-1028 United States | |
| Information | |
| Type | Public |
| School board | 9 locally elected members |
| Superintendent | Michael Pawlik (7/1/2011 to June 30, 2016) salary $115,260 2013), salary $113,000 2011)[1] |
| Administrator |
David L Maciejewski - Business Manager |
| Principal | Ronald Lorson, HS |
| Principal | Sherry L Cowburn, JAES |
| Principal | Jill R Warg, CRES & GFES |
| Staff | 86 non teaching staff members (2015), 88 (2010) |
| Faculty |
105 (2013)[2] 118.5 teachers in 2010. 115 in 2012, |
| Grades | preK-12 |
| Age | 4 years old preschool to 21 years old special education |
| Number of students |
1,636 pupils (2016)[3] |
| • Kindergarten | 132 (2012), 108 (2010) |
| • Grade 1 | 124 (2012), 104 |
| • Grade 2 | 129 (2012), 126 |
| • Grade 3 | 101 (2012), 121 |
| • Grade 4 | 118 (2012), 121 |
| • Grade 5 | 127 (2012), 121 |
| • Grade 6 | 123 (2012), 115 |
| • Grade 7 | 137 (2012), 123 |
| • Grade 8 | 123 (2012), 146 |
| • Grade 9 | 123 (2012), 130 |
| • Grade 10 | 125 (2012), 141 |
| • Grade 11 | 142 (2012), 139 |
| • Grade 12 | 119 (2012), 130 (2010) |
| • Other | 50 pupils (2012) |
| Language | English |
| Mascot | Spartans |
| Budget |
$24,747,192 (2016-17)[9] |
| Per pupil spending | $10,475 (2008) |
| Per pupil spending | $12,723.94 (2010) |
| Per pupil spending | $12,661.48 (2012) |
| Website | http://www.eastlycoming.net/ |
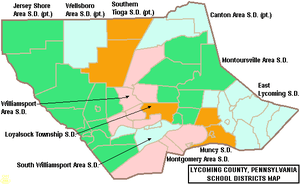
The East Lycoming School District is a small, rural, public school district located in Lycoming County, Pennsylvania. It serves the Boroughs of Hughesville and Picture Rocks and Franklin Township, Jordan Township, Mill Creek Township, Moreland Township, Penn Township, Shrewsbury Township and Wolf Township in Lycoming County, Pennsylvania. East Lycoming School District encompasses approximately 148 square miles (380 km2). According to 2000 federal census data, East Lycoming School District served a resident population of 10,368 people. By 2010, the District's population was 10,428 people.[11] The educational attainment levels for the East Lycoming School District population (25 years old and over) were 89% high school graduates and 18.7% college graduates.[12] The District is one of the 500 public school districts of Pennsylvania.
According to the Pennsylvania Budget and Policy Center, 30.4% of the East Lycoming School District's pupils lived at 89.4% or below the Federal Poverty Level as shown by their eligibility for the federal free or reduced price school meal programs in 2012.[13] In 2009, the District residents’ per capita income was $17,385, while the median family income was $43,314.[14] In the Commonwealth, the median family income was $49,501 [15] and the United States median family income was $49,445, in 2010.[16] By 2013, the median household income in the United States rose to $52,100.[17] The educational attainment levels for the East Lycoming School District population (25 years old and over) were 89.4% high school graduates and 18.7% college graduates.[18]
According to District officials, in school year 2009-10, the East Lycoming School District provided basic educational services to 1,676 pupils. It employed: 123 teachers, 68 full-time and part-time support personnel, and 11 administrators. East Lycoming School District received more than $11.4 million in state funding in school year 2009-10. Per East Lycoming School District officials, in school year 2007–08, the East Lycoming School District provided basic educational services to 1,674 pupils. It employed: 126 teachers, 65 full-time and part-time support personnel, and 11 administrators.
East Lycoming School District operates four public schools: Hughesville Junior Senior High School, Ashkar Elementary School, Ferrell Elementary School and Renn Elementary School. High school students may choose to attend Lycoming Career and Technology Center for training in the construction and mechanical trades, child are, culinary art, criminal justice and other careers. The BLaST Intermediate Unit IU17 provides the District with a wide variety of services like specialized education for disabled students and hearing, speech and visual disability services and professional development for staff and faculty.
Governance
East Lycoming School District is governed by 9 individual, locally elected, board members (serve without compensation for a term of four years), the Pennsylvania State Board of Education, the Pennsylvania Department of Education and the Pennsylvania General Assembly.[19] The federal government controls programs it funds like: Title I funding for low income children in the Elementary and Secondary Education Act and the No Child Left Behind Act, (renamed Every Student Succeeds Act (ESSA) in December 2015) which mandates the district focus its resources on student success in acquiring reading and math skills.[20] The school board is required by state law to post a financial report on the district in its website by March of each school year.[21]
The Superintendent and Business Manager are appointed by the local school board. The Superintendent is the chief administrative officer with overall responsibility for all aspects of operations, including education and finance. The Business Manager is responsible for budget and financial operations. Neither of these officials are voting members of the School Board. The School Board enters into individual employment contracts for these two positions for no more than 5 years. These contracts must be in writing and are subject to public discloure under the state's Right to Know Act. In Pennsylvania, public school districts are required to give 150 days notice to the Superintendent regarding renewal of the employment contract.[22] Pursuant to Act 141 of 2012 which amended the Pennsylvania School Code, all school districts that have hired superintendents on/after the fall of 2012 are required to develop objective performance standards and post them on the district's website.[23]
The Commonwealth Foundation for Public Policy Alternatives Sunshine Review gave the East Lycoming School Board and district administration a "F" for transparency based on a review of "What information can people find on their school district's website". It examined the school district's website for information regarding; taxes, the current budget, meetings, school board members names and terms, contracts, audits, public records information and more.[24]
Academic achievement
East Lycoming School District was ranked 114th out of 493 Pennsylvania school districts in 2016, by the Pittsburgh Business Times.[25] The ranking was based on student academic achievement, for the last three years, on the PSSAs for: reading, writing, math and science.[26] The ranking was based on student academic achievement as demonstrated on the last three years of the PSSAs for: reading, writing math and science.[27] Three school districts were excluded because they do not operate high schools (Saint Clair Area School District, Midland Borough School District, Duquesne City School District). Several more were not included because the PDE withheld their test data, including South Williamsport Area School District. The PSSAs are given to all children in grades 3rd through 8th and the 11th grade in high school. Adapted examinations are given to children in the special education programs. Adapted PSSA examinations are given to children in the special education programs. Writing exams were given to children in 5th and 8th grades.[28]
- Overachiever statewide ranking
In 2013, the Pittsburgh Business Times also reported an Overachievers Ranking for 498 Pennsylvania school districts. East Lycoming School District ranked 123rd. The editor describes the ranking as: "a ranking answers the question - which school districts do better than expectations based upon economics? This rank takes the Honor Roll rank and adds the percentage of students in the district eligible for free and reduced-price lunch into the formula. A district finishing high on this rank is smashing expectations, and any district above the median point is exceeding expectations."[36]
- 2012 - 60th
- 2011 - 40th
In 2009, the academic achievement, of the students in the East Lycoming School District, was in the 86th percentile among all 500 Pennsylvania school districts Scale (0–99; 100 is state best)[37]
District AYP status
In 2012, East Lycoming School District achieved AYP status under No Child Left Behind.[38] In 2011, East Lycoming School District achieved Adequate Yearly Progress (AYP).[39] In 2011, 94 percent of the 500 Pennsylvania public school districts achieved the No Child Left Behind Act progress level of 72% of students reading on grade level and 67% of students demonstrating on grade level math. In 2011, 46.9 percent of Pennsylvania school districts achieved Adequate Yearly Progress (AYP) based on student performance. An additional 37.8 percent of school districts made AYP based on a calculated method called safe harbor, 8.2 percent on the growth model and 0.8 percent on a two-year average performance.[40] East Lycoming School District achieved AYP status each year from 2005 to 2009, while in 2004 the District was in Warning status due to lagging student achievement. In 2003, the District achieved AYP status.[41]
Graduation rate
In 2016, East Lycoming School District's graduation rate was 93.2%.[42]
- 2015 - 95.8%[43]
- 2014 - 92.56%
- 2013 - 91.55%.
- 2012 - 90.30%.[44]
- 2011 - 94%.[45]
- 2010 - 92.75%, the Pennsylvania Department of Education issued a new, 4-year cohort graduation rate.[46]
According to traditional graduation rate calculations:
Hughesville Junior and Senior High School
Hughesville Junior/Senior High School is located at 349 Cemetery Street, Hughesville Pennsylvania. In 2015, enrollment was reported as 748 pupils in 7th through 12th grades, with 27.6% of pupils eligible for a free lunch due to family poverty. Additionally, 8.9% of pupils received special education services, while 5% of pupils were identified as gifted.[51] The school employed 50 teachers.[52] Per the PA Department of Education, 100% of the teachers were rated "Highly Qualified" under the federal No Child Left Behind Act.
In 2013, Hughesville Junior/Senior High School's enrollment was reported as 769 pupils in 7th through 12th grades, with 27% of pupils eligible for a free lunch due to family poverty. Additionally, 10% of pupils received special education services, while 5% of pupils were identified as gifted. The school employed 52 teachers.[53] Per the PA Department of Education, 100% of the teachers were rated "Highly Qualified" under the federal No Child Left Behind Act.
In 2010, Hughesville Junior/Senior High School had 803 students in grades 7th through 12th, with 224 pupils eligible for a federal free or reduced-price lunch. The schools had 64 faculty members yielding a student–teacher ratio of 13:1. The school district is accredited by the Pennsylvania Department of Education. The school offers a variety of curriculum options designed to meet the standards set forth by the Pennsylvania Department of Education. Hughesville Junior/Senior High also provides several co-curricular activities, including boys' and girls' athletic programs and school-sponsored clubs.[54]
- 2016 School Performance Profile
SPP 65.5 out of 100 points. Hughesville Area Junior Senior High School Keystone Exams mandated testing results were: 79% of students were on grade level in reading/literature and 83% of students demonstrated on grade level in Algebra I. In Biology I, 85% of pupils demonstrated on grade level science understanding at the end of the Biology course.[55] The requirement that pupils pass the Keystone Exams in reading, algebra I and bIology I in order to graduate was postponed until 2019 by the Pennsylvania General Assembly because less than 60% of 12 grade pupils statewide would have been eligible for graduation from high school due to failing one or more Keystone Exams.[56] Fifty-four percent of the 2,676 public schools in Pennsylvania achieved a passing score of 70 or better.[57]
- 2015 School Performance Profile
Hughesville Junior Senior High School achieved an SPP of 71.1 out of 100. Reflects on grade level reading, mathematics and science achievement.The PDE reported that 79% of the High School's students were on grade level in reading/literature. In Algebra 1, 81.9% of students showed on grade level skills at the end of the course. In Biology I, 59.4% demonstrated on grade level science understanding at the end of the course.[58] Statewide, 53 percent of schools with an eleventh grade achieved an academic score of 70 or better. Five percent of the 2,033 schools with 11th grade were scored at 90 and above; 20 percent were scored between 80 and 89; 28 percent between 70 and 79; 25 percent between 60 and 69 and 22 percent below 60. The Keystone Exam results showed: 73 percent of students statewide scored at grade-level in English, 64 percent in Algebra I and 59 percent in biology.[59][60]
- 2014 School Performance Profile
Hughesville Junior Senior High School achieved an SPP of 77 out of 100. Reflects on grade level reading, mathematics and science achievement. In reading/literature - 77% were on grade level. In Algebra 1, 80.6% showed on grade level skills. In Biology, 63.35% demonstrated on grade level science understanding at the end of the course.[61][62] Statewide, the percentage of high school students who scored proficient and advanced in Algebra I increased to 39.7% to 40.1%. The percentage of high school students who scored proficient and advanced in reading/literature declined to 52.5%. The percentage of high school students who scored proficient and advanced in biology improved from 39.7% to 41.4%.[63]
According to the Pennsylvania Department of Education, 2,134 of 2,947 Pennsylvania public schools (72 percent of Pennsylvania public schools), achieved an academic score of 70 or higher.[64] Fifty-three percent of schools statewide received lower SPP scores compared with last year's, while 46 percent improved. A handful were unchanged.[65][66]
- 2013 School Performance Profile
Hughesville Junior Senior High School achieved 82.5 out of 100. Reflects on grade level reading, mathematics and science achievement. In reading/literature - 77.8% were on grade level. In Algebra 1, 86.86% showed on grade level skills. In Biology, 63% showed on grade level science understanding. Eighth graders writing was 92% on grade level.[67] According to the Pennsylvania Department of Education, 2,181 public schools (less than 73 percent of Pennsylvania public schools), achieved an academic score of 70 or higher.
- AYP History
In 2012, Hughesville Junior Senior High School declined to Warning Adequate Yearly Progress (AYP) status due to lagging academic achievement in reading.[68] In 2010 and 2011, Hugesville Junior Senior High School achieved AYP status.[69] From 2005 through 2009, the School achieved Adequate Yearly Progress (AYP) each school year.
- PSSA Results
Pennsylvania System of School Assessments, commonly called PSSAs are No Child Left Behind Act related examinations which were administered from 2003 through 2012, in all Pennsylvania public high schools. The exams were administered in the Spring of each school year. The goal was for 100% of students to be on grade level or better in reading and mathematics, by the Spring of 2014. The tests focused on the state's Academic Standards for reading, writing, mathematics and science. The Science exam included content in science, technology, ecology and the environmental studies. The mathematics exam included: algebra I, algebra II, geometry and trigonometry. The standards were first published in 1998 and are mandated by the Pennsylvania State Board of Education.[70] In 2013, the Commonwealth of Pennsylvania changed its high school assessments to the Keystone Exams in Algebra 1, Reading/literature and Biology1. The exams are given at the end of the course, rather than all in the spring of the student's 11th grade year.[71]
- 11th Grade Reading
- 2012 - 77% on grade level, (14% below basic). State - 67% of 11th graders are on grade level.
- 2011 - 74% (14% below basic). State - 69.1% [72]
- 2010 - 76%, (14% below basic). State - 66% [73]
- 2009 - 78% (9% below basic), State - 65% [74]
- 2008 - 68% (12% below basic), State - 65% [75]
- 2007 - 76% (9% below basic), State - 65% [76]
- 11th Grade Math
- 2012 - 72%, on grade level (12% below basic). In Pennsylvania, 59% of 11th graders are on grade level.
- 2011 - 82% (7% below basic). State - 60.3% [77]
- 2010 - 79%, (8% below basic). State - 59% [78]
- 2009 - 83% (8% below basic). State - 56% [79]
- 2008 - 69% (14% below basic). State - 56%[80]
- 2007 - 72% (11% below basic). State - 53% [81]
- 11th Grade Science
- 2012 - 43% on grade level (14% below basic). State - 42% of 11th graders were on grade level.
- 2011 - 44%, (16% below basic). State - 40%
- 2010 - 39%, (18% below basic). State - 39%
- 2009 - 47%, (12% below basic). State - 40%
- 2008 - 40%, (8% below basic). State - 39%
Science in Motion Hughesville Junior Senior High School took advantage of a state program called Science in Motion which brought college professors and sophisticated science equipment to the school to raise science awareness and to provide inquiry-based experiences for the students. The Science in Motion program was funded by a state appropriation and cost the school nothing to participate.[82] Susquehanna University provided the science enrichment experiences to schools in the region.
College remediation
According to a Pennsylvania Department of Education study released in January 2009, 7% of Hughesville Senior High School graduates required remediation in mathematics and or reading before they were prepared to take college level courses in the Pennsylvania State System of Higher Education or community colleges.[83] Less than 66% of Pennsylvania high school graduates, who enroll in a four-year college in Pennsylvania, will earn a bachelor's degree within six years. Among Pennsylvania high school graduates pursuing an associate degree, only one in three graduate in three years.[84] Per the Pennsylvania Department of Education, one in three recent high school graduates who attend Pennsylvania's public universities and community colleges takes at least one remedial course in mathematics or English.
SAT scores
In 2015, 74 East Lycoming School District students took the SAT exams. The District's Verbal Average Score was 497. The Math average score was 530. The Writing average score was 467.[85] The College Board also reported that statewide 96,826 pupils took the exams with average scores declining in all three measurers to: 495 in reading, 511 in math and 484 in writing.[86]
In 2014, 87 East Lycoming School District students took the SAT exams. The District's Verbal Average Score was 481. The Math average score was 526. The Writing average score was 460.[87][88] Statewide in Pennsylvania, Verbal Average Score was 497. The Math average score was 504. The Writing average score was 480. The College Board also reported that nationwide scores were: 497 in reading, 513 in math and 487 in writing.[89] In 2014, 1,672,395 students took the SATs in the United States.
In 2013, 70 East Lycoming School District students took the SAT exams. The District's Verbal Average Score was 511. The Math average score was 531. The Writing average score was 484. The College Board reported that statewide scores were: 494 in reading, 504 in math and 482 in writing. The nationwide SAT results were the same as in 2012.[90]
In 2012, 93 East Lycoming School District students took the SAT exams. The District's Verbal Average Score was 479. The Math average score was 508. The Writing average score was 447. The statewide Verbal SAT exams results were: Verbal 491, Math 501, Writing 480. In the USA, 1.65 million students took the exams achieving scores: Verbal 496, Math 514, Writing 488. According to the College Board the maximum score on each section was 800, and 360 students nationwide scored a perfect 2,400.
In 2011, 86 East Lycoming students took the SAT exams. The district's Verbal Average Score was 490. The Math average score was 520. The Writing average score was 489.[91] Pennsylvania ranked 40th among states with SAT scores: Verbal - 493, Math - 501, Writing - 479.[92] In the United States, 1.65 million students took the exam in 2011. They averaged 497 (out of 800) verbal, 514 math and 489 in writing.[93]
Junior high school
- 2016 School Performance Profile
Hughesville Junior School PSSA mandated testing results were: 58% of students in 8th grade were on grade level in reading, while just 33% of students demonstrated on grade level in mathematics. In science, 58% of eighth grade pupils demonstrated on grade level science understanding.[94] In 7th grade, 62% of pupils were on grade level in reading, while just 56% demonstrated on grade level math skills.
- 2015 School Performance Profile
The PDE reported that 71% of 8th grade students were on grade level in reading on the PSSAs given in April 2015. In math/Algebra 1, 49% of 8th grade students showed on grade level skills. In science, 78% of the school's 8th graders demonstrated on grade level science understanding. No eighth grade writing scores were reported. In 7th grade, 68% were on grade level in reading, while 47% showed on grade level math skills.[95] Statewide 58% of eighth (8th) graders were on grade level in reading, while 29% demonstrated on grade level math skills. Pennsylvania 7th graders were 58% on grade level in reading and 33% demonstrated on grade level math skills.[96]
- PSSAs
Seventh grades have been tested in reading and mathematics since 2006. Eighth graders are tested in: reading, writing, mathematics and Science. Beginning in the Spring of 2013, eighth graders, who are enrolled in Algebra I take the Keystone Exam for Algebra I at the end of the course. The testing of 8th grade in reading and mathematics began in 1999, as a state initiative.[97] Testing in science began in 2007. The goal is for 100% of students to be on grade level or better in reading and mathematics, by the Spring of 2014. The tests focus on the state's Academic Standards for reading, writing, mathematics and science.[98] The standards were published in 1998 and are mandated by the Pennsylvania State Board of Education.[99] In 2014, the Commonwealth of Pennsylvania adopted the Pennsylvania Core Standards - Mathematics.[100]
- 8th Grade Reading
- 2012 - 88% on grade level 71% advanced. In Pennsylvania, 79% of 8th graders on grade level.[101]
- 2011 - 83%, 61% advanced. State - 81.8%
- 2010 - 90%, 63% advanced (5% below basic). State - 81%[102]
- 2009 - 83%, 59% advanced (6% below basic), State - 80%
- 2008 - 90%, 65% advanced (6% below basic), State - 78%
- 2007 - 73%, 53% advanced (11% below basic), State - 75%[103]
- 8th Grade Math
- 2012 - 91% on grade level, 69% advanced. State - 76% [104]
- 2011 - 82%, 76% advanced. State - 76.9%
- 2010 - 91%, 73% advanced (2% below basic) State - 75%
- 2009 - 83%, 64% advanced (7% below basic), State - 71%
- 2008 - 90%, 66% advanced (6% below basic), State - 70%[105]
- 2007 - 71%, 45% advanced (16% below basic), State - 67%
- 8th Grade Science
- 2012 - 80% on grade level (16% below basic). State - 59%.
- 2011 - 65%, (16% below basic). State - 58.3%.
- 2010 - 63%, (14% below basic), State - 57%.
- 2009 - 62%, (14% below basic), State: - 54%[106]
- 2008 - 66%, (13% below basic), State - 52%[107]
|
|
- Dropout Early Warning System
In 2013, East Lycoming School District did not implement the state's free dropout prevention Early Warning System and Interventions Catalog in the junior high school.[108] The process identifies students at risk for dropping out by examining the pupil's: attendance, behavior and course grades. Interventions are implemented to assist at-risk pupils to remain in school. The program is funded by federal and private dollars.[109]
Ashkar Elementary School
Ashkar Elementary School is one located Hughesville, Pennsylvania. In 2015, the School's enrollment was 508 pupils in preschool through 6th, with 36.6% of pupils receiving a federal free or reduced price meals due to family poverty. Additionally, 11.5% of the pupils receive special education services, while 1.5% are identified as gifted.[110] According to a report by the Pennsylvania Department of Education, 100% of the teachers were rated highly qualified under No Child Left Behind. The school provides full day kindergarten and a taxpayer funded preschool.[111] The school is a federally designated Title I school. The school was built in 1970 and named after Joseph C. Ashkar who was a math teacher at the Hughesville Junior/Senior High School.
Enrollment at the school was 517 students in grades PreSchool–6th in 2012-13. The school is a federally designated Title I school, with 35% of pupils receiving a federal free or reduced price lunch due to family poverty. The school employed 34 teachers yielding a student-teacher ratio of 14:1.[112] According to a report by the Pennsylvania Department of Education, 100% of its teachers were rated "Highly Qualified" under the federal No Child Left Behind Act.[113] The school provided full day kindergarten to all its pupils.[114] The school offers a variety of curriculum strategies targeted to the standards set forth by the Pennsylvania Department of Education.[115]
- 2016 School Performance Profile
SPP 78.4 out of 100 points. Ashkar Elementary School PSSA federally mandated testing results were: 6th graders 66% on grade level in reading and only 56% of 6th graders demonstrated on grade level skills in math. In 5th grade 80% of students were on grade level in reading, while 76% of students demonstrated on grade level mathematics skills. In 4th grade, 78% were on grade level in reading, while 82% demonstrated on grade level math skills. In science, 93% of fourth grade pupils demonstrated on grade level understanding of science concepts in the state standards. Among the school's third graders, 92% were on grade level in reading and 92% showed on grade level mathematics skills.[116][117]
- 2015 School Performance Profile
Among Ashkar Elementary School 6th graders, 62% were on grade level in reading and only 56% were on grade level in mathematics. According to the Pennsylvania Department of Education, 73% of 5th grade students were on grade level in reading on the PSSAs given in April 2015. In mathematics, 62% of 5th grade students showed on grade level skills. No fifth grade writing scores were reported. In 4th grade, 78% were on grade level in reading, while 78% showed on grade level math skills. In science, 85% of fourth graders showed on grade level understanding. Among third (3rd) graders, 86% were on grade level in reading and 82% were on grade level in mathematics.[118] Statewide 61.9% of fifth (5th) graders were on grade level in reading, while 42.8% demonstrated on grade level math skills. Pennsylvania 4th graders were 58.6% on grade level in reading and 44.4% demonstrated on grade level math skills. In science, 77.3% of fourth graders showed on grade level understanding. Among Pennsylvania third (3rd) graders, 62% were reading on grade level, while 48.5% demonstrated on grade level math skills.[119]
- 2014 School Performance Profile
Ashkar Elementary School achieved a score of 81.6 out of 100. The score reflects on grade level: reading, science, writing and mathematics achievement. In 2013-14, only 75% of the students were reading on grade level in grades 3rd through 6th. In 3rd grade, 83.5% of the pupils were reading on grade level. In math, 87.6% were on grade level (3rd-6th grades). In 4th grade science, 91% of the pupils demonstrated on grade level understanding. In writing, only 58% of 5th grade pupils demonstrated on grade level skills.[120]
- 2013 School Performance Profile
Ashkar Elementary School achieved a score of 82.9 out of 100. The score reflects on grade level: reading, science, writing and mathematics achievement. In 2012-13, only 78% of the students were reading on grade level in grades 3rd through 6th. In 3rd grade, 86.79% of the pupils were reading on grade level. In math, 87% were on grade level (3rd-6th grades). In 4th grade science, just 81.8% of the pupils demonstrated on grade level understanding. In writing, only 71% of 5th grade pupils demonstrated on grade level skills.[121]
- AYP History
From 2003 through 2012, the Joseph C. Ashkar Elementary School achieved AYP status each school year.[122] In 2011 the attendance rate was 95%, while in 2010 it was 96%.[123]
|
|
|
|
|
|
- 4th Grade Science
- 2012 - 96%, 58% advanced. State - 82%
- 2011 - 88%, 585 advanced. State – 82.9%
- 2010 - 92%, 51% advanced. State - 81%
- 2009 - 90%, 58% advanced. State - 83%
- 2008 - 84%, 51% advanced. State - 81%
|
|
Ferrell Elementary School
George A Ferrell Elementary School is located at 34 Court Street, Picture Rocks. In 2015, the School's enrollment was 151 pupils in grades kindergarten through 6th with 28% of pupils receiving a federal free or reduced price meals due to family poverty. Additionally, 9.9% of the pupils receive special education services, while 0.66% are identified as gifted.[128] According to a report by the Pennsylvania Department of Education, 100% of the teachers were rated highly qualified under No Child Left Behind. The school provides full day kindergarten.[129] The school is a federally designated Title I school.
According to the National Center for Education Statistics, in 2012, the school reported an enrollment of 157 pupils in kindergarten through 6th, with 31 pupils receiving a federal free or reduced price lunch due to family poverty. By 2013, enrollment was 161 pupils. The school is a federally designated Title I school. The school employed 9 teachers yielding a student-teacher ratio of 17:1.[130] According to a report by the Pennsylvania Department of Education, 100% of its teachers were rated "Highly Qualified" under the federal No Child Left Behind Act.[131] The school provides full day kindergarten to all its pupils.[132]
- 2016 School Performance Profile
SPP 86.7 out of 100 points. Ferrell Elementary School PSSA mandated testing results were: 91% of students in 6th grade were on grade level in reading, while 82% of students demonstrated on grade level mathematics skills. In 5th grade, 89% of students were on grade level in reading, while 84% of students demonstrated on grade level mathematics skills. In 4th grade, 68% were on grade level in reading, while 72% demonstrated on grade level math skills. In science, 92% of fourth grade pupils demonstrated on grade level understanding of science concepts in the state standards. Among the school's third graders, 81% were on grade level in reading and 95% showed on grade level mathematics skills.[133][134]
- 2015 School Performance Profile
Among 6th graders, 87% were on grade level in reading and 87% were on grade level in mathematics. According to the Pennsylvania Department of Education, 87% of 5th grade students at Ferrell Elementary School were on grade level in reading on the PSSAs given in April 2015. In mathematics, 79% of 5th grade students showed on grade level skills. No fifth grade writing scores were reported. In 4th grade, 61% were on grade level in reading, while 72% showed on grade level math skills. In science, 96% of fourth graders showed on grade level understanding. Among third (3rd) graders, just 68% were on grade level in reading and 61% were on grade level in mathematics.[135] Statewide 61.9% of fifth (5th) graders were on grade level in reading, while 42.8% demonstrated on grade level math skills. Pennsylvania 4th graders were 58.6% on grade level in reading and 44.4% demonstrated on grade level math skills. In science, 77.3% of fourth graders showed on grade level understanding. Among Pennsylvania third (3rd) graders, 62% were reading on grade level, while 48.5% demonstrated on grade level math skills.[136]
- 2014 School Performance Profile
Ferrell Elementary School achieved a score of 94.1 out of 100. The score reflects on grade level: reading, science, writing and mathematics achievement. In 2013-14, only 77% of the students were reading on grade level in grades 3rd through 6th. In 3rd grade, 80% of the pupils were reading on grade level. In math, 92.6% were on grade level (3rd-6th grades). In 4th grade science, just 95.8% of the pupils demonstrated on grade level understanding. In writing, only 87.5% of 5th grade pupils demonstrated on grade level skills.[137]
- 2013 School Performance Profile
George A Ferrell Elementary School achieved a score of 82.2 out of 100. The score reflects on grade level: reading, science, writing and mathematics achievement. In 2012-13, only 75.5% of the students were reading on grade level in grades 3rd through 6th. In 3rd grade, 66.67% of the pupils were reading on grade level. In math, 87% were on grade level (3rd-6th grades). In 4th grade science, 95.65% of the pupils demonstrated on grade level understanding. In writing only 68% of 5th grade pupils demonstrated on grade level skills.[138]
- AYP history
In 2010 through 2012, George A Ferrell Elementary School achieved AYP status.[139]
- PSSA results
|
|
|
|
|
|
- 4th Grade Science
- 2012 - 87%, 48% advanced. State - 82%
- 2011 - 95%, 72% advanced. State – 82.9%
- 2010 - 79%, 37% advanced. State - 81%
- 2009 - 88%, 48% advanced. State - 83%
- 2008 - 100%, 41% advanced, State - 81%
|
|
- Building history
The first school used by Picture Rocks was the Woodly School in Wolf Township where Mary Bates taught a class of five students. Eventually, another school was built on the corner of Center and Oak Streets where Amos Sprout was the teacher. In 1877, another school was built between Main and Center Streets, which remained until the Picture Rocks High School was constructed.
In 1926, the president of the school board, Morton I Sprout, laid the cornerstone for the present school building. The chairman of the building committee, Earnest Burrows, placed several items in the cornerstone which included a list of names of the members of the building committee, a description of the building, a photograph of the building, copies of the bonds used to finance the building project, and a list of the names of all the students enrolled in the school in 1926.
The building was completed and dedicated in June and was the first vocational high school in the state. Students traveled from all over, some stayed with families in town during the school week, just to attend school at Picture Rocks High School. The school contained four grade classrooms, four vocational rooms, an auditorium which held 600 people and a gymnasium. With seven teachers on staff, the student enrollment was 150 during its first year. Sports were an important part of the high school and several championships were held in different sports under coaches such as Frank Walp and Clyde "Pat' Collins.
In 1946, twenty years later, the school officially became an elementary school, serving children from the nearby townships, as it joined with the East Lycoming School District. The high school program was abolished due to lack of school population and the high school age students were transported by bus to the East Lycoming High School in Hughesville.
The elementary school was eventually named the George A. Ferrell Elementary School in memory of George A. Ferrell, who was the Assistant County Superintendent of Schools 1918–1935. During his career, Mr. Ferrell worked in the elementary school as a teacher and a principal. In 1986, the state granted permission to the district to completely remodel the Ferrell building. The outside of the building changed very little during these renovations. Former graduates of the Picture Rocks High School continue to hold reunion dinners at the school.
Renn Elementary School
The Carl G. Renn Elementary school in Lairdsville, PA was built in the 1962. In 2015, the School's enrollment was 224 pupils in grades preschool through 6th, with 43.7% of pupils receiving a federal free or reduced price meals due to family poverty. Additionally, 10.7% of the pupils receive special education services, while 0.45% are identified as gifted.[144] According to a report by the Pennsylvania Department of Education, 100% of the teachers were rated highly qualified under No Child Left Behind. The school provides full day kindergarten and taxpayer funded preschool.[145] The school is a federally designated Title I school.
According to the National Center for Education Statistics, in 2012, the school reported an enrollment of 220 pupils in grades preschool through 6th, with 80 pupils receiving a federal free or reduced price lunch due to family poverty. The school is a federally designated Title I school. The school employed 17 teachers yielding a student-teacher ratio of 12:1.[146] According to a report by the Pennsylvania Department of Education, 100% of its teachers were rated "Highly Qualified" under the federal No Child Left Behind Act.[147] The school provided full day kindergarten to all its pupils.[148]
- 2016 School Performance Profile
SPP 60.1 out of 100 points. Renn Elementary School PSSA mandated testing results were: 65% of students in 6th grade were on grade level in reading, while just 41% of students demonstrated on grade level mathematics skills. Among 5th graders, 52% of students were on grade level in reading, while 47% of students demonstrated on grade level mathematics skills. In 4th grade, 51% were on grade level in reading, while 51% demonstrated on grade level math skills. In science, 77% of fourth grade pupils demonstrated on grade level understanding of science concepts in the state standards. Among the school's third graders, 56% were on grade level in reading and 75% showed on grade level mathematics skills.[149][150]
- 2015 School Performance Profile
Among 6th graders, only 29% were on grade level in reading and just 25% were on grade level in mathematics. According to the Pennsylvania Department of Education, 69% of 5th grade students at Carl G. Renn Elementary School were on grade level in reading on the PSSAs given in April 2015. In mathematics, 69% of 5th grade students showed on grade level skills. No fifth grade writing scores were reported. In 4th grade, 47% were on grade level in reading, while 56% showed on grade level math skills. In science, 85% of fourth graders showed on grade level understanding. Among third (3rd) graders, 79% were on grade level in reading and 82% were on grade level in mathematics.[151]
- 2014 School Performance Profile
Carl G. Renn Elementary School achieved a score of 80.7 out of 100. The score reflects on grade level: reading, science, writing and mathematics achievement. In 2013-14, only 74% of the students were reading on grade level in grades 3rd through 5th. In 3rd grade, 83% of the pupils were reading on grade level. In math, 84% were on grade level (3rd-5th grades). In 4th grade science, 95% of the pupils demonstrated on grade level understanding. In writing, 80% of 5th grade pupils demonstrated on grade level skills.[152]
- 2013 School Performance Profile
Carl G. Renn Elementary School achieved a score of 90 out of 100. The score reflects on grade level: reading, science, writing and mathematics achievement. In 2012-13, only 79% of the students were reading on grade level in grades 3rd through 6th. In 3rd grade, 86.96% of the pupils were reading on grade level. In math, 89.7% were on grade level (3rd-6th grades). In 4th grade science, 100% of the pupils demonstrated on grade level understanding. In writing, 81% of 5th grade pupils demonstrated on grade level skills.[153]
- AYP History
In 2010 through 2012, Carl G. Renn Elementary School achieved AYP status.[154] The attendance rate was 96% in both 2010 and 2011.[155]
|
|
|
|
|
|
- 4th Grade Science
- 2012 - 97%, 40% advanced (0% below basic), State - 82%
- 2011 - 100%, 60% advanced (0% below basic), State - 82.9%
- 2010 - 88%, 46% advanced. State - 81%
- 2009 - 82%, 36% advanced. State - 83%
- 2008 - 77%, 31% advanced. State - 81%
|
|
Special education
In December 2015, East Lycoming School District administration reported that 204 pupils or 12.8% of the district's pupils received Special Education services, with 51% of the identified students having a specific learning disability.[160]
In 2013, the East Lycoming School District Administration reported that 172 pupils or 10.6% of the district's pupils received Special Education services, with 51.7% of the identified students having a specific learning disability.[161] In 2011, the East Lycoming School District Administration reported that 131 pupils or 8% of the district's pupils received Special Education services, with 42% of the identified students having a specific learning disability. In 2010, the District administration reported that 136 pupils or 8% of the district's pupils received Special Education services, with 47% of the identified students having a specific learning disability. In 2009, the East Lycoming School District Administration reported that 158 pupils or 9% of the district's pupils received Special Education services.[162]
In 2007, Pennsylvania Secretary of Education Gerald Zahorchak testified before the Pennsylvania House Education Committee regarding full day kindergarten. He claimed that districts which offered the program would see a significant decrease in special education students due to early identification and early intervention. He asserted the high cost of full day kindergarten would be recouped by Districts in lower special education costs.[163] East Lycoming School District has provided full day kindergarten since 2004 and taxpayer funded preschool. The District has seen an increase in the percentage of special education students it serves, yielding no savings.
The District engages in identification procedures to ensure that eligible students receive an appropriate educational program consisting of special education and related services, individualized to meet student needs. At no cost to the parents, these services are provided in compliance with state and federal law; and are reasonably calculated to yield meaningful educational benefit and student progress. To identify students who may be eligible for special education, various screening activities are conducted on an ongoing basis. These screening activities include: review of group-based data (cumulative records, enrollment records, health records, report cards, ability and achievement test scores); hearing, vision, motor, and speech/language screening; and review by the Instructional Support Team or Student Assistance Team. When screening results suggest that the student may be eligible, the District seeks parental consent to conduct a multidisciplinary evaluation. Parents who suspect their child is eligible may verbally request a multidisciplinary evaluation from a professional employee of the District or contact the Special Education Department.[164] By Pennsylvania law, the District has 60 calendar days, after receiving parental consent, to complete the evaluation.[165]
Students who have an Individual Education Plan (IEP) may take the PSSA-M an alternative math exam rather than the PSSA.[166] Some special education students may take the PASA (Pennsylvania Alternate System of Assessment), rather than the PSSA.[167] Schools are permitted to provide accommodations to some students.[168]
In 2010, the state of Pennsylvania provided $1,026,815,000 for special education services. The funds were distributed to districts based on a state policy which estimates that 16% of the district's pupils are receiving special education services. This funding is in addition to the state's basic education per pupil funding, as well as, all other state and federal funding.[169] The Special Education funding structure is through the federal Individuals with Disabilities Education Act (IDEA) funds and state appropriations. IDEA funds are appropriated to the state on an annual basis and distributed through intermediate units (IUs) to school districts, while state funds are distributed directly to the districts. Total funds that are received by school districts are calculated through a formula. The Pennsylvania Department of Education oversees four appropriations used to fund students with special needs: Special Education; Approved Private Schools; Pennsylvania Chartered Schools for the Deaf and Blind; and Early Intervention. The Pennsylvania Special Education funding system assumes that 16% of the district's students receive special education services. It also assumes that each student's needs accrue the same level of costs.[170] Over identification of students, in order to increase state funding, has been an issue in the Commonwealth. Some districts have more than 20% of its students receiving special education services while others have 10% supported through special education.[171] The state requires each public school district and charter school to have a three-year special education plan to meet the unique needs of its special education students.[172] In 2012, the Obama Administration's US Department of Education issued a directive requiring schools include students with disabilities in extracurricular activities, including sports.[173]
East Lycoming School District received a $999,966 supplement for special education services in 2010.[174] For the 2011-12, 2012–13, and 2013-14 school years, all Pennsylvania public school districts received the same level of funding for special education that they received in 2010-11. This level funding is provided regardless of changes in the number of pupils who need special education services and regardless of the level of services the respective students required.[175][176] Additionally, the state provides supplemental funding for extraordinarily impacted students. The District must apply for this added funding.
- 2014-15 school year, East Lycoming School District received an increase to $1,011,877 from the Commonwealth for special education funding.[177]
- 2015-16 - East Lycoming School District received an increase to $1,032,50
- 2016-17 school year, East Lycoming School District received a 1.2% increase in state special education funding to $1,044,510.[178]
In 2013, the state's Special Education Funding Reform Commission provided a report on the state of funding for special education in the Commonwealth.[179] Funding for special education programs is borne largely on a local basis at 60%, with the state contributing $1 billion or 30% and the federal government providing 10% of the funding.
Gifted education
The District Administration reported that 38 or 2.37% of its students were gifted in 2009.[180] By law, the district must provide mentally gifted programs at all grade levels. The primary emphasis is on enrichment and acceleration of the regular education curriculum through a push in model with the gifted instructor in the classroom with the regular instructor. This approach permits such specialized instructional strategies as tiered assignments, curriculum compacting, flexible grouping, learning stations, independent projects and independent contracts.[181] The referral process for a gifted evaluation can be initiated by teachers or parents by contacting the student's building principal and requesting an evaluation. All requests must be made in writing. To be eligible for mentally gifted programs in Pennsylvania, a student must have a cognitive ability of at least 130 as measured on a standardized ability test by a certified school psychologist. Other factors that indicate giftedness will also be considered for eligibility.[182]
Teacher evaluation study
In 2011, East Lycoming School District agreed to participate in a pilot program to develop a new way to evaluate teachers that, in part, takes into account student achievement. Several York County school districts are participating.[183] The pilot program had 104 K-12 entities, including: nine career and technical centers, nine charter schools and nine intermediate units. Beginning in January 2012, participating school districts will use the new evaluation method and provide feedback to the Department of Education. This new evaluation will not be used to determine an educator's official 2011-12 assessment. Under the new evaluation system, 50% of the evaluation of a teacher will be based on an observation divided into four categories: planning and preparation, classroom environment, instruction, and professional responsibilities. The other half will be based on student achievement (15 percent will be building-level data, 15 percent will be teacher-specific data, and 20 percent will be elective). The new evaluation system has both announced and unannounced observations. There are meetings between the teacher and evaluator before and after the direct observation of a lesson.[184]
School safety and Bullying policy
East Lycoming School District administration reported there were five reported incidents of bullying in the District in 2013. Additionally, there were several assaults on students and several sexual incidents involving students. The local law enforcement was involved in four incidents at the schools with four arrests.[185] [186] Each year the school safety data is reported by the district to the Safe School Center which then publishes the compiled reports online. Nationally, nearly 20% of pupils report being bullied at school.[187]
The East Lycoming School District administration reported there were no incidents of bullying in the district in 2009.[188][189]
The East Lycoming School Board has provided the district's antibully policy online.[190] All Pennsylvania schools are required to have an anti-bullying policy incorporated into their Code of Student Conduct. The policy must identify disciplinary actions for bullying and designate a school staff person to receive complaints of bullying. The policy must be available on the school's website and posted in every classroom. All Pennsylvania public schools must provide a copy of its anti-bullying policy to the Office for Safe Schools every year, and shall review their policy every three years. Additionally, the district must conduct an annual review of that policy with students.[191] The Center for Schools and Communities works in partnership with the Pennsylvania Commission on Crime & Delinquency and the Pennsylvania Department of Education to assist schools and communities as they research, select and implement bullying prevention programs and initiatives.[192]
Education standards relating to student safety and antiharassment programs are described in the 10.3. Safety and Injury Prevention in the Pennsylvania Academic Standards for Health, Safety and Physical Education.[193]
Budget
Pennsylvania public school districts budget and expend funds according to procedures mandated by the General Assembly and the Pennsylvania Department of Education (PDE). An annual operating budget is prepared by school district administrative officials. A uniform form is furnished by the PDE and submitted to the board of school directors for approval prior to the beginning of each fiscal year on July 1.
Under Pennsylvania's Taxpayer Relief Act, Act 1 of the Special Session of 2006, all school districts of the first class A, second class, third class and fourth class must adopt a preliminary budget proposal. The proposal must include estimated revenues and expenditures and the proposed tax rates. This proposed budget must be considered by the Board no later than 90 days prior to the date of the election immediately preceding the fiscal year. The preliminary budget proposal must also be printed and made available for public inspection at least 20 days prior to its adoption. The board of school directors may hold a public hearing on the budget, but are not required to do so. The board must give at least 10 days’ public notice of its intent to adopt the final budget according to Act 1 of 2006.[194]
In 2013, the average teacher salary in East Lycoming School District was $59,744 a year, while the cost of the benefits teachers received was $26,070 per employee, for a total annual average teacher compensation of $85,815.[195][196] Pennsylvania teacher salaries (2013–14) are searchable in a statewide database provided by TribLive News.[197] East Lycoming School District teacher and administrator retirement benefits are equal to at least 2.00% x Final Average Salary x Total Credited Service. (Some teachers benefits utilize a 2.50% benefit factor.)[198] After 40 years of service, Pennsylvania public school teachers and administrators can retire with 100% of the average salary of their final 3 years of employment. According to a study conducted at the American Enterprise Institute, in 2011, public school teachers’ total compensation is roughly 50 percent higher than they would likely receive in the private sector. The study found that the most generous benefits that teachers receive are not accounted for in many studies of compensation including: pension, retiree health benefits and job security.[199] In 2014-15, Pennsylvania public school district mandated teacher pension contribution rose to 21.40% of employee salaries and in 2015-16 it rose again to 25.84% of total salaries.[200] In 2014-15, the state mandated District contribution to the teacher pension fund rose to 21.40% of employee salaries and in 2015-16 it rose again to 25.84% of total District salaries.[201]
In 2012, the average teacher salary in East Lycoming School District was $60,829 a year, while the cost of the benefits teachers received was $19,734 per employee, for a total annual average teacher compensation of $80,563.[202] The District employed 128 teachers with an average salary of $61,579 and a top salary of $113,000.[203]
In 2011, the average teacher salary in East Lycoming School District was $57,373.79 a year, while the cost of the benefits teachers received was $16,607 per employee, for a total annual average teacher compensation of $73,981.46.[204] According to a study conducted at the American Enterprise Institute, in 2011, public school teachers’ total compensation is roughly 50 percent higher than they would likely receive in the private sector. The study found that the most generous benefits that teachers receive are not accounted for in many studies of compensation, including: pension, retiree health benefits and job security.[205]
In 2009, the District reports employing over 139 teachers with a starting salary of $39,000 for 180 pupil instruction days.[206] The average teacher salary was $53,996 while the maximum salary is $112,000.[207] As of 2007, Pennsylvania ranked in the top 10 states in average teacher salaries. When adjusted for cost of living Pennsylvania ranked fourth in the nation for teacher compensation.[208] Additionally, East Lycoming School District teachers receive a defined benefit pension, health insurance, professional development reimbursement, 2 paid personal days, 10 sick days, 3 paid bereavement leave days, and other benefits. Teachers are paid extra if they are required to work outside of the regular school day. Retiring teachers receive a bonus. The union officers may take 6 days, with pay, for union business.[209] According to State Rep. Glen Grell, a trustee of the Pennsylvania Public School Employees’ Retirement System Board, a 40-year educator can retire with a pension equal to 100 percent of their final salary.[210]
In 2007, East Lycoming School District employed 116 teachers. The average teacher salary in the district was $50,428 for 180 school days worked.[211]
Administrative spending East Lycoming School District administrative costs per pupil in 2008 were $506.29 per pupil. The district ranked 492nd out of 501 in Pennsylvania for administrative spending. The lowest administrative cost per pupil in Pennsylvania was $398 per pupil.[212] Superintendents and administrators receive a benefit package commensurate with that offered to the district's teachers' union.[213]
Per pupil spending In 2008, East Lycoming School District reported spending $10,475 per pupil. This ranked 444th in the commonwealth.[214] In 2010, the East Lycoming School District's per pupil spending had increased to $13,695.66.[215] In 2012, East Lycoming SD's per pupil spendign was reported as $12,661. In 2011, Pennsylvania's per pupil spending was $13,467, ranking 6th in the United States.[216] In 2007, the Pennsylvania per pupil total expenditures was reported as $12,759.[217] The U.S. Census Bureau reported that Pennsylvania spent $8,191 per pupil in school year 2000-01.[218]
Among the fifty states, Pennsylvania's total per pupil revenue (including all sources) ranked 11th at $15,023 per student, in 2008-09.[219] Pennsylvania's total revenue per pupil rose to $16,186 ranking 9th in the nation in 2011.[220]
Reserves In 2009, East Lycoming School District reported $1,801,258 in an unreserved-undesignated fund balance. The designated fund balance was reported as $3,600,000.[221] In 2010, East Lycoming School District Administration reported a decrease to $1,539,890 in the unreserved-undesignated fund balance. The District also reported an increase to $3,900,000 in its unreserved-designated fund in 2010. In 2014, East Lycoming School District reported reserves of $5,696,005 as of June 2013.[222] Pennsylvania public school district reserve funds are divided into two categories – designated and undesignated. The undesignated funds are not committed to any planned project. Designated funds and any other funds, such as capital reserves, are allocated to specific projects. School districts are required by state law to keep 5 percent of their annual spending in the undesignated reserve funds to preserve bond ratings. By law the state limits the total unreserved-undesignated fund balance at 8% of the annual budget for school districts that have budgets over $19 million a year. According to the Pennsylvania Department of Education, from 2003 to 2010, as a whole, Pennsylvania school districts amassed nearly $3 billion in reserved funds.[223] By 2013, reserves held by Pennsylvania public school districts, as a whole, had increased to over $3.8 billion.[224][225][226]
Audits In January 2010, the Pennsylvania Auditor General conducted a performance audit of the district. Findings were reported to the administration and school board.[227] An audit conducted in 2013 found that one teacher was retained for several years, with an outdated certificate. The District was fined by the State for the infraction.[228] In 2015, the District was audited again. The findings were reported to the elected school board and Commonwealth authorities.[229]
Tuition Students who live in the East Lycoming School District's attendance area may choose to attend one of Pennsylvania's 157 public charter schools. A student living in a neighboring public school district or a foreign exchange student may seek admission to East Lycoming School District. For these cases, the Pennsylvania Department of Education sets an annual tuition rate for each school district. It is the amount the public school district pays to a charter school for each resident student that attends the charter and it is the amount a nonresident student's parents must pay to attend the East Lycoming School District's schools. The 2012 tuition rates are Elementary School - $9,882.56, High School - $10,781.76.[230]
East Lycoming School District is funded by a combination of: a local earned income tax of 1.2%,[231] a property tax, a real estate transfer tax 0.5%, coupled with substantial funding from the Commonwealth of Pennsylvania and the federal government. Grants provide an opportunity to supplement school funding without raising local taxes. In the Commonwealth of Pennsylvania, pension and Social Security income are exempted from state personal income tax and local earned income tax regardless of the individual's wealth.[232] The average Pennsylvania public school teacher pension in 2011 exceeds $60,000 a year plus they receive federal Social Security benefits: both are free of Pennsylvania state income tax and local income tax which funds local public schools.[233] Effective 2016, active duty military are also exempted from paying the local earned income tax in Pennsylvania.[234][235]
State basic education funding
According to a report from Representative Todd Stephens office, East Lycoming School District receives 55.6% of its annual revenue from the state.[236]
In December 2014, the Pennsylvania Education Funding Reform Commission conducted a hearing. Testimony was given regarding state funding at the fastest growing districts and those with the greatest decline in enrollment since 1996. The commission developed a new basic education funding formula which sets a new way to distribute state basic education dollars. It abolished the practice of "hold harmless" funding, which gave districts at least the same as they got the previous school year regardless of declining enrollment. The plan became law in June 2016 (House Bill 1552).[237][238][239]
For the 2016-17 school year, East Lycoming School District received $8,182,648 in Basic Education Funding from the Commonwealth of Pennsylvania. This is a 1.5% increase over 2015-16 funding to the District. The highest percentage of BEF increase in Lycoming County was 5.7% awarded to Loyalsock Township School District under the state's Basic Education Funding formula. For the 2016-17 school year, Pennsylvania increased its public education spending to a record high of $5,895 billion. It was a $200 million increase, 3.51% increase over the 2015-16 appropriation.[240] The state also funded Ready to Learn grants at $250 million and Special Education funding received a $20 million increase.[241] The state also paid $492 million to the school employee social security fund and another $2.064 billion to the teacher's pension fund.[242] Statewide Conestoga Valley School District received a 13.3% increase in state BEF funding. Five PA public school districts received an increase of 10% or greater in Basic Education funding over their 2015-16 funding.
For the 2015-16 school year, Governor Tom Wolf released a partial Basic Education Funding of $3,832,116 to East Lycoming School District, in January 2016.[243] This was part of $10.3 billion in school funding withheld from the public schools, by the Governor since the summer of 2015.[244] The dispersement did not follow the new Basic Education Fair Funding formula which had been established by the Pennsylvania General Assemby in June 2015.[245] Ten (10) Pennsylvania school districts received no increase in Basic Eductaion funding under Governor Wolf.[246][247]
In compliance with a legislative mandate that was passed with veto proof majorities in the PA House and Senate,[248] the final BEF funding was determined for 2015-16, in April 2016. East Lycoming School District received $8,062,050 in Basic Education Funds for the 2015-16 school year. This was a 1.15% increase yielding a $267,638 increase over the previous school year funding. The District also received $209,970 in Ready to Learn funding from the state.[249]
For the 2014-15 school year, East Lycoming School District received $7,970,117 in State Basic Education funding. The District also received $103,862 in Accountability Block Grant funding and $106,108 in new Ready To Learn Block grant. The State's enacted Education Budget includes $5,526,129,000 for the 2014-2015 Basic Education Funding.[250] The Education budget also included Accountability Block Grant funding at $100 million and $241 million in new Ready to Learn funding for public schools that focus on student achievement and academic success. The State is paying $500.8 million to Social Security on the school employees behalf and another $1.16 billion to the state teachers pension system (PSERS). In total, Pennsylvania's Education budget for K-12 public schools is $10 billion. This was a $305 million increase over 2013-2014 state spending and the greatest amount ever allotted by the Commonwealth for its public schools.[251]
For the 2013-14 school year, the East Lycoming School District received $7,969,421 in Pennsylvania Basic Education Funding (BEF), which is $113,071 more than its 2012-13 state BEF to the District. Additionally, East Lycoming School District received $103,862 in Accountability Block Grant funding to focus on academic achievement and level funding for special education services. The District has the option of applying to several other state and federal grants to increase revenues. The Commonwealth's budget increased Basic Education Funding statewide by $123 million to over $5.5 billion. The state funded the PSERS (state school employee pension fund) with $1,017,000,000 and Social Security payments for school employees of $495 million.[252]
In the 2012-13 school year, East Lycoming School District received $7,960,212 in state funding.[253] The Governor's Executive Budget for 2012-2013 includes $9.34 billion for kindergarten through 12th grade public education, including $5.4 billion in basic education funding, which is an increase of $49 million over the 2011-12 budget. The state also provided $100 million for the Accountability Block Grant (ABG) funding. East Lycoming School District received $103,862 in ABG funds. The state also provided $544.4 million for School Employees’ Social Security and $856 million for School Employees’ Retirement fund called PSERS.[254] This amount is a $21,823,000 increase (0.34%) over the 2011-2012 appropriations for Basic Education Funding, School Employees' Social Security, Pupil Transportation, Nonpublic and Charter School Pupil Transportation. Since taking office, Corbett's first two budgets have restored more than $918 million in support of public schools, compensating for the $1 billion in federal stimulus dollars lost at the end of the 2010-11 school year.
In the 2011-12 school year, East Lycoming School District received a $7,856,350, allocation, of state Basic Education Funding.[255][256] Additionally, the East Lycoming School District received $103,862 in Accountability Block Grant funding. The enacted Pennsylvania state Education budget included $5,354,629,000 for the 2011-2012 Basic Education Funding appropriation. This amount was a $233,290,000 increase (4.6%) over the enacted State appropriation for 2010-2011.[257] The highest increase in state basic education funding was awarded to Duquesne City School District, which got a 49% increase in state funding for 2011-12.[258] In 2010, East Lycoming School District reported that 502 students received free or reduced-price lunches, due to the family meeting the federal poverty level.[259]
For 2010–11 school year, East Lycoming School District received a 2% increase in state Basic Education Funding (BEF) resulting in a $8,344,845 payment.[260] The highest increase awarded to a Lycoming County public school district went to Loyalsock Township School District which received an 8.13% increase in BEF from the state. Kennett Consolidated School District in Chester County received the highest increase in the state at 23.65% increase in funding for the 2010–11 school year. One hundred fifty school districts received the base 2% increase in 2010–11. Fifteen (15) Pennsylvania public school districts received a BEF increase of greater than 10%. The state's hold harmless policy regarding state basic education funding continued where each district received at least the same amount as it received the prior school year, even when enrollment had significantly declined. The amount of increase each school district received was set by Governor Edward Rendell and then Secretary of Education Gerald Zahorchak, as a part of the state budget proposal given each February. This was the second year of Governor Rendell's policy to fund some districts at a far greater rate than others.[261]
In the 2009–10 budget year, the Commonwealth of Pennsylvania provided a 4.14% increase in Basic Education funding for a total of $8,181,370 to East Lycoming School District. The District also received supplemental funding for English language learners, Title 1 federal funding for low-income students, for district size, a poverty supplement from the commonwealth and more.[262] Loyalsock Township School District received a 5.94% increase, the highest increase in Lycoming County for the 2009–10 school year. Among the 500 school districts in Pennsylvania, Muhlenberg School District in Berks County received the highest with a 22.31% increase in funding.[263] According to the U.S. Census Bureau, Pennsylvania spent $7,824 Per Pupil in the year 2000. This amount increased up to $12,085 by the year 2008.[264][265]
The state Basic Education Funding to the East Lycoming School District in 2008–09 was $7,856,350.05. According to the Pennsylvania Department of Education, 455 district students received free or reduced-price lunches due to low family income in the 2007–2008 school year.[266]
Accountability Block Grants
Beginning in 2004–2005, the state launched the Accountability Block Grant school funding. This program has provided $1.5 billion to Pennsylvania's school districts. The Accountability Block Grant program requires that its taxpayer dollars are focused on specific interventions that are most likely to increase student academic achievement. These interventions include teacher training, all-day kindergarten, lower class size K–3rd grade, literacy and math coaching programs that provide teachers with individualized job-embedded professional development to improve their instruction, before or after school tutoring assistance to struggling students. For 2010–11, the East Lycoming School District applied for and received $281,908 in addition to all other state and federal funding. The East Lycoming School District used the funding to provide full-day kindergarten for the 6th year, for teacher coaching in teaching reading and math; and for before/after school tutoring for struggling students.[267][268]
Ready to Learn grant
Beginning in the 2014-15 budget, the State funded a new Ready to Learn Grant for public schools. A total of $100 million is allocated through a formula to districts based on the number of students, level of poverty of community as calculated by its market value/personal income aid ratio (MV/PI AR) and the number of English language learners. Ready to Learn Block Grant funds may be used by the Districts for: school safety; Ready by 3 early childhood intervention programs; individualized learning programs; and science, technology, engineering and math (STEM) programs.[269]
East Lycoming School District received $209,970 in Ready to Learn Grant dollars in addition to State Basic Education funding, Special Education funding, PreK Counts funding, transportation reimbursement, reimbursement for Social Security payments for employees and other state grants which the district must apply to receive. For 2016-17, East Lycoming received $267,638 in Ready to Learn funding.
PreK Counts grant
East Lycoming School District receives state funding to provide preschool at the elementary schools. For the 2011 school year, Pre-K Counts was funded at the 2010 levels of $83.6 million statewide in Gov. Tom Corbett's proposed budget,. The state also supplements the federal Head Start preschool program with an additional $37.6 million. Pre-K Counts funding was initiated during the Rendell administration. In 2007-08 the state funded Pre-K Counts at $75 million. East Lycoming School District received funding in 2007-08.[270] In 2009-10, the District received $156,527 to provide preschool to 53 children.[271][272]
Classrooms for the Future grant
The Classroom for the Future state program provided districts with hundreds of thousands of extra state funding to buy laptop computers for each core curriculum high school class (English, Science, History, Math) and paid for teacher training to optimize the computers use. The program was funded from 2006–2009. East Lycoming School District did not apply for funding in 2006–07. In 2007–08 the district received $95,032. For the 2008–09, school year the district received $45,413 for a total of $140,445. Of the 501 public school districts in Pennsylvania, 447 of them received Classrooms for the Future grant awards.[273] In Lycoming County the highest award was given to Jersey Shore Area School District which received $428,436. The highest funding statewide was awarded to Philadelphia City School District in Philadelphia County - $9,409,073. In 2010, Classrooms for the Future funding was curtailed by Governor Rendell due to a massive state financial crisis.
Science It's Elementary grant
George Ferrell Elementary School successfully applied to participate and received a Science It's Elementary grant in 2008-09. For the 2008-09 school year, the program was offered in 143 schools reaching 2,847 teachers and 66,973 students across Pennsylvania.[274] In 2007, the Pennsylvania Department of Education initiated an effort to improve science instruction in the Commonwealth's public elementary schools. Called Science: It's Elementary, the program is a hands on instruction approach for elementary science classes that develops problem-solving and critical thinking skills.[275] To encourage schools to adopt the program's standards aligned curriculum, the state provided a grant to cover the costs of materials and extensive mandatory teacher training.[276] The district was required to develop a three-year implementation plan for the participating school. They had to appoint a district liaison who was paid $3000 by PDE to serve as the conduit of all information between the district and the Department and its agents along with submitting orders and distributing supplies to implementing teachers. For the 2006-07 state education budget, $10 million was allocated. The 2006-07 State Education Budget provided $635 million in new spending for pre-K through 12th grades for the 2006-07 school year. This marks an 8-percent increase over 2005-06 public school funding.[277] The grant program was expanded to $14.5 million in the 2008-09 budget. In 2010, Science It's Elementary funding was eliminated by Governor Rendell in the budget process.
Project 720
Project 720 was a high school reform program implemented for three years under the Rendell administration. The intent was to increase academic rigor and improve the instruction of teachers in the Commonwealth's high schools. Teachers were expected to use data driven instructional practices and to meet the needs of diverse learners.[278] The 720 in the name referred to the number of days a student was in high school in ninth through 12th grades.[279] High schools applied for funding and were required to agree to report to the PDE their plans, their actions and the outcomes. In 2007-08 budget year, the Commonwealth provided $11 million in funding. East Lycoming School District was one of 161 PA public school districts to apply, receiving $68,000 funding each year for three years.[280][281] For 2010-11, Project 720 funding was decreased to $1.7 million by Governor Rendell. The grant program was discontinued effective with the 2011-12 state budget.[282]
Other grants
East Lycoming School District did not participate in: Pennsylvania Department of Environmental Protection's Environmental Education annual grants,[283][284] Education Assistance Grants, 2012 Striving Readers Comprehensive Literacy grant,[285] 2012 and 2013 Pennsylvania Hybrid Learning Grants,[286] nor the federal 21st Century Learning grants.
Energy Project
East Lycoming School District received a $1,000,000 grant for a solar PV project at the high school campus. East Lycoming School District's system is projected to produce 600-kilowatts.[287] The solar field will supply fifty percent of the school district's electric power over a course of one year saving the district $150,000 in electric costs. Payback for the 2500 panel project is estimated at 9 years.[288] The entire project totaled $3.9 million. PP&L contributed $1.4 million and East Lycoming School District paid $2.5 million with one million dollars coming from the American Recovery Reinvestment Act, a one-time federal grant.
Federal grants
The East Lycoming School District received an extra $1,102,064 in ARRA—Federal Stimulus money to be used in specific programs like special education and meeting the academic needs of low-income students.[289] The funding was limited to the 2009-10 and 2010-2011 school years.[290] Due to the temporary nature of the funding, schools were repeatedly advised to use the funds for one-time expenditures like acquiring equipment, making repairs to buildings, training teachers to provide more effective instruction or purchasing books and software.
Race to the Top grant
East Lycoming School District officials applied for the Race to the Top federal grant which would have brought the district hundreds of thousands in additional federal dollars for improving student academic achievement.[291] Participation required the administration, the school board and the local teachers' union to sign an agreement to prioritize improving student academic success. In Pennsylvania, 120 public school districts and 56 charter schools agreed to participate.[292] Pennsylvania was not approved for the grant. The failure of districts to agree to participate was cited as one reason that Pennsylvania was not approved.[293]
English language learners grant
The Federal government provides annual grants to schools to assist in educating immigrant children and children who are identified as limited English proficient.[294] Upon registering for school a language survey is done for all new enrollment pupils, typically in kindergarten or preschool. They identify the primary language spoken at home. This data is collected and submitted to the Pennsylvania Department of Education, which in turn notifies the federal government.[295]
In 2012-13, East Lycoming School District received $543 in Title III funding for English language learners.[296]
Common Cents state initiative
The East Lycoming School Board did not participate in the Pennsylvania Department of Education Common Cents program. The program called for the state to audit the district, at no cost to local taxpayers, to identify ways the district could save tax dollars.[297] After the review of the information, the district was not required to implement the recommended cost savings changes.
Real estate taxes
Property tax rates in 2016-17 were set by the East Lycoming School Board at 13.0600 mills.[298] A mill is $1 of tax for every $1,000 of a property's assessed value. Irregular property reassessments have become a serious issue in the commonwealth as it creates a significant disparity in taxation within a community and across a region. Property taxes, in the Commonwealth of Pennsylvania, apply only to real estate - land and buildings. The property tax is not levied on cars, business inventory, or other personal property. Certain types of property are exempt from property taxes, including: places of worship, places of burial, private social clubs, charitable and educational institutions and all government property (local, state and federal). Additionally, service related, disabled US military veterans may seek an exemption from paying property taxes. Unlike other states, under Pennsylvania state tax policy, natural gas and oil pipelines are exempted from property taxes.[299] There are a plethora of gas pipelines in the District due to marcellus shale gas development.[300] Pipeline companies prohibit development within the 100 foot wide right-of-way, there by limiting future development options for the landowner. This limits future potential property tax revenues for the school district, by constraining future land development. Located in the marcellus shale region, East Lycoming School District is adversely impacted this way.[301][302][303][304][305]
Pennsylvania school district revenues are dominated by two main sources: 1) Property tax collections, which account for the vast majority (between 75-85%) of local revenues; and 2) Act 511 tax collections, which are around 15% of revenues for school districts.[306] When a Pennsylvania public school district includes municipalities in two counties, each of which has different rates of property tax assessment, a state board equalizes the tax rates between the counties.[307] In 2010, miscalculations by the State Tax Equalization Board (STEB) were widespread in the Commonwealth and adversely impacted funding for many school districts, including those that did not cross county borders.[308]
The average yearly property tax paid by Lycoming County residents amounts to about 3.53% of their yearly income. Lycoming County ranked 364th out of the 3143 United States counties for property taxes as a percentage of median income.[320] According to a report prepared by the Pennsylvania Department of Education, the total real estate taxes collected by all school districts in Pennsylvania rose from $6,474,133,936 in 1999-00 to $10,438,463,356 in 2008-09 and to $11,153,412,490 in 2011.[321] Property taxes in Pennsylvania are relatively high on a national scale. According to the Tax Foundation, Pennsylvania ranked 11th in the U.S. in 2008 in terms of property taxes paid as a percentage of home value (1.34%) and 12th in the country in terms of property taxes as a percentage of income (3.55%).[322]
Act 1 Adjusted index
The Act 1 of 2006 Index regulates the rates at which each school district can raise property taxes in Pennsylvania. Districts are not authorized to raise taxes above that index unless they allow voters to vote by referendum, or they seek an exception from the state Department of Education. The base index for the 2011-2012 school year is 1.4 percent, but the Act 1 Index can be adjusted higher, depending on a number of factors, such as property values and the personal income of district residents. Act 1 included 10 exceptions, including: increasing pension costs, increases in special education costs, a catastrophe like a fire or flood, increase in health insurance costs for contracts in effect in 2006 or dwindling tax bases. The base index is the average of the percentage increase in the statewide average weekly wage, as determined by the PA Department of Labor and Industry, for the preceding calendar year and the percentage increase in the Employment Cost Index for Elementary and Secondary Schools, as determined by the Bureau of Labor Statistics in the U.S. Department of Labor, for the previous 12-month period ending June 30. For a school district with a market value/personal income aid ratio (MV/PI AR) greater than 0.4000, its index equals the base index multiplied by the sum of .75 and its MV/PI AR for the current year.[323] In June 2011, the Pennsylvania General Assembly eliminated six exceptions to the Act 1 Index.[324] Several exceptions were maintained: 1) costs to pay interest and principal on indebtedness incurred prior to September 4, 2004 for Act 72 schools and prior to June 27, 2006 for non-Act 72 schools; 2) costs to pay interest and principal on electoral debt; 3) costs incurred in providing special education programs and services (beyond what is already paid by the State); and 4) costs due to increases of more than the Index in the school's share of payments to PSERS (PA school employees pension fund) taking into account the state mandated PSERS contribution rate.[325][326]
The School District Adjusted Index for the East Lycoming School District 2006-2007 through 2010-2011.[327]
For the 2016-17 budget year, East Lycoming School Board apply for an exception to exceed the District's Act 1 Index limit due to rising teacher pension costs.[338] Statewide 299 school districts adopted a resolution to not exceed their Act I index in 2016-17.
For the 2015-16 budget year, East Lycoming School Board again applied for two exceptions to exceed their Act 1 Index limit: for increasing special education cost and for sharply escalating teacher pension costs. For the school budget 2015-16, 310 Pennsylvania public school districts adopted a resolution certifying that tax rates would not be increased above its Act 1 Index limit. Another 187 school districts adopted a preliminary budget leaving open the option of exceeding the Index limit. Regarding the pension costs exception, 172 school districts received approval to exceed the Index limit in full, while others received a partial approval of their request. For special education costs, 119 districts received approval to exceed their tax limit. No Pennsylvania public school districts received an approval for the grandfathered construction debts exception.[339]
For the 2014-15 budget year, East Lycoming School Board applied for two exceptions to exceed their Act 1 Index limit: special education costs and escalating teacher pension costs. In 2014-15, all Pennsylvania school districts were required to make a 21.4% of payroll payment to the teacher's pension fund (PSERS).[340] For the school budget 2014-15, 316 Pennsylvania public school districts adopted a resolution certifying that tax rates would not be increased above its Act 1 Index limit. Another 181 school districts adopted a preliminary budget leaving open the option of exceeding the Index limit. Districts may apply for multiple exceptions each year. For the pension costs exception, 163 school districts received approval to exceed the Index in full, while others received a partial approval of their request. For special education costs, 104 districts received approval to exceed their tax limit. Seven Pennsylvania public school districts received an approval for the grandfathered construction debts exception.[341]
For the 2013-14 budget year, East Lycoming School Board did not apply for exceptions to exceed the Act 1 Index. For 2013-2014, 311 Pennsylvania public school districts adopted a resolution certifying that tax rates would not be increased above their index; 171 school districts adopted a preliminary budget leaving open the option of exceeded the Index limit. For the exception for pension costs, 89 school districts received approval to exceed the Index in full while others received a partial approval of their request. For special education costs, 75 districts received approval to exceed the tax limit. For the exception for pension costs, 169 school districts received approval to exceed the Index. Eleven districts received an approval for grandfathered construction debts.[342]
For the 2012-13 budget year, East Lycoming School Board applied for 3 exceptions to exceed the Act 1 Index: teacher pensions, special education costs and School Construction Grandfathered Debt. The PDE did not approve the special education costs exception. The District was one of 3 districts statewide to be denied the special education exception. For 2012-2013, 274 school districts adopted a resolution certifying that tax rates would not be increased above their index; 223 school districts adopted a preliminary budget leaving open the option of exceeded the Index limit. For the exception for pension costs, 194 school districts received approval to exceed the Index. For special education costs, 129 districts received approval to exceed the tax limit.[343]
For the 2011-12 school year, the East Lycoming School Board applied for an exception to exceed the Act 1 Index due to anticipated pension costs. Each year the East Lycoming School Board has the option of adopting either 1) a resolution in January certifying they will not increase taxes above their index or 2) a preliminary budget in February. A school district adopting the resolution may not apply for referendum exceptions or ask voters for a tax increase above the inflation index. A specific timeline for these decisions is publisher each year by the Pennsylvania Department of Education.[344]
According to a state report, for the 2011-2012 school year budgets, 247 school districts adopted a resolution certifying that tax rates would not be increased above their index; 250 school districts adopted a preliminary budget. Of the 250 school districts that adopted a preliminary budget, 231 adopted real estate tax rates that exceeded their index. Tax rate increases in the other 19 school districts that adopted a preliminary budget did not exceed the school district's index. Of the districts who sought exceptions 221 used the pension costs exemption and 171 sought a Special Education costs exemption. Only 1 school district sought an exemption for Nonacademic School Construction Project, while 1 sought an exception for Electoral debt for school construction.[345]
East Lycoming School Board did not apply for exceptions to exceed the Act 1 index for the budgets in 2009-10 or in 2010–11.[346] In the Spring of 2010, 135 Pennsylvania school boards asked to exceed their adjusted index. Approval was granted to 133 of them and 128 sought an exception for pension costs increases.[347]
Property tax relief
In 2016, East Lycoming School District's Tax Relief funded by gambling of $173 was approved for 3,089 homesteads and farmsteads. In 2013, the District's Tax Relief funded by gambling was $172. In 2009, the Homestead/Farmstead Property Tax Relief from gambling for the East Lycoming School District was $176 per approved permanent primary residence. In the district, 3,025 property owners applied for the tax relief.[348] The tax relief was subtracted from the total annual school property on the individual's tax bill. Property owners apply for the relief through the county Treasurer's office. Farmers can qualify for a farmstead exemption on building used for agricultural purposes. The farm must be at least 10 contiguous acres (40,000 m2) and must be the primary residence of the owner. Farmers can qualify for both the homestead exemption and the farmstead exemption. The Pennsylvania Auditor General found that 69% of property owners applied for tax relief in Lycoming County.[349] In Lycoming County, the highest property tax relief in 2009 was $310 awarded to the approved property owners in Williamsport Area School District. Pennsylvania awarded the highest property tax relief to residents of the Chester-Upland School District in Delaware County at $632 per homestead and farmstead in 2010.[350] This was the second year Chester Upland School District was the top recipient.
Additionally, the Pennsylvania Property Tax/Rent Rebate program is provided for low income Pennsylvanians aged 65 and older; widows and widowers aged 50 and older; and people with disabilities age 18 and older. The income limit is $35,000 for homeowners. The maximum rebate for both homeowners and renters is $650. Applicants can exclude one-half (1/2) of their Social Security income, consequently individuals who have income substantially more than $35,000, may still qualify for a rebate. Individuals must apply annually for the rebate. This can be taken in addition to Homestead/Farmstead Property Tax Relief.[351]
Enrollment and consolidation
East Lycoming School District is experiencing low enrollment in K-12. Adding publicly funded preschool raised enrollment slightly. In 2013, enrollment was 1,673 pupils (preschool-12).[352] The Pennsylvania Department of Education projects the district's enrollment will remain low through 2018.[353] Shifting population trends across the U.S. and Pennsylvania are affecting school enrollment and may impact the building needs of school districts in the years to come.[354] From 2000 to 2010, rural Pennsylvania school enrollment decreased by 8 percent. The most significant enrollment decline was in western Pennsylvania, where rural public school districts had a 16 percent decline. More than 40 percent of elementary schools and more than 60 percent of secondary schools in western Pennsylvania experienced significant enrollment decreases (15 percent or greater).[355]
A study done by Standard and Poors in 2007 (at the request of the PA General Assembly) examined the East Lycoming School District consolidating with neighboring Muncy School District. The study found a combined district savings of over $2 million in 2004.[356]
As a part of the study, superintendents were asked about savings, if their district were to merge with another district at the administrative level only, but not close any of their schools. It found 42% of the respondents believed consolidation would achieve cost reductions. Additionally, 63% of responding superintendents believed that consolidation with another district would help provide additional academic enrichment opportunities for the students.[357]
In 2011, the Pennsylvania Institute of Certified Public Accountants released their findings on government efficiency - "Report of the Fiscal Responsibility Task Force, January 2011". It found that one area of inefficiency and redundancy in Pennsylvania government is the administration of the educational system. It noted that the state could achieve savings exceeding $1.5 billion a year, by reducing the number of district administrations by 50% to 250 from 500. The report emphasized that this modification would not change the number of schools or teachers in classrooms.[358]
Pennsylvania has one of the highest numbers of public school districts in the nation. in 2013, Pennsylvania has 500 public school districts and Lycoming County has 11 full or partial public school districts. In Pennsylvania, 80% of the school districts serve student populations under 5,000, and 40% serve less than 2,000. Less than 95 of Pennsylvania's 501 school districts have enrollment below 1250 students, in 2007.[359]
Extracurriculars
East Lycoming School District offers a variety of clubs, activities and an extensive, costly sports program. Eligibility for participation is determined by school board policy. In cases where the student is failing more than one course with a credit value of .5 or greater or one course with a credit value greater than 2.0 at the end of the marking period, the student shall be ineligible for twenty school days for the next grading period. Students being pulled out of classes for band and/or chorus lessons must have at least a 75% average in that class to be allowed to go the lesson/practice.
East Lycoming School District participates in the Pennsylvania Heartland Athletic Conference and the Pennsylvania Interscholastic Athletic Association.[360] The Pennsylvania Heartland Athletic Conference is a voluntary association of 25 PIAA High Schools within the central Pennsylvania region.
By Pennsylvania law, all K-12 students residing in the district, including those who attend a private nonpublic school, cyber charter school, charter school and those homeschooled, are eligible to participate in the extracurricular programs, including all athletics. They must meet the same eligibility rules as the students enrolled in the district's schools.[361]
According to Pennsylvania Child Abuse Recognition and Reporting Act 126 of 2014, all volunteer coaches and all those who assist in student activities, must have criminal background checks. Like all school district employees, they must also attend an anti child abuse training once every three years.[362][363][364]
Sports
Coaches receive compensation as outlined in the teachers' union contract. When athletic competition exceeds the regular season, additional compensation is paid.[365]
East Lycoming School District does not provide its athletics disclosure form on its web site in violation of state law.[366] Article XVI-C of the Public School Code requires the disclosure of interscholastic athletic opportunities for all public secondary school entities in Pennsylvania. All school entities with grades 7-12 are required to annually collect data concerning team and financial information for all male and female athletes beginning with the 2012-13 school year and submit the information to the Pennsylvania Department of Education. Beginning with the 2013-14 school year, all non-school (booster club and alumni) contributions and purchases must also be reported to PDE.[367]
According to Pennsylvania's Safety in Youth Sports Act, all sports coaches, paid and volunteer, are required to annually complete the Concussion Management Certification Training and present the certification before coaching.[368][369]
The District funds:
|
|
- Junior high school sports
|
|
According to PIAA directory July 2015 [370]
References
- ↑ Maroney, Mark (May 27, 2011). "East Lycoming hires superintendent". Sun Gazette.
- ↑ National Center of Education Statistics (2015). "Common Core of Data - East Lycoming School District".
- ↑ Pennsylvania Department of Education (October 14, 2016). "East Lycoming School District Profile - District Fast Facts 2016".
- ↑ Pennsylvania Department of Education (November 4, 2015). "East Lycoming School District Profile - District Fast Facts 2015".
- ↑ Pennsylvania Department of Education, East Lycoming School District Profile - District Fast Facts, October 2013
- ↑ Pennsylvania Department of Education, East Lycoming School District Enrollment and projections, 2010
- ↑ Pennsylvania Department of Education, East Lycoming School District Enrollment by LEA 2005-06, 2005
- ↑ Pennsylvania Department of Education, East Lycoming School District Enrollment by LEA 2004-05, 2004
- ↑ East Lycoming School Board Secretary, 2016-17 Final General Fund Budget, May 24, 2016
- ↑ Williamsport Sun Gazette, East Lycoming OKs tax raise, June 19, 2013
- ↑ US Census Bureau, 2010 Census Poverty Data by Local Educational Agency, 2011
- ↑ proximityone (2014). "School District Comparative Analysis Profiles".
- ↑ Pennsylvania Budget and Policy Center, Education Facts Student Poverty Concentration by LEA, 2012
- ↑ US Census Bureau, American Fact Finder, 2009
- ↑ US Census Bureau (2010). "American Fact Finder, State and County quick facts".
- ↑ US Census Bureau (September 2011). "Income, Poverty, and Health Insurance Coverage in the United States: 2010" (PDF).
- ↑ Michael Sauter; Alexander E.M. Hess (August 31, 2013). "America's most popular six-figure jobs". USA Today.
- ↑ proximityone (2014). "School District Comparative Analysis Profiles".
- ↑ Pennsylvania Public School Code Governance 2010
- ↑ US Department of Education (2015). "Every Student Succeeds Act".
- ↑ Pennsylvania General Assembly (2012). "Act of Jul. 12, 2012, P.L. 1142, No. 141 Section 921-A".
- ↑ Pennsylvania General Assembly, Pennsylvania School Code, 2013
- ↑ Pennsylvania General Assembly (2012). "Act of Jul. 12, 2012, P.L. 1142, No. 141".
- ↑ Ballotpedia (July 26, 2013). "The Pennsylvania Project".
- ↑ Pittsburgh Business Times (April 12, 2016). "Chester County district leads statewide Honor Roll 2016".
- ↑ Pittsburgh Business Times (April 6, 2012). "Guide to Pennsylvania Schools Statewide ranking".
- ↑ Pittsburgh Business Times (April 5, 2012). "Statewide Honor Roll Rankings 2012".
- ↑ Paul Jablow (November 18, 2015). "Understanding the PSSA exams". The Notebook.
- ↑ Pittsburgh Business Times (April 10, 2015). "Guide to Pennsylvania Schools Statewide School District Ranking 2015".
- ↑ Pittsburgh Business Times (April 11, 2014). "School guide offers vital insights".
- ↑ "Statewide Honor Roll Rankings 2013". Pittsburgh Business Times. April 5, 2013.
- ↑ Pittsburgh Business Times, Statewide Honor Roll Rankings 2012, April 4, 2012
- ↑ Pittsburgh Business Times (April 4, 2011). "Statewide Honor Roll 2011".
- ↑ Pittsburgh Business Times (May 1, 2010). "Statewide Honor Roll".
- ↑ "Three of top school districts in state hail from Allegheny County". Pittsburgh Business Times. May 23, 2007.
- ↑ "Overachiever statewide ranking". Pittsburgh Business Times. May 6, 2010.
- ↑ "2009 PSSA RESULTS East Lycoming School District". The Morning Call. March 2011.
- ↑ Pennsylvania Department of Education (September 21, 2011). "East Lycoming School District AYP Status".
- ↑ Pennsylvania Department of Education, East Lycoming School District AYP Status, September 29, 2011
- ↑ Pennsylvania Department of Education, Pennsylvania Public School District AYP History, 2011
- ↑ Pennsylvania Department of Education, Pennsylvania District AYP History 2003-2010, 2011
- ↑ Pennsylvania Department of Education (October 14, 2016). "Hughesville Junior Senior High School graduation rate 2016".
- ↑ Pennsylvania Department of Education (November 4, 2015). "Hughesville Junior Senior High School graduation rate".
- ↑ Pennsylvania Department oF Education (September 21, 2012). "EAST LYCOMING SD - District AYP Data Table 2012".
- ↑ Pennsylvania Department of Education, EAST LYCOMING School District AYP Data Table 2011, September 29, 2011
- ↑ Pennsylvania Department of Education (March 15, 2011). "New 4-year Cohort Graduation Rate Calculation Now Being Implemented".
- ↑ Pennsylvania Department of Education, East Lycoming School District Academic Achievement Report Card 2010 data table March 8, 2011
- ↑ Pennsylvania Department of Education, East Lycoming School District Academic Achievement Report Card 2009 data table, September 2009
- ↑ The Times-Tribune (June 25, 2009). "Lycoming County Graduation Rates 2008".
- ↑ Pennsylvania Partnerships for Children (2008). "High School Graduation rate 2007" (PDF).
- ↑ Pennsylvania Department of Education (November 4, 2015). "Hughesville Junior Senior High School Fast Facts 2015".
- ↑ US News and World Report, Best High Schools, 2015
- ↑ US News and World Report, Best High Schools, 2013
- ↑ East Lycoming School District Administration. "Hughesville Junior Senior High School".
- ↑ Pennsylvania Department of Education (September 29, 2016). "2016 PSSA AND KEYSTONE Results".
- ↑ Pennsylvania Department of Education (August 2016). "Findings and Recommendations Pursuant to Act 1 of 2016" (PDF).
- ↑ Jan Murphy (October 16, 2016). "How District schools fared overall".
- ↑ Pennsylvania Department of Education (November 4, 2015). "High School School Performance Profile 2015".
- ↑ Jan Murphy (November 4, 2015). "Report card for state's high schools show overall decline". Pennlive.com.
- ↑ Pennsylvania Department of Education (November 4, 2015). "2015 Keystone Exam School Level Data".
- ↑ Pennsylvania Department of Education (November 6, 2014). "Hughesville Junior Senior High School Academic Performance Data 2013-14".
- ↑ Evamarie Socha (November 6, 2014). "Half of Valley districts see state test scores decline". The Daily Item.
- ↑ Eleanor Chute (November 21, 2014). "Pennsylvania student scores declined with reduced funding, test results show". Pittsburgh Post-Gazette.
- ↑ Acting Secretary of Education Carolyn Dumaresq, Acting Secretary of Education Announces Results of 2013-14 School Performance Profile; Strong Performance in 72 Percent of Schools, November 6, 2014
- ↑ Kathy Boccella; Dylan Purcell; Kristen A. Graham (November 6, 2014). "Pa. school rankings: Downingtown STEM No. 1; Phila. falters". Philadelphia Inquirer.
- ↑ Jan Murphy (November 6, 2014). "More Pa. school scores decline than improve, state report card shows". Pennlive.com.
- ↑ Pennsylvania Department of Education (October 4, 2013). "Hughesville Junior Senior High School Academic Performance Data 2013".
- ↑ Pennsylvania Department of Education (September 21, 2012). "Hughesville Junior High School AYP Overview 2012,".
- ↑ Pennsylvania Department of Education, Hughesville Junior High School AYP Overview 2011, September 29, 2011
- ↑ Pennsylvania Department of Education (2014). "State Academic Standards".
- ↑ Pennsylvania Department of Education (2014). "State Assessment System".
- ↑ Pennsylvania Department of Education (September 29, 2011). "2010-2011 PSSA and AYP Results".
- ↑ "2010 PSSAs: Reading, Math, Writing and Science Results".
- ↑ Pennsylvania Department of Education (September 14, 2010). "2009 PSSAs: Reading, Math, Writing and Science Results".
- ↑ "The 2008 PSSA Mathematics and Reading School Level Proficiency Results (by Grade and School Total)". August 2008.
- ↑ Pennsylvania Department of Education (2007). "PSSA Math and Reading results by School and Grade 2007".
- ↑ Pennsylvania Department of Education (September 29, 2011). "Hughesville Junior Senior High School Academic Report Card 2011" (PDF).
- ↑ Pennsylvania Department of Education (March 8, 2011). "Hughesville Junior Senior High School Academic Achievement Report Card 2010".
- ↑ Pennsylvania Department of Education, Hughesville Junior Senior High School Academic Report Card 2009, September 14, 2009
- ↑ "Math PSSA Scores by District 2007–08 East Lycoming School District Results". The Times-Tribune. June 25, 2009.
- ↑ Pennsylvania Department of Education, Hughesville Junior Senior High School Academic Report Card 2007, 2007
- ↑ The Pennsylvania Basic Education/Higher Education Science and Technology Partnership, Science in Motion annual report, 2012
- ↑ Pennsylvania Department of Education (January 2009). "Pennsylvania College Remediation Report".
- ↑ National Center for Education Statistics
- ↑ Pennsylvania Department of Education (2015). "SAT and AP Scores 2015".
- ↑ College Board, SAT 2015 Total Group report Pennsylvania, 2016
- ↑ PDE, Hughesville Junior Senior High School Performance profile, November 6, 2014
- ↑ Pennsylvania Department of Education (2014). "SAT and ACT Scores".
- ↑ College Board (2014). "2014 College-Bound Seniors State Profile Report" (PDF).
- ↑ College Board (2013). "The 2013 SAT Report on College & Career Readiness".
- ↑ Pennsylvania Department of Education (2011). "Public School SAT Scores 2011".
- ↑ College Board (September 2011). "SAT Scores State By State - Pennsylvania".
- ↑ "While U.S. SAT scores dip across the board, N.J. test-takers hold steady". September 2011.
- ↑ Pennsylvania Department of Education (September 29, 2016). "2016 PSSA AND KEYSTONE Results".
- ↑ Pennsylvania Department of Education (October 1, 2015). "2015 PSSA School Level Data".
- ↑ Pennsylvania Department of Education (October 1, 2015). "2015 PSSA State Level Data".
- ↑ Pennsylvania Department of Education (May 11, 2014). "IU16-PSSA 95-96 Results by School".
- ↑ Pennsylvania Department of Education (2014). "Standards Aligned Systems".
- ↑ Pennsylvania Department of Education (2014). "State Academic Standards".
- ↑ Pennsylvania Department of Education (2014). "State Academic Standards Mathematics".
- ↑ Pittsburgh Post Gazette (October 15, 2012). "How is your school doing?".
- ↑ Pennsylvania Department of Education, Hughesville Junior Senior High School Academic Achievement Report Card 2010, September 14, 2010
- ↑ Pennsylvania Department of Education (February 2011). "PSSA Math and Reading Results 2007".
- ↑ Pennsylvania Department of Education (September 21, 2012). "Hughesville Junior High School Academic Achievement Report Card 2012" (PDF).
- ↑ Pennsylvania Department of Education (February 2011). "PSSA Results Math and Reading School 2008".
- ↑ Pennsylvania Department of Education (February 2011). "PSSA Science results 2008-09".
- ↑ Pennsylvania Department of Education (February 2011). "Science Results by School and Grade 2008".
- ↑ Office of First Lady (September 2, 2014). "Pennsylvania First Lady and Acting Secretary of Education Announce 35 Schools Statewide Implementing Dropout Program".
- ↑ Pennsylvania Department of Education (2014). "The Early Warning System".
- ↑ Pennsylvania Department of Education (November 4, 2015). "Ashkar Elementary School Fast Facts 2015".
- ↑ Pennsylvania Department of Education, School Performance Profile, Ashkar Elementary School Fast Facts, 2015
- ↑ National Center for Education Statistics, Common Core Data – Joseph C. Ashkar Elementary School, 2011
- ↑ Pennsylvania Department of Education, Professional Qualifications of Teachers Joseph C. Ashkar Elementary School, September 21, 2012
- ↑ Pennsylvania Partnership for Children, Full-Day Kindergarten Enrollment, 2010
- ↑ East Lycoming School District. Ashkar Elementary School. "http://www.eastlycoming.net/53876071275115/site/default.asp"
- ↑ Pennsylvania Department of Education, 2016 PSSA AND KEYSTONE Results, September 29, 2016
- ↑ Jan Murphy (September 29, 2016). "Standardized test scores show Pa. schools have more work to do". Pennlive.com.
- ↑ Pennsylvania Department of Education (October 1, 2015). "2015 PSSA School Level Data".
- ↑ Pennsylvania Department of Education (October 1, 2015). "2015 PSSA State Level Data".
- ↑ Pennsylvania Department of Education (November 6, 2014). "Ashkar Elementary School Academic Performance Data 2014".
- ↑ Pennsylvania Department of Education (October 4, 2013). "Ashkar Elementary School Academic Performance Data 2013".
- ↑ Pennsylvania Department of Education (September 29, 2011). "Joseph C. Ashkar Elementary School AYP Overview".
- ↑ Pennsylvania Department of Education (September 29, 2011). "Joseph C. Ashkar Elementary School AYP Data Table".
- ↑ Pennsylvania Department of Education (September 21, 2012). "J. C. Ashkar Elementary School Academic Achievement Report Card 2012" (PDF).
- ↑ Pennsylvania Department of Education, J. C. Ashkar Elementary School Academic Achievement Report Card 2010, October 20, 2010
- ↑ Pennsylvania Department of Education, J. C. Ashkar Elementary School Academic Achievement Report Card 2009, September 14, 2009
- ↑ Pennsylvania Department of Education, J. C. Ashkar Elementary School Academic Achievement Report Card 2010, October 20, 2010
- ↑ Pennsylvania Department of Education (November 4, 2015). "Ferrell Elementary School Fast Facts 2015".
- ↑ Pennsylvania Department of Education, School Performance Profile, Elementary School Fast Facts, 2015
- ↑ National Center for Education Statistics, Common Core Data – George A Ferrell Elementary School, 2011
- ↑ Pennsylvania Department of Education, Professional Qualifications of Teachers George A Ferrell Elementary School, September 21, 2012
- ↑ Pennsylvania Partnership for Children, Full-Day Kindergarten Enrollment, 2010
- ↑ Pennsylvania Department of Education, 2016 PSSA AND KEYSTONE Results, September 29, 2016
- ↑ Jan Murphy (September 29, 2016). "Standardized test scores show Pa. schools have more work to do". Pennlive.com.
- ↑ Pennsylvania Department of Education (October 1, 2015). "2015 PSSA School Level Data".
- ↑ Pennsylvania Department of Education (October 1, 2015). "2015 PSSA State Level Data".
- ↑ Pennsylvania Department of Education (November 6, 2014). "Ferrell Elementary School Academic Performance Data 2014".
- ↑ Pennsylvania Department of Education (October 4, 2013). "George A Ferrell Elementary School Academic Performance Data 2013".
- ↑ Pennsylvania Department of Education, George A Ferrell Elementary School AYP Overview 2012, September 21, 2012
- ↑ Pennsylvania Department of Education (September 21, 2012). "George A. Ferrel Elementary School Academic Achievement Report Card 2012," (PDF).
- ↑ Pennsylvania Department of Education, George A. Ferrel Elementary School Academic Achievement Report Card 2009, September 15, 2009
- ↑ Pennsylvania Department of Education, George A. Ferrel Elementary School Academic Achievement Report Card 2011, September 29, 2011
- ↑ Pennsylvania Department of Education, George A. Ferrel Elementary School Academic Achievement Report Card 2010, October 20, 2010
- ↑ Pennsylvania Department of Education (November 4, 2015). "Renn Elementary School Fast Facts 2015".
- ↑ Pennsylvania Department of Education, School Performance Profile, Elementary School Fast Facts, 2015
- ↑ National Center for Education Statistics, Common Core Data – Carl G. Renn Elementary School, 2011
- ↑ Pennsylvania Department of Education, Professional Qualifications of Teachers Carl G. Renn Elementary School, September 21, 2012
- ↑ Pennsylvania Partnership for Children, Full-Day Kindergarten Enrollment, 2010
- ↑ Pennsylvania Department of Education, 2016 PSSA AND KEYSTONE Results, September 29, 2016
- ↑ Jan Murphy (September 29, 2016). "Standardized test scores show Pa. schools have more work to do". Pennlive.com.
- ↑ Pennsylvania Department of Education (October 1, 2015). "2015 PSSA School Level Data".
- ↑ Pennsylvania Department of Education (November 6, 2014). "Carl G. Renn Elementary School Academic Performance Data 2014".
- ↑ Pennsylvania Department of Education (October 4, 2013). "Carl G. Renn Elementary School Academic Performance Data 2013,".
- ↑ Pennsylvania Department of Education (September 21, 2012). "Carl G. Renn Elementary School AYP Overview 2012".
- ↑ Pennsylvania Department of Education (September 29, 2011). "Carl G. Renn Elementary School AYP Data Table".
- ↑ Pennsylvania Department of Education, Carl G. Renn Elementary School Report Card 2010, October 20, 2010
- ↑ Pennsylvania Department of Education, Carl G. Renn Elementary School Report Card 2009, September 15, 2009
- ↑ Pennsylvania Department of Education, Carl G. Renn Elementary School Report Card 2008, August 15, 2008
- ↑ Pennsylvania Department of Education (September 21, 2012). "Renn Elementary School Academic Achievement Report Card 2012" (PDF).
- ↑ Pennsylvania Bureau of Special Education Services (2015). "East Lycoming School District Special Education Data Report LEA Performance on State Performance Plan (SPP) Targets".
- ↑ Pennsylvania Bureau of Special Education (December 1, 2013). "East Lycoming School District Special Education Data Report LEA Performance on State Performance Plan (SPP) Targets School Year 2013–2014".
- ↑ Pennsylvania Bureau of Special Education (January 31, 2011). "East Lycoming School District Special Education Data Report LEA Performance on State Performance Plan (SPP) Targets School Year 2008–2009".
- ↑ Gerald L. Zahorchak, D. Ed. (May 30, 2007). "House Education Committee Hearing on Governor's Proposed Increase for Accountability Block Grants Testimony for Gerald L. Zahorchak, D. Ed. Secretary, Pennsylvania Department of Education" (PDF).
- ↑ East Lycoming School District (2010–2011). "East Lycoming School District Special Education Department - Annual Public Notice of Special Education Services".
- ↑ Education Law Center (2012). "Key Timelines in the School-Age Special Education System" (PDF).
- ↑ Eleanor Chute., Modified PSSA test in math offered for 1st time, Pittsburgh Post-Gazette, April 18, 2010
- ↑ "PSSA and Keystone Exam Accommodation Guidelines for Students with IEPs and 504 Plans". 2015.
- ↑ Pennsylvania Department of Education (December 12, 2014). "PSSA/ Keystone Accommodations Guidelines (PDE) 2015".
- ↑ Pennsylvania Department of Education. "Pennsylvania Special Education Funding".
- ↑ Browne, Patrick., Senate Education Committee Hearing on Special Education Funding & Accountability testimony, November 1, 2011
- ↑ Kintisch, Baruch., Public Hearing: Special Education Funding & Accountability Testimony, Education Law Center, November 11, 2011
- ↑ Amy Morton, Executive Deputy Secretary, Public Hearing: Special Education Funding & Accountability Testimony, Pennsylvania Department of Education, November 11, 2011
- ↑ US Department of Education (January 25, 2013). "U.S. Department of Education Clarifies Schools' Obligation to Provide Equal Opportunity to Students with Disabilities to Participate in Extracurricular Athletics".
- ↑ Pennsylvania Department of Education (July 2010). "Special Education Funding from Pennsylvania State_2010-2011".
- ↑ Pennsylvania Department of Education (2011). "Special Education Funding 2011-2012 Fiscal Year".
- ↑ Pennsylvania Department of Education, Investing in PA kids, April 2012
- ↑ Pennsylvania Department of Education, Special Education funding report by LEA, July 2014
- ↑ Pennsylvania Department of Education, BEF, Special Education Funding, RTL Grants 2016-17, July 2016
- ↑ Special Education Funding Reform Commission (December 11, 2015). "Special Education Funding Reform Commission Report" (PDF).
- ↑ Pennsylvania Department of Education (December 1, 2009). "Gifted Students as Percentage of Total Enrollment by School District/Charter School" (PDF).
- ↑ "East Lycoming Gifted Support Education".
- ↑ Pennsylvania Department of Education and Pennsylvania School Board (February 4, 2011). "CHAPTER 16. Special Education For Gifted Students".
- ↑ Pennsylvania Department of Education (September 21, 2011). "More Than 100 Entities Sign Up to Participate in Teacher and Principal Evaluation Pilot Program".
- ↑ Mason, Angie., Educators: New teacher evaluation system is a lot of talk -- but so far that's good, "The York Daily Record, April 29, 2012
- ↑ Center for Safe Schools (2013). "School Safety Report 2013-14" (PDF).
- ↑ Commonwealth of Pennsylvania Safe School Center (2012). "Pennsylvania Safe Schools Online Reports".
- ↑ Safe & Responsive Schools Project (June 20, 2011). "Area high school students create anti-bullying mural". Williamsport Sun Gazette.
- ↑ Pennsylvania Office of Safe Schools (February 8, 2011). "East Lycoming School District School Safety Annual Report 2008–2009" (PDF).
- ↑ "Pennsylvania Safe Schools Online Reports". February 2011.
- ↑ East Lycoming School District Administration (March 2010). "East Lycoming School District Bullying/Cyberbullying Policy 249".
- ↑ "Regular Session 2007-2008 House Bill 1067, Act 61 Section 6 page 8".
- ↑ "Center for Safe Schools of Pennsylvania, Bullying Prevention advisory". January 2011.
- ↑ Pennsylvania Department of Education. "Pennsylvania Academic Standards".
- ↑ Pennsylvania General Assembly, Taxpayer Relief Act, Act 1 of the Special Session of 2006, June 27, 2006
- ↑ Pennsylvania Department of Education (2014). "Investing in Pennsylvania Students 2014".
- ↑ Times Tribune (June 16, 2013). "PA Teacher Profile Database 2011-12".
- ↑ Triblive News (2015). "Pennsylvania teacher salary search".
- ↑ Pennsylvania School Employees Retirement System (2014). "Your PSERS Benefits & Leaving Employment".
- ↑ American Enterprise Institute, (2011). "Assessing the Compensation of Public School Teachers".
- ↑ Pennsylvania School Board Association (February 27, 2015). "Pension, PSERS Background Basics".
- ↑ PSERS Board of Trustees (2015). "Fiscal Year 2015/2016 Employer Contribution Rate" (PDF).
- ↑ Pennsylvania Department of Education, Investing in Pennsylvania Students 2013, June 2013
- ↑ "East Lycoming School District Payroll report 2011". OpenPA Gov.org. 2013.
- ↑ Pennsylvania Department of Education (2012). "Investing in Pennsylvania Students".
- ↑ American Enterprise Institute (2011). "Assessing the Compensation of Public School Teachers".
- ↑ "Pa. Public School Salaries, 2009". Asbury Park Press. March 2011.
- ↑ "East Lycoming School Payroll report". openpagov. March 1, 2011.
- ↑ Teachers need to know enough is enough, PaDelcoTimes, April 20, 2010.
- ↑ "East Lycoming School District Teachers Union Employment Contract 2011".
- ↑ "Legislature must act on educators' pension hole.". The Patriot News. February 21, 2010.
- ↑ Fenton, Jacob., Average classroom teacher salary in Lycoming County, 2006–07., The Morning Call, March 2011
- ↑ Fenton, Jacob., Pennsylvania School District Data: Will School Consolidation Save Money?, The Morning Call, February 2009
- ↑ Pennsylvania School Board Association (October 2009). "Public School Salaries 11th Annual".
- ↑ "Per Pupil Spending in Pennsylvania Public Schools in 2008 Sort by Administrative Spending".
- ↑ Pennsylvania Department of Education (2010). "2009-10 Selected Data - 2009-10 Total Expenditures per ADM".
- ↑ US Census Bureau, States Ranked According to Per Pupil Public Elementary-Secondary School System Finance Amounts: Fiscal Year 2011, May 2013
- ↑ US Census Bureau (2009). "Total and current expenditures per pupil in fall enrollment in public elementary and secondary education, by function and state or jurisdiction: 2006-07".
- ↑ US Census Bureau (March 2003). "Public Education Finances 2000-01 Annual Survey of Local Government Finances" (PDF).
- ↑ United States Census Bureau (2009). "States Ranked According to Per Pupil Elementary-Secondary Public School System Finance Amounts: 2008-09" (PDF).
- ↑ US Census Bureau (May 2013). "States Ranked According to Per Pupil Public Elementary-Secondary School System Finance Amounts: Fiscal Year 2011" (PDF).
- ↑ Pennsylvania Department of Education. "Fund Balances by Local Education Agency 1997 to 2008".
- ↑ Pennsylvania Department of Education, Finances General Fund Reserves by LEA, 2014
- ↑ Murphy, Jan., Pennsylvania's public schools boost reserves, CentreDaily Times, September 22, 2010
- ↑ Melissa Daniels (June 1, 2013). "PA school districts look to cash stash to balance budgets". PA Independent.
- ↑ Jan Murphy (August 18, 2014). "School district reserves rise despite $1 billion cut in state aid". Pennlive.com.
- ↑ Commonwealth Foundation (May 17, 2012). "Chart: School District Fund Balances Nearly Tripled in 14 Years".
- ↑ "East Lycoming School DistrictI Lycoming County, PENNSYLVANIA PERFORMANCE AUDIT REPORT" (PDF). January 2010.
- ↑ "EAST LYCOMING SCHOOL DISTRICT LYCOMING COUNTY, PENNSYLVANIA PERFORMANCE AUDIT REPORT" (PDF). March 2013.
- ↑ Pennsylvania Auditor General Office (January 15, 2015). "Performance Audit East Lycoming School District" (PDF).
- ↑ Pennsylvania Department of Education (May 2012). "Pennsylvania Public School District Tuition Rates".
- ↑ Municipal and School District Tax Office, Income tax reporting form, 2012
- ↑ Pennsylvania Department of Revenue (October 2010). "Personal Income Tax Information".
- ↑ John Finnerty., PA teachers pensions, CNHI Harrisburg Bureau, April 23, 2013
- ↑ Herald-Mail Media (February 24, 2016). "Kauffman law exempts military pay from Pa. earned-income taxes".
- ↑ Myle Snyder (February 23, 2016). "Gov. Wolf signs bill to exempt active duty military pay from local tax". ABC27 News.
- ↑ Pennsylvania Representative Todd Stephens (January 23, 2014). "LEEF Funding Chart 2014".
- ↑ Basic Education Funding Commission, Commission minutes, 2016
- ↑ York Dispatch, Governor Wolf Signs Fair Funding Formula, June 2016
- ↑ Pennsylvania General Assembly (June 2016). "House Bill 1552, Act 35 of 2016".
- ↑ Pennsylvania Department of Eductaion, Education Budget 2016-17, July 2016
- ↑ PDE, Special Education Funding fiscal year 2016-17, July 2017
- ↑ PA Office of Budget, Commonwealth 2016-17 Enacted Budget Line-Item Appropriations, July 2016
- ↑ Jan Murphey (January 4, 2016). "Here's the payout your school district gets from the partial 2015-16 state budget". Pennlive.com.
- ↑ Jennifer Wakeman (January 4, 2016). "Harrisburg releases $3.3 billion in delayed funds".
- ↑ Pennsylvania General Assembly (June 26, 2015). "Basic Education Funding Commission".
- ↑ Jan Murphy (January 6, 2016). "School funding distribution gives rise to new battle between Wolf, GOP lawmakers". PennLive.com.
- ↑ Pennsylvania Department of Education (January 2016). "Summary of State Appropriations for Education 2015-2016 Fiscal Year Education Budget".
- ↑ Jan Murphy (April 15, 2016). "House, Senate cast veto-proof majority votes on school funding bill". Pennlive.com.
- ↑ PDE, Ed Budget 2015-16 , May 2016
- ↑ PDE (July 7, 2014). "Enacted Education Budget 2014-2015".
- ↑ Pennsylvania Department of Education, 2014-15 Enacted Education Budget Fast Facts, July 14, 2014
- ↑ Pennsylvania Office of the Budget, 2013-14 State Budget Highlights, 2013
- ↑ Senator Jake Corman (June 28, 2012). "Pennsylvania Education funding by Local School District" (PDF).
- ↑ Pennsylvania General Assembly Sen Jake Corman (June 29, 2012). "SB1466 of 2012 General Fund Appropriation".
- ↑ PA Senate Appropriations Committee (June 28, 2011). "School District 2011-12 Funding Report".
- ↑ Pennsylvania Department of Education (July 2011). "Basic Education Funding".
- ↑ Pennsylvania Department of Education (June 30, 2011). "Basic Education Funding".
- ↑ Pennsylvania Department of Education (June 30, 2011). "Basic Education Funding 2011-2012 Fiscal Year".
- ↑ Pennsylvania Department of Education, District Allocations Report 2009, 2009-10
- ↑ Pennsylvania House Appropriations Committee (August 2010). "PA House Appropriations Committee Basic Education Funding-Printout2 2010-2011" (PDF).
- ↑ Pennsylvania Office of Budget (February 2010). "Pennsylvania Budget Proposal,".
- ↑ Pennsylvania Department of Education (October 2009). "Basic Education Funding by School District 2009–10".
- ↑ "Pennsylvania Department of Education Report on Funding by school district". October 2009.
- ↑ U.S. Census Bureau., Annual Survey of Local Government Finances., 2000
- ↑ U.S. Census Bureau., 2008 Survey of Local Government Finances – School Systems, 2010
- ↑ Pennsylvania Department of Education Funding Report by LEA 2009.
- ↑ Pennsylvania Department of Education. "Accountability Block Grant report 2010, Grantee list 2010".
- ↑ Pennsylvania Department of Education. "Accountability Block Grant Mid Year report".
- ↑ Pennsylvania Department of Education (2013). "Passport for Learning Block Grant".
- ↑ Governor's Press Office (August 10, 2007). "Governor Rendell Announces Grants for 'Pre-K Counts' Early Childhood Initiative".
- ↑ Pennsylvania Department of Education (2010). "Pennsylvania PreK Counts End of Year Report 2009-10" (PDF).
- ↑ Office of Child Development and Early Learning (2009). "Early Childhood Programs - PreK Counts".
- ↑ Pennsylvania Auditor General (2008-12-22). "Special Performance Audit Classrooms For the Future grants" (PDF).
- ↑ Pennsylvania Department of Education, Science: It's Elementary Grantees Students in 143 Schools Benefit from Intensive Science Curriculum, July 22, 2008
- ↑ Patricia Vathis Pennsylvania Department of Education, Grants and Subsidies Science: It's Elementary, 2006
- ↑ Pennsylvania Department of Education, 2010 – 2011 Science: It's Elementary Application Guidelines, July 2010
- ↑ Pennsylvania Department of Education, Governor Rendell Commends Teachers for Enhancing Science Education in Pennsylvania, August 10, 2006
- ↑ CAIU 15 (2007). "Project 720".
- ↑ PSEA (2006). "Project 720 PDE Education Improvement Initiative Series" (PDF).
- ↑ Pennsylvania Department of Education (2007). "Transforming Pennsylvania High Schools".
- ↑ Robert Hayes Postupac, PROJECT 720: A CASE STUDY OF HIGH SCHOOL REFORM, University of Pittsburgh, 2011
- ↑ PA Office of the Budget, 2011-12 Budget General Fund - State Appropriations, June 28, 2011
- ↑ Department of Environmental Protection (2014). "Environmental Education Grants".
- ↑ Pennsylvania Department of Environmental Protection (April 22, 2013). "Governor Corbett Awards 92 Grants for Environmental Education and Stewardship".
- ↑ Pennsylvania Department of Education (May 23, 2012). "Pennsylvania Awards $36.1 Million to Strengthen Literacy Programs".
- ↑ Pennsylvania Department of Education Press Office (October 17, 2013). "Acting Secretary of Education Says Hybrid Learning Benefits Students; Highlights Success of First-Year Pilot Program".
- ↑ Barrett, Barbara., East Lycoming School District begins solar power usage, The Luminary, June 1, 2011
- ↑ Barrett, Barbara., Solar shines on East Lycoming School District, The Luminary, April 24, 2011
- ↑ Commonwealth of Pennsylvania (February 2011). "Lycoming County ARRA FUNDING Report".
- ↑ "School stimulus money". Pittsburgh Post-Gazette. March 12, 2009.
- ↑ Pennsylvania Department of Education Press Release (January 2009). "Pennsylvania's 'Race to the Top' Fueled by Effective Reforms, Strong Local Support".
- ↑ Pennsylvania's 'Race to the Top' Fueled by Effective Reforms, Strong Local Support
- ↑ U.S. Department of Education (March 29, 2010). "Race to the Top Fund,".
- ↑ US Department of Education (September 15, 2004). "Title III — Language Instruction for Limited English Proficient and Immigrant Students".
- ↑ PDE, English As A Second Language (ESL), 2015
- ↑ PDE (2015). "Title III Supplemental Program".
- ↑ Pennsylvania Department of Education (February 1, 2011). "Common Cents program - Making Every Dollar Count".
- ↑ PDE (October 2016). "Finances RE Tax Rates 2016-17".
- ↑ Katie Colaneri (June 11, 2015). "New pipeline could mean tax bonanza for NJ towns, but for Pa.? Not so much". State Impact NPR.org.
- ↑ Penn State Extension (2012). "Marcellus Shale Gas Development: What Does It Mean for Pennsylvania Schools?".
- ↑ The Nature Conservancy – Pennsylvania Chapter, Natural Gas Pipelines Pennsylvania Energy Impacts Assessment, December 16, 2011
- ↑ The Nature Conservancy, Marcellus Shale Gas Development in Bradford County, December 16, 2011
- ↑ TIMOTHY PUKO (December 11, 2011). "Shale gas pipelines pose challenges to state's forests, wildlife". TribLive.com.
- ↑ Lancaster Online, Gas line explosion in Lycoming County involves pipeline owned by same company that wants to build in Lancaster County, June 10, 2015
- ↑ Schmid & Company, Inc., Consulting Ecologists (January 23, 2014). "Natural Gas Pipelines in Lycoming County, Pennsylvania" (PDF).
- ↑ Pennsylvania Department of Education (2004). "Act 511 Tax Report".
- ↑ State Tax Equalization Board (2011). "State Tax Equalization Board About US".
- ↑ Pennsylvania Auditor General office - Bureau of Audits (February 2011). "A Special Performance Audit of the Pennsylvania State Tax Equalization Boards" (PDF).
- ↑ PDE (October 2015). "Finances RE Tax Rates 2014-15".
- ↑ Secretary of East Lycoming School District (June 2014). "East Lycoming Board Meeting Minutes May 6, 2014".
- ↑ Pennsylvania Department of Education, Finances_Real Estate Tax Rates 2013-14, July 2013
- ↑ Pennsylvania Department of Education, Finances_Real Estate Tax Rates 2012-2013, July 2012
- ↑ Pennsylvania Department of Education (2011). "Real Estate Tax Millage by School District,".
- ↑ Pennsylvania Department of Education, Finances_Real Estate Tax Rates 2010–11, 2010
- ↑ Pennsylvania Department of Education, Financial Elements Reports, 2010
- ↑ Pennsylvania Department of Education, Financial Elements Reports 2008-09 Real Estate Mills, 2009
- ↑ Pennsylvania Department of Education, Real Estate Tax Millage by School District, 2008
- ↑ Pennsylvania Department of Education, Real Estate Tax Millage by School District, 2006
- ↑ Pennsylvania Department of Education (2005). "Real Estate Tax Millage by School District,".
- ↑ Tax-rates.org., The 2013 Tax Resource County Property Taxes 2012, 2012
- ↑ Pennsylvania Department of Education, Pennsylvania School Finances - Summaries of Annual Financial Report Data 2010-11, 2011
- ↑ New Census Data on Property Taxes on Homeowners, Tax Foundation, September 22, 2009.
- ↑ Pennsylvania Department of Education 2010–11 Act 1 of 2006 Referendum Exception Guidelines.
- ↑ Kaitlynn Riely (August 4, 2011). "Law could restrict school construction projects". Pittsburgh Post-Gazette.
- ↑ Pennsylvania General Assembly (June 29, 2011). "SB330 of 2011".
- ↑ Eric Boehm (July 1, 2011). "Property tax reform final piece of state budget". PA Independent.
- ↑ Pennsylvania Department of Education (May 2010). "Special Session Act 1 of 2006 School District Adjusted Index for 2006-2007 through 2011-2012".
- ↑ Pennsylvania Department of Education (May 2011). "Special Session Act 1 of 2006 School District Adjusted Index for 2006-2007 through 2011-2012".
- ↑ Pennsylvania Department of Education, 2007-2008 School District Adjusted Index, September 2006
- ↑ Pennsylvania Department of Education, 2008-2009 School District Adjusted Index, September 2007
- ↑ Pennsylvania Department of Education, 2009-2010 School District Adjusted Index, September 2008
- ↑ Pennsylvania Department of Education, 2012-2013 School District Adjusted Index, September 2011
- ↑ Pennsylvania Department of Education, 2013-2014 School District Adjusted Index, May 2012
- ↑ Pennsylvania Department of Education, 2014-2015 School District Adjusted Index, September 2013
- ↑ Pennsylvania Department of Education, 2015-2016 School District Adjusted Index, September 2014
- ↑ Pennsylvania Department of Education (September 5, 2015). "2016-2017 School District Adjusted Index,".
- ↑ Pennsylvania Department of Education (2015). "Property Tax Relief".
- ↑ Pennsylvania Department of Education (April 2016). "Report on Referendum Exceptions For School Year 2016-2017" (PDF).
- ↑ Pennsylvania Department of Education (April 2015). "Taxpayer Relief Act Special Session Act 1 of 2006 Report on Referendum Exceptions For School Year 2015-2016" (PDF).
- ↑ Pennsylvania School Employees, Retirement System, PSERS Chart showing payment mandates 2007-2020, 2014
- ↑ Pennsylvania Department of Education (April 30, 2014). "Report on Referendum Exceptions For School Year 2014-2015".
- ↑ Pennsylvania Department of Education, Report on Referendum Exceptions For School Year 2013-2014, April 2013
- ↑ Pennsylvania Department of Education, Report on Referendum Exceptions For School Year 2012-2013, March 30, 2012
- ↑ Pennsylvania Department of Education (2011). "Special Session Act 1 of 2006 the Taxpayer Relief Act information".
- ↑ Pennsylvania Department of Education (April 2011). "Report on Exceptions".
- ↑ Pennsylvania Department of Education (April 2010). "Pennsylvania SSAct1_Act1 Exceptions Report 2010-2011 April 2010".
- ↑ Scarcella, Frank; Pursell, Tricia (May 25, 2010). "Local school tax assessments exceed state averages". The Daily Item.
- ↑ Pennsylvania Department of Education (May 2009). "Estimated Tax Relief Per Homestead and Farmstead May 1, 2009" (PDF).
- ↑ Pennsylvania Auditor General Office, (2010-02-23). "Special Report Pennsylvania Property Tax Relief,".
- ↑ Pennsylvania Department of Education, (May 2010). "Tax Relief per Homestead 5-1-10. Report".
- ↑ Pennsylvania Department of Education. "Property Tax/Rent Rebate Program".
- ↑ Pennsylvania Department of Education, East Lycoming School District - District Fast Facts, 2013
- ↑ Pennsylvania Department of Education (January 2009). "Enrollment and Projections.".
- ↑ Research Analyzes Rural School District Enrollment and Building Capacity
- ↑ The Center for Rural Pennsylvania, "Research Analyzes Rural School District Enrollment and Building Capacity", October 2009.
- ↑ Standard and Poors (2007). "Pennsylvania Legislative Budget and Finance Committee Study - Study of the Cost-Effectiveness of Consolidating Pennsylvania School Districts part 2" (PDF).
- ↑ Standard and Poors (2007). "Pennsylvania Legislative Budget and Finance Committee Study - Study of the Cost-Effectiveness of Consolidating Pennsylvania School Districts part 1" (PDF).
- ↑ Efficiency & Streamlining State Government. Report of the PICPA Fiscal Responsibility Task Force, Pennsylvania Institute of Certified Public Accountants, January 2011, pp 7–8.
- ↑ Pennsylvania Legislative Budget and Finance Committee, Study of the Cost Effectiveness of Consolidating Pennsylvania School Districts, 2007.
- ↑ "Pennsylvania Heartland Athletic Conference School list". 2012.
- ↑ Pennsylvania Office of the Governor Press Release, (November 10, 2005). "Home-Schooled, Charter School Children Can Participate in School District Extracurricular Activities".
- ↑ Eleanor Chute., New Pa. law expands clearance requirements for school volunteers, employees, Pittsburgh Post-Gazette, December 15, 2014
- ↑ Pennsylvania General Assembly (2014). "ACT 126 – Child Abuse Recognition and Reporting Act".
- ↑ Ali Stevens., Child Protective Services Law impacts schools, WKOK.com 1070AM, January 6, 2015
- ↑ East Lycoming School Board, East Lycoming School District Teacher Union Contract, 2014
- ↑ East Lycoming School District Administration (2015). "East Lycoming School District Athletics".
- ↑ Pennsylvania Department of Education (2013). "Interscholastic Athletic Opportunities Disclosure Form" (PDF).
- ↑ PA General Assembly (July 1, 2012). "Senate Bill 200 of Session 2011 Safety in Youth Sports Act".
- ↑ UMPC Sports Medicine (2014). "Managing Concussions in Student Athletes: The Safety in Youth Sports Act".
- ↑ Pennsylvania Interscholastic Athletics Association (2015). "PIAA School Directory".
External links
Lycoming County, Pennsylvania Schools | |||||||||||||||||||||||||||||||||
|---|---|---|---|---|---|---|---|---|---|---|---|---|---|---|---|---|---|---|---|---|---|---|---|---|---|---|---|---|---|---|---|---|---|
| |||||||||||||||||||||||||||||||||
| |||||||||||||||||||||||||||||||||