Loyalsock Township School District
| Loyalsock Township School District | |
|---|---|
 | |
| Address | |
|
1720 Sycamore Road Montoursville, Pennsylvania, Lycoming 17754 United States | |
| Information | |
| Type | Public |
| School board | 9 elected members |
| Superintendent |
Mr Gerald L McLaughlin (contract July 1, 2014 to June 30, 2017)[1] salary $123,000 (2014) former Robert Grantier $131,994 (2013)salary $140,000 in 2013[2] (salary $126,250 in 2012)[3] |
| Administrator |
M. Daniel Egly, Business Manager |
| Director | Mr. Ronald Insinge, Athletic Director |
| Principal | Dr. Matthew Reitz, HS |
| Principal | Mr. Robert Gaetano, MS |
| Principal | Mrs. Suzanne Foresman, ES salary $88,000 (2014) |
| Staff | 127 non teaching staff members[4] |
| Faculty | 95 teachers (2012), 98 teachers (2011)[5] |
| Grades | K-12th |
| Age | 5 years old to 21 years old (special education) |
| Pupils |
665 (Elementary)
371 (Middle School) 469 (High School)
Total 1,505 pupils (2016),[6] |
| • Kindergarten | 111 (2016)[7] |
| • Grade 1 | 95 (2016) |
| • Grade 2 | 94 (2016) |
| • Grade 3 | 118 (2016) |
| • Grade 4 | 107 (2016) |
| • Grade 5 | 130 (2016) |
| • Grade 6 | 103 (2016 |
| • Grade 7 | 124 (2016 |
| • Grade 8 | 129 (2016) |
| • Grade 9 | 129 (2016) |
| • Grade 10 | 139 (2016) |
| • Grade 11 | 105 (2016) |
| • Grade 12 | 96 (2016) |
| • Other | Enrollment projected to decline to 1,200 pupils through 2020 |
| Language | English |
| Budget |
$20,338,486 (2014-2015)[8] |
| Tuition | for nonresident and charter school students ES - $7,801, HS - $9,747 [12] |
| Per pupil spending | $12,468 (2008) |
| Per pupil spending | $12,562.34 (2010) |
| Website | http://www.ltsd.k12.pa.us/ltsd/site/default.asp |
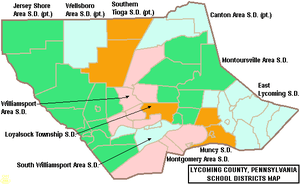
The Loyalsock Township School District is a small, suburban public school district in Lycoming County, Pennsylvania, in the United States. The District is one of the 500 public school districts of Pennsylvania. The district serves Loyalsock Township, a suburb of Williamsport. Loyalsock Township School District encompasses approximately 21 square miles (54 km2). According to 2000 federal census data, it served a resident population of 10,876. By 2010, the District's population increased to 11,029 people.[13] The educational attainment levels for the Loyalsock Township School District population (25 years old and over) were 91% high school graduates and 27.6% college graduates.[14]
The Loyalsock Township School District residents' per capita income in 2009 was $23,480, while the median family income was $47,952.[15] In the Commonwealth, the median family income was $49,501 [16] and the United States median family income was $49,445, in 2010.[17] By 2013, the median household income in the United States rose to $52,100.[18]
Loyalsock Township School District reported an enrollment of 1,471 pupils through the employment of 104 teachers, 93 full-time and part-time support personnel, and eleven (11) administrators during the 2011-12 school year. The District received $4,995,076 in state funding in the 2011-12 school year. According to District officials, in school year 2007-08, the Loyalsock Township School District provided basic educational services to 1,430 pupils. It employed: 105 teachers, 48 full-time and part-time support personnel and 10 administrators.
The District operates three schools: Donald E. Schick Elementary, Loyalsock Township Middle School, and Loyalsock Township High School. High school students may choose to attend Lycoming Career and Technical Center for training in the construction and mechanical trades, child care, allied health services and culinary arts. The BLaST Intermediate Unit IU17 provides the District with a wide variety of services like: specialized education for disabled students; impaired hearing, speech and visual disability services and professional development for staff and faculty.
Governance
The Loyalsock Township School District is governed by 9 individually elected board members (serve without compensation for a term of four years), the Pennsylvania State Board of Education, the Pennsylvania Department of Education and the Pennsylvania General Assembly.[19] The federal government controls programs it funds like: Title I funding for low income children in the Elementary and Secondary Education Act and the No Child Left Behind Act, which mandates the district focus resources on student success in acquiring reading and math skills. The Superintendent and Business Manager are appointed by the school board. The Superintendent is the chief administrative officer with overall responsibility for all aspects of operations, including education and finance. The Business Manager is responsible for budget and financial operations. Neither of these officials are voting members of the School Board. The School Board enters into individual employment contracts for these positions. In Pennsylvania, public school districts are required to give 150 days notice to the Superintendent regarding renewal of the employment contract.[20] In 2014, Mr. Gerald Mclaughlin was appointed as the Superintendent of Schools.
Academic achievement
Loyalsock Township School District ranked 117th out of 496 Pennsylvania public school districts, by the Pittsburgh Business Times.[21] The ranking is based on the last 3 years of student academic achievement as demonstrated by PSSAs results in: reading, writing, math and science and the three Keystone Exams (literature, Algebra 1, Biology I) in high school.[22] Three school districts were excluded because they do not operate high schools (Saint Clair Area School District, Midland Borough School District, Duquesne City School District). The PSSAs are given to all children in grades 3rd through 8th. Adapted PSSA examinations are given to children in the special education programs. Writing exams were given to children in 5th and 8th grades.[23]
- 2013 - 113th[24]
- 2012 - 109th[25]
- 2011 - 97th[26]
- 2010 - 92nd[27]
- 2009 - 100th
- 2008 - 90th
- 2007 - 87th out of 501 Pennsylvania school districts.[28]
In 2009, the academic achievement of the students in the Loyalsock Township School District was in the 75th percentile among all 500 Pennsylvania school districts Scale (0-99; 100 is state best).[29]
District AYP status history
In 2012, Loyalsock Township School District achieved (Adequate Yearly Progress (AYP) status.[30] In 2011, Loyalsock Township School District achieved Adequate Yearly Progress (AYP). In 2011, 94 percent of the 500 Pennsylvania public school districts achieved the No Child Left Behind Act progress level of 72% of students reading on grade level and 67% of students demonstrating on grade level math. In 2011, 46.9 percent of Pennsylvania school districts achieved Adequate Yearly Progress (AYP) based on student performance. An additional 37.8 percent of Pennsylvania public school districts made AYP based on a calculated method called safe harbor, 8.2 percent on the growth model and 0.8 percent on a two-year average performance.[31] School District achieved AYP status each year from 2004 to 2009, while in 2003 Loyalsock Township District was in Warning status due to lagging student achievement.[32]
Graduation rate
In 2013, Loyalsock Township School District's graduation rate was 92.5%.[33] In 2012, Loyalsock Township School District's graduation rate was 88%.[34] In 2011, the graduation rate was 92%.[35] In 2010, the Pennsylvania Department of Education issued a new, 4-year cohort graduation rate. School District's rate was 90% for 2010.[36]
- Former calculation graduation rate
High school
Loyalsock Township High School is located at 1801 Loyalsock Drive, Williamsport. In 2013, enrollment was reported as 464 pupils in 9th through 12th grades, with 26% of pupils eligible for a free lunch due to family poverty. Additionally, 14% of pupils received special education services, while 4.3% of pupils were identified as gifted. The school employed 32 teachers.[41] Per the PA Department of Education, 100% of the teachers were rated "Highly Qualified" under the federal No Child Left Behind Act.
According to the National Center for Education Statistics, in 2010, the school reported an enrollment of 443 pupils in grades 9th through 12th, with 71 pupils eligible for a federal free or reduced-price lunch. The school employed 32 teachers, yielding a student–teacher ratio of 13:1.[42] According to a report by the Pennsylvania Department of Education, 100% of its teachers were rated "Highly Qualified" under No Child Left Behind.[43]
US News and World Report rating In 2014, Loyalsock Township High School was recognized by US News and World Report as a Silver level high school in a nationwide school ranking. Among Pennsylvania high schools (traditional, charter and private) 56 achieved gold or silver medals. Another 103 high schools achieved bronze rating out of 698 Pennsylvania high schools reviewed.[44]
- 2013 School Performance Profile
Loyalsock Township High School achieved 91.6 out of 100. Reflects on grade level reading, mathematics and science achievement. In reading/literature - 88% of stduents tested were on grade level. In Algebra 1, 77.8% showed on grade level mathematics skills. In Biology, just 66% showed on grade level science understanding.[45] According to the Pennsylvania Department of Education, 2,181 public schools (less than 73 percent of Pennsylvania public schools), achieved an academic score of 70 or higher. Pennsylvania 11th grade students no longer take the PSSAs. Instead, beginning in 2012, they take the Keystone Exams at the end of the associated course.[46]
- PSSA Results
- 11th Grade Reading
- 2012 - 77% on grade level, (% below basic). State - 67% of 11th graders are on grade level.[47]
- 2011 - 81%, 43% advanced, (9% below basic). State - 69.1% [48]
- 2010 - 79%, 47% advanced (14% below basic). State - 66% [49]
- 2009 - 78%, 45% advanced (12% below basic), State - 65% [50]
- 2008 - 74%, 45% advanced (10% below basic), State - 65%[51]
- 2007 - 85%, 52% advanced (9% below basic), State - 65% [52]
- 11th Grade Math
- 2012 - 78% on grade level (6% below basic). In Pennsylvania, 59% of 11th graders are on grade level.[53]
- 2011 - 71%, 39% advanced, (6% below basic). State - 60.3%
- 2010 - 87%, 46% advanced (3% below basic). State - 59% [54]
- 2009 - 71%, 38% advanced (12% below basic). State - 56%[55]
- 2008 - 70%, 40% advanced (12% below basic). State - 56% [56]
- 2007 - 83%, 50% advanced (9% below basic). State - 53%
- 11th Grade Science
- 2012 - 58% on grade level (3% below basic). State - 42% of 11th graders were on grade level.[57]
- 2011 - 60%, (5% below basic). State - 40% [58]
- 2010 - 58%, (12% below basic), State - 39% of 11th graders were on grade level.
- 2009 - 61%, (9% below basic). State - 40%
- 2008 - 52%, (4% below basic). State - 39%
Science in Motion Loyalsock Township High School did not take advantage of a state program called Science in Motion which brought college professors and sophisticated science equipment to the school to raise science awareness and to provide inquiry-based experiences for the students. The Science in Motion program was funded by a state appropriation and cost the school nothing to participate.[59] Susquehanna University provided the science enrichment experiences to schools in the region.
College remediation
According to a Pennsylvania Department of Education study released in January 2009, 5% of Loyalsock Township High School graduates required remediation in mathematics and or reading before they were prepared to take college level courses in the Pennsylvania State System of Higher Education or community colleges.[60] Less than 66% of Pennsylvania high school graduates, who enroll in a four-year college in Pennsylvania, will earn a bachelor's degree within six years. Among Pennsylvania high school graduates pursuing an associate degree, only one in three graduate in three years.[61] Per the Pennsylvania Department of Education, one in three recent high school graduates who attend Pennsylvania's public universities and community colleges takes at least one remedial course in mathematics or English.
SAT scores
In 2013, Loyalsock Township School District students took the SAT exams. The District's Verbal Average Score was 505. The Math average score was 518. The Writing average score was 495. The College Board reported that statewide scores were: 494 in reading, 504 in math and 482 in writing. The nationwide SAT results were the same as in 2012.[62]
In 2012, 94 Loyalsock Township School District students took the SAT exams. The District's Verbal Average Score was 502. The Math average score was 507. The Writing average score was 496. The statewide Verbal SAT exams results were: Verbal 491, Math 501, Writing 480. In the USA, 1.65 million students took the exams achieving scores: Verbal 496, Math 514, Writing 488. According to the College Board the maximum score on each section was 800, and 360 students nationwide scored a perfect 2,400.
In 2011, 81 Loyalsock Township School District students took the SAT exams. The District's Verbal Average Score was 500. The Math average score was 515. The Writing average score was 483.[63] Pennsylvania ranked 40th among states with SAT scores: Verbal - 493, Math - 501, Writing - 479.[64] In the United States, 1.65 million students took the exam in 2011. They averaged 497 (out of 800) verbal, 514 math and 489 in writing.[65]
The Pennsylvania Department of Education compared the SAT data of students in rural areas of Pennsylvania to students in urban areas. From 2003 to 2005, the average total SAT score for students in rural Pennsylvania was 992, while urban students averaged 1,006. During the same period, 28 percent of 11th and 12th graders in rural school districts took the exam, compared to 32 percent of urban students in the same grades. The average math and verbal scores were 495 and 497, respectively, for rural students, while urban test-takers averaged 499 and 507, respectively. Pennsylvania’s SAT composite score ranked low on the national scale in 2004. The composite SAT score of 1,003 left Pennsylvania ranking 44 out of the 50 states and Washington, DC.[66]
The Pennsylvania Department of Education reported that 71 percent of students in rural areas of Pennsylvania chose to continue their education after high school in 2003, whereas 79 percent of urban high school graduates opted to continue their education.
AP Courses
In 2013, Loyalsock Township High School offered 10 Advanced Placement (AP) courses at a higher cost than regular courses. The student pays the fee for the exam which was $89 per test per pupil in 2012. Students have the option of taking College Board approved courses and then taking the College Board's examination in the Spring. Students, who achieve a 3 or better on the exam, may be awarded college credits at US universities and colleges. Each higher education institution sets its own standards about what level of credits are awarded to a student based on their AP exam score. Most higher education give credits for scores of 4 or 5. Some schools also give credits for scores of 3. High schools give credits towards graduation to students who take the school's AP class. At Loyalsock Township High School 83% of students who took an AP course earned a 3 or better on the exam.[67]
ACE
Loyalsock Township School District students have access to Bloomsburg University's Summer College and Advanced College Experience (ACE) during the summer of their sophomore, junior and senior years (after high school graduation). Tuition is deeply discounted to 75% of the regular student rate.[68] Successful students earn college credits that can be transferred to other Pennsylvania public colleges and universities through the Pennsylvania Transfer and Articulation Center (PA TRAC) system.[69]
Middle school
Loyalsock Township Middle School is located at 2101 Loyalsock Dr, Williamsport. In 2013, enrollment was 351 pupils, in grades 6th through 8th, with 29% of pupils eligible for a free lunch due to family poverty. Additionally, 17% of pupils received special education services, while 3.7% of pupils were identified as gifted.[70] According to a 2013 report by the Pennsylvania Department of Education, 100% of its teachers were rated "Highly Qualified" under No Child Left Behind.[71]
According to the National Center for Education Statistics, in 2010, the school reported an enrollment of pupils in grades 6th through 8th, with 85 pupils receiving a federal free or reduced-price lunch due to family poverty. The school employed 26 teachers, yielding a student–teacher ratio of 12:1.[72] According to a report by the Pennsylvania Department of Education, 100% teachers were rated "Highly Qualified" under No Child Left Behind.[73]
- 2013 School Performance Profile
Loyalsock Township Middle School achieved 80.9 out of 100. Reflects on grade level reading, writing, mathematics and science achievement. In reading, just 76% of the students were on grade level. In Mathematics/Algebra 1, 85% of the students showed on grade level skills. In Science, only 75% of the 8th graders demonstrated on grade level understanding. In writing, 80% of the 8th grade students demonstrated on grade level writing skills.[74]
- AYP history
In 2012, Loyalsock Township Middle School declined to Warning Adequate Yearly Progress (AYP) status due to lagging student achievement. In 2011 and 2010, the Middle School achieved AYP status.[75] The attendance rate was 95% in 2011, 2010 - 95% and in 2009 - 96%.[76]
- PSSA history
Sixth and seventh grades have been tested in reading and mathematics since 2006. Eighth graders are tested in: reading, writing, mathematics and Science. Beginning in the Spring of 2013, eighth graders, who are enrolled in Algebra I take the Keystone Exam for Algebra I at the end of the course. The testing of 8th grade in reading and mathematics began in 1999.[77] Testing in science began in 2007. The goal is for 100% of students to be on grade level or better in reading and mathematics, by the Spring of 2014. The tests focus on the state's Academic Standards for reading, writing, mathematics and science.[78] The standards were published in 1998 and are mandated by the Pennsylvania State Board of Education.[79] In 2014, the Commonwealth adopted the Pennsylvania Core Standards - Mathematics.[80]
- 8th Grade Reading
- 2012 - 83% on grade level 53% advanced (10% below basic). In Pennsylvania, 79% of 8th graders on grade level.
- 2011 - 81%, 62% advanced, (6% below basic). State - 81.8%
- 2010 - 88%, 65% advanced (5% below basic). State - 81% [81]
- 2009 - 86%, 66% advanced (9% below basic). State - 80%
- 2008 - 83%, 63% advanced (6% below basic). State - 78%
- 2007 - 86%, 53% advanced (4% below basic). State - 75%[82]
- 8th Grade Math
- 2012 - 89% on grade level 72% advanced (2% below basic). State - 76% [83]
- 2011 - 91%, 60% advanced (3% below basic). State - 76.9%
- 2010 - 88%, 69% advanced (5% below basic). State - 75%
- 2009 - 88%, 66% advanced (5% below basic). State - 71%
- 2008 - 86%, 64% advanced (4% below basic). State - 70% [84]
- 2007 - 84%, 55% advanced (7% below basic). State - 67%
- 8th Grade Science
- 2012 - 65% on grade level (15% below basic). State - 59%
- 2011 - 68% (11% below basic). State – 58.3%
- 2010 - 68%, (17% below basic). State - 57%.
- 2009 - 55%, (17% below basic). State - 54% [85]
- 2008 - 61%, (4% below basic). State - 52% [86]
|
|
|
|
Elementary school
Donald E Shick Elementary School is located at 2800 Four Mile Drive, Montoursville. In 2013, the school's enrollment was 662 pupils in grades kindergarten through 5th, with 31.7% of pupils receiving a federal free or reduced price meals due to family poverty. Additionally, 13% of the pupils receive special education services, while 1.8% are identified as gifted.[87] According to a report by the Pennsylvania Department of Education, 100% of the teachers were rated highly qualified under No Child Left Behind. The School provides full day kindergarten to all pupils.[88] The School is a federally designated Title I school.
According to the National Center for Education Statistics, in 2011, Donald E Shick Elementary School reported an enrollment of 651 pupils in grades kindergarten through 5th, with 200 pupils receiving a federal free or reduced-price lunch due to family poverty. The school employed 40 teachers, yielding a student–teacher ratio of 16:1.[89] According to a report by the Pennsylvania Department of Education, 100% of its teachers were rated "Highly Qualified" under No Child Left Behind.[90]
- 2013 School Performance Profile
Donald E Shick Elementary School achieved a score of 70.3 out of 100. The score reflects on grade level: reading, science, writing and mathematics achievement. In 2012-13, only 72.7% of the students were reading on grade level in grades 3rd through 5th. In 3rd grade, 83% of the pupils were reading on grade level. In math, 80.6% were on grade level (3rd-5th grades). In 4th grade science, 83% of the pupils demonstrated on grade level understanding. In writing, only 57% of 5th grade pupils demonstrated on grade level skills.[91]
- AYP History
In 2010 through 2012, Donald E. Shick Elementary School achieved AYP status.[92] The attendance rate was 95% in 2011 and 96% in 2010.[93]
|
|
|
|
- 4th Grade Science;
- 2012 - 91%, (2% below basic). State - 82%
- 2011 - 88%, (0% below basic). State – 82.9%
- 2010 - 89%, 38% advanced. State - 81%
- 2009 - 92%, 51% advanced. State - 83%
- 2008 - 91%, 42% advanced. State - 81%
|
|
Special education
In December 2010, the district administration reported that 197 pupils or 13% of the district's pupils received special education services, with 67% of the identified students having a specific learning disability. In December 2009, the district administration reported that 211 pupils or 14.9% of the district's pupils received special education services.[100]
The district engages in identification procedures to ensure that eligible students receive an appropriate educational program consisting of special education and related services, individualized to meet student needs. At no cost to the parents, these services are provided in compliance with state and federal law; and are reasonably calculated to yield meaningful educational benefit and student progress. To identify students who may be eligible for special education, various screening activities are conducted on an ongoing basis. These screening activities include: review of group-based data (cumulative records, enrollment records, health records, report cards, ability and achievement test scores); hearing, vision, motor, and speech/language screening; and review by the Instructional Support Team or Student Assistance Team. When screening results suggest that the student may be eligible, the District seeks parental consent to conduct a multidisciplinary evaluation. Parents who suspect their child is eligible may verbally request a multidisciplinary evaluation from a professional employee of the District or contact the Special Education Department.[101]
In 2010, the state of Pennsylvania provided $1,026,815,000 for Special Education services. The funds were distributed to districts based on a state policy which estimates that 16% of the district's pupils are receiving special education services. This funding is in addition to the state's basic education per pupil funding, as well as, all other state and federal funding.[102] The Pennsylvania Special Education funding system assumes that 16% of the district’s students receive special education services. It also assumes that each student’s needs accrue the same level of costs.[103] The state requires each public school district and charter school to have a three-year special education plan to meet the unique needs of its special education students.[104] Overidentification of students, in order to increase state funding, has been an issue in the Commonwealth. Some districts have more than 20% of its students receiving special education services while others have 10% supported through special education.[105]
Loyalsock Township School District received a $687,415 supplement for special education services in 2010.[106] The state funding for the 2012-13 and 2011-12 school years was the same as 2010-11. The enacted state budget included $1,026,815,000, for the 2011-2012 Special Education appropriation.[107]
Gifted education
The District Administration reported that 37 or 2.64% of its students were gifted in 2009.[108] By law, the district must provide mentally gifted programs at all grade levels. The primary emphasis is on enrichment and acceleration of the regular education curriculum through a push in model with the gifted instructor in the classroom with the regular instructor. This approach permits such specialized instructional strategies as tiered assignments, curriculum compacting, flexible grouping, learning stations, independent projects and independent contracts. Students identified as gifted attending the High School have access to honors and advanced placement courses, and dual enrollment with local colleges. The referral process for a gifted evaluation can be initiated by teachers or parents by contacting the student’s building principal and requesting an evaluation. All requests must be made in writing. To be eligible for mentally gifted programs in Pennsylvania, a student must have a cognitive ability of at least 130 as measured on a standardized ability test by a certified school psychologist. Other factors that indicate giftedness will also be considered for eligibility.[109]
School safety and bullying policy
Loyalsock Township School District administration reported there were zero incidents of bullying in the District in 2012. Additionally, there were no sexual incidents involving students. The local law enforcement was involved in four incidents at the schools resulting in four arrests. There were no drug related issues.[110] [111] Each year the school safety data is reported by the district to the Safe School Center which then publishes the compiled reports online. Nationally, nearly 20% of pupils report being bullied at school.[112]
The Loyalsock Township School District administration reported there were no incidents of bullying in the District in 2009. There were two assaults on students. There was one case of possession of an illegal substance. There were nine incidents involving local police, resulting in 10 arrests.[113][114]
In 2007, Loyalsock Township School District administration reported there were no incidents of bullying in the District. There were three cases of possession of a controlled substance. There were four incidents involving local law enforcement, resulting in six arrests.[115]
In 2005, Loyalsock Township School District administration reported there were no incidents of bullying in the District. There were three incidents of possession of a controlled substance. There was on incident involving local law enforcement[116]
The Loyalsock Township School Board has provided the District's antibully policy online.[117] All Pennsylvania schools are required to have an anti-bullying policy incorporated into their Code of Student Conduct. The policy must identify disciplinary actions for bullying and designate a school staff person to receive complaints of bullying. The policy must be available on the school's website and posted in every classroom. All Pennsylvania public schools must provide a copy of its anti-bullying policy to the Office for Safe Schools every year, and shall review their policy every three years. Additionally, the district must conduct an annual review of that policy with students.[118] The Center for Schools and Communities works in partnership with the Pennsylvania Commission on Crime & Delinquency and the Pennsylvania Department of Education to assist schools and communities as they research, select and implement bullying prevention programs and initiatives.[119]
Education standards relating to student safety and antiharassment programs are described in the 10.3. Safety and Injury Prevention in the Pennsylvania Academic Standards for Health, Safety and Physical Education.[120]
Budget
Pennsylvania public school districts budget and expend funds according to procedures mandated by the General Assembly and the Pennsylvania Department of Education (PDE). An annual operating budget is prepared by school district administrative officials. A uniform form is furnished by the PDE and submitted to the board of school directors for approval prior to the beginning of each fiscal year on July 1.
Under Pennsylvania’s Taxpayer Relief Act, Act 1 of the Special Session of 2006, all school districts of the first class A, second class, third class and fourth class must adopt a preliminary budget proposal. The proposal must include estimated revenues and expenditures and the proposed tax rates. This proposed budget must be considered by the Board no later than 90 days prior to the date of the election immediately preceding the fiscal year. The preliminary budget proposal must also be printed and made available for public inspection at least 20 days prior to its adoption. The board of school directors may hold a public hearing on the budget, but are not required to do so. The board must give at least 10 days’ public notice of its intent to adopt the final budget according to Act 1 of 2006.[121]
In 2013, the average teacher salary in Loyalsock Township School District was $58,922 a year, while the cost of the benefits teachers received was $22,735 per employee, for a total annual average teacher compensation of $81,657.[122] The District employed 135 teachers and administrators with a median salary of $60,797 and a top salary of $128,775.[123][124] Coordinator Gerald McLaughlin was paid $106,318, Supervisor Sherry Griggs earned $103,708 and Supervisor Matthew Reitz was paid $100,730.
In 2011, Loyalsock Township School District employed 111 teachers, with the average teacher salary in Loyalsock Township School District was $56,912 a year, while the cost of the benefits teachers receive was $12,646 per employee, for a total annual average teacher compensation package of $69,558.[125]
In 2009, Loyalsock Township School District reported employing over 120 teachers with a starting salary of $38,000 for 180 days for pupil instruction and 10 days non instructional days.[126] The average teacher salary was $57,810 while the maximum salary is $118,369.[127] As of 2007, Pennsylvania ranked in the top 10 states in average teacher salaries. When adjusted for cost of living Pennsylvania ranked fourth in the nation for teacher compensation.[128] Additionally, Loyalsock Township School District teachers receive a defined benefit pension, health insurance, professional development reimbursement, 2.5 paid personal days (.5 days for attending graduation and days may carry over); 10 sick days, 3 days bereavement leave and other benefits. Teachers are paid extra if they are required to work outside of the regular school day. Retiring teachers receive a bonus. The union officers may take up to 4 days, with pay, for union business. Teachers work a 37.5-hour week.[129] According to State Rep. Glen Grell, a trustee of the Pennsylvania Public School Employees’ Retirement System Board, a 40-year educator can retire with a pension equal to 100 percent of their final salary.[130] Teacher pensions are portable within the Commonwealth.[131]
In 2007, the district employed 89 teachers. The average teacher salary in the district was $55,553 for 180 school days worked.[132]
Loyalsock Township School District administrative costs per pupil in 2008 were $870.85 per pupil. The district is ranked 125th out of 500 in Pennsylvania for administrative spending. The lowest administrative cost per pupil in Pennsylvania was $398 per pupil.[133]
In 2008, Loyalsock Township School District reported spending $12,468 per pupil. This ranked 225th in the commonwealth.[134]
- Reserves
In 2009, the district reported $3,725,967 in an unreserved-undesignated fund balance. The designated fund balance was reported as $1,100,000.[135] Loyalsock Township School District's General Fund balance increased to $5.4 million or 29% of General Fund revenue in 2010. The 2010-2011 budget had a $629,912 operating surplus. In fiscal year 2007, the District's reserve was $3.4 million or 18% of General Fund revenue.[136] Pennsylvania public school district reserve funds are divided into two categories – designated and undesignated. The undesignated funds are not committed to any planned project. Designated funds and any other funds, such as capital reserves, are allocated to specific projects. School districts are required by state law to keep 5 percent of their annual spending in the undesignated reserve funds to preserve bond ratings. According to the Pennsylvania Department of Education, from 2003 to 2010, as a whole, Pennsylvania school districts amassed nearly $3 billion in reserved funds.[137] In 2005, the total reserve funds held by Pennsylvania public school districts was $1.9 billion.[138] By 2013, reserves held by Pennsylvania public school districts, as a whole, had increased to over $3.8 billion.[139]
In March 2010, the Pennsylvania Auditor General conducted a performance audit of the District. Findings were reported to the administration and school board.[140] In January 2012, the Pennsylvania Auditor General conducted a performance audit of the District. Significant findings were reported to the administration and school board.[141] In June 2014, the Pennsylvania Auditor General conducted another performance audit of the District. They found that the District implemented procedures to address irregularities noted in a prior audit.[142]
The Loyalsock Township School District is funded by a combination of: a local earned income tax - 1.65%,[143] a property tax, a Local Services Tax of $5 on each person employed in the District's region and a real estate transfer tax 0.5%, Local Services Tax $5, Business Privilege 1 mill/Wholesale Gross Sales and 1.5 mills/Retail, Service or Rental Gross; coupled with substantial funding from the Commonwealth of Pennsylvania and the federal government. Grants can provide an opportunity to supplement school funding without raising local taxes. In the Commonwealth of Pennsylvania, both pension and Social Security income are exempted from state personal income tax and local earned income tax, regardless of the individual's wealth.[144] The average Pennsylvania public school teacher pension in 2011 exceeds $60,000 a year plus they receive federal Social Security benefits: both are free of Pennsylvania state income tax and local income tax which funds local public schools.[145]
State basic education funding
According to a report from Representative Todd Stephens office, Loyalsock Township School District receives 27.1% of its annual revenue from the state.[146]
For the 2014-15 school year, Loyalsock Township School District received $2,769,652 in State Basic Education funding. The District also received $38,287 in Accountability Block Grant funding and $65,688 in new Ready To Learn Block grant. The State’s enacted Education Budget includes $5,526,129,000 for the 2014-2015 Basic Education Funding.[147] The Education budget also includes Accountability Block Grant funding at $100 million and $241 million in new Ready to Learn funding for public schools that focus on student achievement and academic success. The State is paying $500.8 million to Social Security on the school employees behalf and another $1.16 billion to the state teachers pension system (PSERS). In total, Pennsylvania’s Education budget for K-12 public schools is $10 billion. This was a $305 million increase over 2013-2014 state spending and the greatest amount ever allotted by the Commonwealth for its public schools.[148]
For the 2013-14 school year, the Loyalsock Township School District received $2,769,027 in Pennsylvania Basic Education Funding (BEF), which is $70,217 more than its 2012-13 state BEF to the District. Additionally, the District received $38,287 in Accountability Block Grant funding to focus on academic achievement an level funding for special education services. The District has the option of applying for several other state and federal grants to increase revenues. The Commonwealth’s budget increased Basic Education Funding statewide by $123 million to over $5.5 billion. The state funded the PSERS (state school employee pension fund) with $1,017,000,000 and Social Security payments for school employees of $495 million.[149]
In the 2012-13 school year, Loyalsock Township School District received $2,737,096 in state funding.[150] The Governor's Executive Budget for 2012-2013 includes $9.34 billion for kindergarten through 12th grade public education, including $5.4 billion in basic education funding, which was an increase of $49 million over the 2011-12 budget. The state also provided $100 million for the Accountability Block Grant (ABG). Loyalsock Township School District also received $38,287 in ABG funds. The state paid $544.4 million for School Employees’ Social Security and $856 million for School Employees’ Retirement fund called PSERS.[151]
In the 2011-12 school year, Loyalsock Township School District received $2,698,468 in state Basic Education Funding.[152] Additionally, the District received $38,287 in state Accountability Block Grant funding.[153] The enacted Pennsylvania state Education budget includes $5,354,629,000 for the 2011-2012 Basic Education Funding appropriation. This amount is a $233,290,000 increase (4.6%) over the enacted State appropriation for 2010-2011. The highest increase in state basic education funding was awarded to Duquesne City School District, which got a 49% increase in state funding for 2011-12.[154] Districts experienced a reduction in funding, due to the loss of federal stimulus funding which ended in 2011. In 2010, Loyalsock Township School District reported that 389 of its pupils received a free or reduced price meals, through the federal school lunch program, due to the family meeting the federal poverty level.
For the 2010-11 school year, Loyalsock Township School District received an 8.13% increase in state Basic Education Funding resulting in a $2,966,393 payment.[155] This was the highest increase in BEF in Lycoming County. Kennett Consolidated School District in Chester County received the highest increase in the state at 23.65% increase in funding for the 2010-11 school year. One hundred fifty school districts received the base 2% increase in 2010-11. The state's hold harmless policy regarding state basic education funding continued where each district received at least the same amount as it received the prior school year, even when enrollment had significantly declined. The amount of increase each school district received was determined by then Governor Edward Rendell and the Secretary of Education Gerald Zahorchak, through the allocation set in the state budget proposal made in February each year. This was the second year of Governor Rendell’s policy to fund some districts at a far greater rate than others.[156]
In the 2009-2010 budget year, the Commonwealth of Pennsylvania provided a 5.94% increase in Basic Education funding for a total of $2,743,481 to Loyalsock Township School District. The District also received supplemental funding for English language learners, Title 1 federal funding for low-income students, for district size, a poverty supplement from the commonwealth and more.[157] This was the highest increase in BEF, among Lycoming County school districts, for the 2009-10 school year. Among the 500 school districts in Pennsylvania, Muhlenberg School District in Berks County received the highest with a 22.31% increase in funding.[158]
The state Basic Education funding to the Loyalsock Township School District in 2008-09 was $2,589,668.39 for Loyalsock Township School District. According to the Pennsylvania Department of Education, 351 district students received free or reduced-price lunches due to low family income in the 2007-2008 school year.[159]
Accountability Block Grants
Beginning in 2004-2005, the state launched the Accountability Block Grant school funding. This program has provided $1.5 billion to Pennsylvania’s school districts. The Accountability Block Grant program requires that its taxpayer dollars are focused on specific interventions that are most likely to increase student academic achievement. These interventions include: teacher training, all-day kindergarten, lower class size K-3rd grade, literacy and math coaching programs that provide teachers with individualized job-embedded professional development to improve their instruction, before or after school tutoring assistance to struggling students. For 2010-11, Loyalsock Township School District applied for and received $103,921 in addition to all other state and federal funding. The District uses the funding to provide full-day kindergarten since 2004.[160][161]
Classrooms for the Future grant
The Classroom for the Future state program provided public school districts with hundreds of thousands of extra state funding to buy laptop computers for each core curriculum high school class (English, Science, History, Math) and paid for teacher training to optimize the computers use. The program was funded from 2006-2009. Loyalsock Township School District was denied funding in 2006-07. In 2007-08 the district received $81,173. For the 2008-09, school year the district received $44,414 for a total of $125,587. Of the 501 public school districts in Pennsylvania, 447 of them received Classrooms for the Future grant awards.[162] In Lycoming County, the highest award was given to Jersey Shore Area School District which was award $428,436. The highest funding statewide was awarded to Philadelphia City School District in Philadelphia County - $9,409,073. The grant program was discontinued by Governor Edward Rendell as part of his 2009-10 state budget plan.
Other grants
Loyalsock Township School District did not participate in: Science Its Elementary grants;[163] PreK Counts (taxpayer funded preschool); Striving Readers Comprehensive Literacy grants;[164] Federal 21st Century Learning grants for after school programs; Education Assistance tutoring grants; Pennsylvania Department of Environmental Protection's Environment Education grants;[165] nor 2012 and 2013 Pennsylvania Hybrid Learning Grants[166]
Federal stimulus grant
Loyalsock Township School District received an extra $793,324 in ARRA - federal stimulus money to be used in specific programs like special education and meeting the academic needs of low-income students.[167] The funding was for the 2009-2010 and 2010-2011 school years.[168] Due to the temporary nature of the funding, schools were repeatedly advised by the Pennsylvania Department of Education, the Pennsylvania Senate Education Committee, the Governor and the Pennsylvania School Board Association, to use the funds for one-time expenditures like acquiring equipment, making repairs to buildings, training teachers to provide more effective instruction or purchasing books, computers and software.
Race to the Top grant
Loyalsock Township School District officials did not apply for the Race to the Top federal grant which would have brought the District hundreds of thousands in additional federal dollars for improving student academic achievement.[169] Participation required the administration, the school board and the local teachers' union to sign an agreement to prioritize improving student academic success. In Pennsylvania, 120 public school districts and 56 charter schools agreed to participate.[170] Pennsylvania was not approved for the grant. The failure of districts to agree to participate was cited as one reason that Pennsylvania was not approved.[171]
Common Cents state initiative
The Loyalsock Township School Board did not participate in the Pennsylvania Department of Education Common Cents program. The program called for the state to audit the district, at no cost to local taxpayers, to identify ways the district could save tax dollars.[172] After the review of the information, the district was not required to implement the recommended cost savings changes.
Real estate taxes
The school board set property tax rates for the school budget 2014-15 at 13.58 mills. A mill is $1 of tax for every $1,000 of a property's assessed value. Irregular property reassessments have become a serious issue in the commonwealth as it creates a significant disparity in taxation within a community and across a region. Pennsylvania school district revenues are dominated by two main sources: 1) Property tax collections, which account for the vast majority (between 75-85%) of local revenues; and 2) Act 511 tax collections (Local Tax Enabling Act), which are around 15% of revenues for school districts.[173] Property taxes, in the Commonwealth of Pennsylvania, apply only to real estate - land and buildings. The property tax is not levied on cars, business inventory, or other personal property. Certain types of property are exempt from property taxes, including: places of worship, places of burial, private social clubs, charitable and educational institutions and all government property (local, state and federal). Additionally, service related, disabled US military veterans may seek an exemption from paying property taxes. Pennsylvania school district revenues are dominated by two main sources: 1) Property tax collections, which account for the vast majority (between 75-85%) of local revenues; and 2) Act 511 tax collections, which are around 15% of revenues for school districts.[174] When a Pennsylvania public school district includes municipalities in two counties, each of which has different rates of property tax assessment, a state board equalizes the tax rates between the counties.[175] In 2010, miscalculations by the State Tax Equalization Board (STEB) were widespread in the Commonwealth and adversely impacted funding for many school districts, including those that did not cross county borders.[176]
According to a report prepared by the Pennsylvania Department of Education, the total real estate taxes collected by all school districts in Pennsylvania rose from $6,474,133,936 in 1999-00 to $10,438,463,356 in 2008-09.[182] The average yearly property tax paid by Lycoming County residents in 2012 amounted to about 3.53% of their yearly income. Lycoming County was ranked 364th of the 3143 United States counties for property taxes as a percentage of median income.[183] In 2013, the average yearly property tax paid by Lycoming County residents was 3.53% of their annual income. Lycoming County ranked 364th of the 3143 counties for property taxes as a percentage of resident's median income.[184]
Act 1 adjusted index
The Act 1 of 2006 Index regulates the rates at which each school district can raise property taxes in Pennsylvania. Districts are not authorized to raise taxes above that index unless they allow voters to vote by referendum, or they seek an exception from the state Department of Education. The base index for the 2011-2012 school year is 1.4 percent, but the Act 1 Index can be adjusted higher, depending on a number of factors, such as property values and the personal income of district residents. Act 1 included 10 exceptions, including: increasing pension costs, increases in special education costs, a catastrophe like a fire or flood, increase in health insurance costs for contracts in effect in 2006 or dwindling tax bases. The base index is the average of the percentage increase in the statewide average weekly wage, as determined by the PA Department of Labor and Industry, for the preceding calendar year and the percentage increase in the Employment Cost Index for Elementary and Secondary Schools, as determined by the Bureau of Labor Statistics in the U.S. Department of Labor, for the previous 12-month period ending June 30. For a school district with a market value/personal income aid ratio (MV/PI AR) greater than 0.4000, its index equals the base index multiplied by the sum of .75 and its MV/PI AR for the current year.[185]
The School District Adjusted Index for the Loyalsock Township School District 2006-2007 through 2010-2011.[186]
|
For the 2014-15 budget year, Loyalsock Township School Board did not apply for exceptions to exceed their Act 1 Index limit. In 2014-15, all Pennsylvania school districts were required to make a 21.4% of payroll payment to the teacher’s pension fund (PSERS).[190] For the school budget 2014-15, 316 Pennsylvania public school districts adopted a resolution certifying that tax rates would not be increased above its Act 1 Index limit. Another 181 school districts adopted a preliminary budget leaving open the option of exceeding the Index limit. Districts may apply for multiple exceptions each year. For the pension costs exception, 163 school districts received approval to exceed the Index in full, while others received a partial approval of their request. For special education costs, 104 districts received approval to exceed their tax limit. Seven Pennsylvania public school districts received an approval for the grandfathered construction debts exception.[191]
For the 2013-14 budget year, Loyalsock Township School Board did not apply for exceptions to exceed their Act 1 Index limit. In 2013-14, all Pennsylvania school districts were required to make a 16.93% of payroll payment to the teacher’s pension fund (PSERS). For the school budget year 2013-14, 311 Pennsylvania public school districts adopted a resolution certifying that tax rates would not be increased above their index. Another 171 school districts adopted a preliminary budget leaving open the option of exceeded the Index limit. For the pension costs exception, 169 school districts received approval to exceed the Index. For special education costs, 75 districts received approval to exceed their tax limit. Eleven Pennsylvania public school districts received an approval for grandfathered construction debts.[192]
For the 2012-13 budget year, Loyalsock Township School Board did not apply for exceptions to exceed the Act 1 Index. For 2012-2013, 274 school districts adopted a resolution certifying that tax rates would not be increased above their index; 223 school districts adopted a preliminary budget leaving open the option of exceeded the Index limit. For the exception for pension costs, 194 school districts received approval to exceed the Index. For special education costs, 129 districts received approval to exceed the tax limit.[193]
For the 2011-12 school year, the Loyalsock Township School Board did not apply for exceptions to exceed the Act 1 Index. Each budget year, the Loyalsock Township School Board has the option of adopting either 1) a resolution in January certifying they will not increase taxes above their index or 2) a preliminary budget in February. A school district adopting the resolution may not apply for referendum exceptions or ask voters for a tax increase above the inflation index. A specific timeline for these decisions is publisher each year by the Pennsylvania Department of Education.[194]
According to a state report, for the 2011-2012 school year budgets, 247 school districts adopted a resolution certifying that tax rates would not be increased above their index; 250 school districts adopted a preliminary budget. Of the 250 school districts that adopted a preliminary budget, 231 adopted real estate tax rates that exceeded their index. Tax rate increases in the other 19 school districts that adopted a preliminary budget did not exceed the school district’s index. Of the districts who sought exceptions 221 used the pension costs exemption and 171 sought a Special Education costs exemption. Only 1 school district sought an exemption for Nonacademic School Construction Project, while 1 sought an exception for Electoral debt for school construction.[195]
Loyalsock Township School Board did not apply for exceptions to exceed the Act 1 index for the budgets in 2009-10 or in 2010-11.[196] In the Spring of 2010, 135 Pennsylvania school boards asked to exceed their adjusted index. Approval was granted to 133 of them and 128 sought an exception for pension costs increases.[197]
Property tax relief
In 2013, Loyalsock Township School District approved homestead properties receiving $131 in state property tax relief.[198] The amount received by the District must be divided equally among all the 3,016 approved residences.[199] Businesses do not receive this reduction.
In 2009, the Homestead/Farmstead property tax relief from gambling for the Loyalsock Township School District was $131 per approved permanent primary residence. In the District, 3,006 property owners applied for the tax relief.[200] The tax relief was subtracted from the total annual school property on the individual's tax bill. Property owners apply for the relief through the county Treasurer's office. Farmers can qualify for a farmstead exemption on building used for agricultural purposes. The farm must be at least 10 contiguous acres and must be the primary residence of the owner. Farmers can qualify for both the homestead exemption and the farmstead exemption. The Pennsylvania Auditor General found that 69% of property owners applied for tax relief in Lycoming County.[201] In Lycoming County, the highest property tax relief in 2009 was $310 awarded to the approved property owners in Williamsport Area School District. Pennsylvania awarded the highest property tax relief to residents of the Chester-Upland School District in Delaware County at $632 per homestead and farmstead in 2010.[202] This was the second year Chester Upland School District was the top recipient.
Additionally, the Pennsylvania Property Tax/Rent Rebate program is provided for low income Pennsylvanians aged 65 and older; widows and widowers aged 50 and older; and people with disabilities age 18 and older. The income limit is $35,000 for homeowners. The maximum rebate for both homeowners and renters is $650. Applicants can exclude one-half (1/2) of their Social Security income, consequently individuals who have income substantially more than $35,000, may still qualify for a rebate. Individuals must apply annually for the rebate. This can be taken in addition to Homestead/Farmstead Property Tax Relief.[203]
Property taxes in Pennsylvania are relatively high on a national scale. According to the Tax Foundation, Pennsylvania ranked 11th in the U.S. in 2008 in terms of property taxes paid as a percentage of home value (1.34%) and 12th in the country in terms of property taxes as a percentage of income (3.55%).[204]
Enrollment and consolidation
Loyalsock Township School District is experiencing low enrollment in K-12. The Pennsylvania Department of Education projects that the District's enrollment will decline to 1,200 pupils through 2018.[205] Shifting population trends across the U.S. and Pennsylvania are affecting school enrollment and may impact the building needs of school districts in the years to come.[206] Over the next 10 years, rural Pennsylvania school enrollment is projected to decrease 8 percent. The most significant enrollment decline is projected to be in western Pennsylvania, where rural school districts may have a 16 percent decline. More than 40 percent of elementary schools and more than 60 percent of secondary schools in western Pennsylvania are projected to experience significant enrollment decreases (15 percent or greater).[207]
A study done by Standard and Poors in 2007 (at the request of the PA General Assembly) examined the district consolidating with neighboring districts.[208] As a part of the study, superintendents were asked about savings, if their district were to merge with another district at the administrative level only, but not close any of their schools. It found 42% of the respondents believed consolidation would achieve cost reductions. Additionally, 63% of superintendents believed that consolidation with another district would help provide additional academic enrichment opportunities for their students.[209]
From 2000 through 2010, rural Pennsylvania public school district enrollment has decreased by 8 percent.[210] In 2010, there were 726,417 children in rural Pennsylvania, or 21 percent of the total rural population. From 2000 to 2010, the number of children in rural counties decreased 7 percent. The decline in the number of children impacted most rural counties with 42 of Pennsylvania’s 48 rural counties experiencing a decline. Cameron County, Elk County and Sullivan County experienced the greatest declines, with a decrease of more than 21 percent in all three counties. Lycoming County's live birth rate was 1,705 births in 1990. Lycoming County's live birth rate in 2000 was 1,339 births while in 2011 it had declined to 1,279 babies.[211] Over the past 50 years (1960 to 2010), rural Pennsylvania saw a steady decline in both the number and proportion of residents under 18 years old. In 1960, 1.06 million rural residents, or 35 percent of the rural population, were children.
Pennsylvania’s birth rate has been declining for two decades. According to data from the Pennsylvania Department of Health, in 1990, the Commonwealth of Pennsylvania’s birth rate was 171,053.[212] In 2000, Pennsylvania’s birth rate was 145,874.[213] Finally in 2011, the State’s birth rate declined further to 142,021.[214] From 2000 to 2009, the number of babies born in rural counties declined 5 percent.[215] Urban counties have also experienced a decline in the number of school aged children. From 2000-2010 urban Pennsylvania counties had a 3 percent decline in the number of residents under 18 years old. In 2010, there were 2.07 million residents, or 22 percent of the urban population, who were under age 18.[216]
Pennsylvania has one of the highest numbers of school districts in the nation (500 in 2012). In Pennsylvania, 80% of the school districts serve student populations under 5,000, and 40% serve less than 2,000. Less than 95 of Pennsylvania's 501 school districts have enrollment below 1250 students, in 2007.[217]
Extracurriculars
The Loyalsock Township School District offers a variety of clubs, activities and an extensive sports program. Eligibility to participate in extracurricular activities and sports is set by Loyalsock Township School Board policies.[218][219][220][221]
In February 2011, in response to what the Loyalsock Township School District Administration characterized as a significant drug abuse problem, the Loyalsock Township School Board adopted a random drug testing of students who drive to school or who participate in extracurricular activities. A student filed suit against the district refusing to submit to the random drug testing.[222] The Court upheld the District's policy.[223]
By Pennsylvania law, all K-12 students in the District, including those who attend a private nonpublic school, cyber charter school, charter school and those homeschooled, are eligible to participate in the extracurricular programs, including all athletics. They must meet the same eligibility rules as the students enrolled in the district's schools.[224]
According to Pennsylvania’s Safety in Youth Sports Act, all sports coaches, paid and volunteer, are required to annually complete the Concussion Management Certification Training and present the certification before coaching.[225][226]
Coaches and club advisors receive compensation as outlined in the Loyalsock Township Teachers' Union contract. When athletic competition exceeds the regular season, additional compensation is paid.[227]
Sports
The sports programs are through the Pennsylvania Heartland Athletic Conference and the Pennsylvania Interscholastic Athletic Association.[228] The Pennsylvania Heartland Athletic Conference is a voluntary association of 25 PIAA High Schools within the central Pennsylvania region.
The District funds:
|
|
Middle School Sports:
|
|
According to PIAA directory July 2012 [229]
References
- ↑ Pennsylvania Department of Education, Ed Names and Addresses, 2014
- ↑ Williamsport Sun-Gazette (December 15, 2013). "8 county superintendents receive nearly $1 million to run districts".
- ↑ Openpagov.org, Loyalsock Township School District payroll, 2012
- ↑ NCES, Common Core of Data Loyalsock Township School District, 2014
- ↑ National Center for Education Statistics, Common COre of Data - Loyalsock Township School District, 2011
- ↑ Pennsylvania Department of Education (September 4, 2016). "Loyalsock Township School District Fast Facts 2016".
- ↑ http://www.education.pa.gov/_layouts/download.aspx?SourceUrl=http://www.education.pa.gov/Documents/Data%20and%20Statistics/Enrollment/Enrollment%20Projections/Enrollment%20Public%20Schools%202015-16.xlsx
- ↑ Secretary Loyalsock Township School Board (June 25, 2014). "Loyalsock Township School District Meeting Minutes" (PDF).
- ↑ Loyalsock Township School Board, Tax and Budget Notice 2013, June 2013
- ↑ Loyalsock Township School Board, Meeting agenda, June 20, 2012
- ↑ Loyalsock Township School District Business Office (2012). "2012-2013 General Fund Budget Executive Summary Presentation" (PDF).
- ↑ Pennsylvania Department of Education, Pennsylvania Public School District Tuition Rates, May 2012
- ↑ US Census Bureau, 2010 Census Poverty Data by Local Education Agency, 2011
- ↑ proximityone (2014). "School District Comparative Analysis Profiles".
- ↑ American Fact Finder, US Census Bureau, 2009
- ↑ US Census Bureau (2010). "American Fact Finder, State and County quick facts".
- ↑ US Census Bureau (September 2011). "Income, Poverty, and Health Insurance Coverage in the United States: 2010" (PDF).
- ↑ Michael Sauter & Alexander E.M. Hess, (August 31, 2013). "America's most popular six-figure jobs". USA Today.
- ↑ Pennsylvania Public School Code Governance 2010
- ↑ Pennsylvania General Assembly, Pennsylvania School Code, 2013
- ↑ Pittsburgh Business Times (April 11, 2014). "Guide to Pennsylvania Schools Statewide School District Ranking 2014".
- ↑ Pittsburgh Business Times (April 11, 2014). "What makes up a district's School Performance Profile score?".
- ↑ Pittsburgh Business Times (April 4, 2010). "Statewide Ranking Information".
- ↑ Pittsburgh Business Times, Guide to Western Pennsylvania Schools Statewide Honor Roll Rankings 2013, April 6, 2013
- ↑ Pittsburgh Business Times, Statewide Honor Roll Rankings 2012, April 4, 2012
- ↑ Pittsburgh Business Times, Statewide Honor Roll Rankings 2011, April 4, 2011
- ↑ Pittsburgh Business Times, Statewide Honor Roll 2010, May 1, 2010
- ↑ "Three of top school districts in state hail from Allegheny County,". Pittsburgh Business Times,. May 23, 2007.
- ↑ "2009 PSSA RESULTS Loyalsock Township School District,". The Morning Call. Retrieved March 6, 2011.
- ↑ Pennsylvania Department of Education, Loyalsock Township School District AYP data 2012, September 21, 2012
- ↑ Pennsylvania Department of Education, Pennsylvania Public School District AYP History, 2011
- ↑ Pennsylvania Department of Education, Pennsylvania District AYP History 2003-2010, 2011
- ↑ PDE, District Fast Facts 2013 - Loyalsock Township School District, October 4, 2013
- ↑ Pennsylvania Department of Education, Loyalsock Township School District AYP data table 2012, September 21, 2012
- ↑ Pennsylvania Department of Education (September 29, 2011). "Loyalsock Township School District Report Card 2011 - School AYP Data Table".
- ↑ Pennsylvania Department of Education (March 15, 2011). "New 4-year Cohort Graduation Rate Calculation Now Being Implemented".
- ↑ Pennsylvania Department of Education, Loyalsock Township School District Academic Achievement Report Card 2010 data table, accessdate=March 3, 2011
- ↑ The Times-Tribune (June 25, 2009). "Lycoming County Graduation Rates 2008".
- ↑ Pennsylvania Partnerships for Children. "High School Graduation rate 2007". Retrieved January 31, 2011.
- ↑ Pennsylvania Department of Education (September 29, 2011). "Loyalsock Township School District Report Card 2005".
- ↑ US News and World Report, Best High Schools, 2013
- ↑ National Center for Education Statistics, Common Care Data - Loyalsock Township High School, 2010
- ↑ Pennsylvania Department of Education, Professional Qualifications of Teachers Loyalsock Township High School, September 29, 2011
- ↑ US News & World Report (April 22, 2014). "High School Overview 2014".
- ↑ Pennsylvania Department of Education (October 4, 2013). "Loyalsock Township High School Academic Performance Data 2013".
- ↑ Eleanor Chute & Mary Niederberger (December 11, 2013). "New assessment shows fuller picture of Pa. schools". Pittsburgh Post-Gazette.
- ↑ Pennsylvania Department of Education (September 29, 2012). "2011-2012 PSSA and AYP Results".
- ↑ Pennsylvania Department of Education (September 29, 2011). "2010-2011 PSSA and AYP Results".
- ↑ "2010 PSSAs: Reading, Math, Writing and Science Results".
- ↑ Pennsylvania Department of Education (September 14, 2010). "2009 PSSAs: Reading, Math, Writing and Science Results".
- ↑ "The 2008 PSSA Mathematics and Reading School Level Proficiency Results (by Grade and School Total)". August 2008.
- ↑ Pennsylvania Department of Education. "PSSA Math and Reading results by School and Grade 2007".
- ↑ Pittsburgh Post Gazette (October 15, 2012). "How is your school doing?".
- ↑ Pennsylvania Department of Education, Loyalsock Township School District Report card 2010, March 2011
- ↑ Pennsylvania Department of Education, Loyalsock Township High School Report Card 2009, September 14, 2009
- ↑ "Math PSSA Scores by District 2007-08 Loyalsock Township School District Results". The Times-Tribune. June 25, 2009.
- ↑ Pennsylvania Department of Education (September 21, 2012). "Loyalsock Township High School Academic Achievement Report Card 2012" (PDF).
- ↑ Pennsylvania Department of Education (September 29, 2011). "2010-2011 PSSA results in Science".
- ↑ The Pennsylvania Basic Education/Higher Education Science and Technology Partnership, Science in Motion annual report, 2012
- ↑ Pennsylvania Department of Education (January 2009). "Pennsylvania College Remediation Report".
- ↑ National Center for Education Statistics
- ↑ College Board (2013). "The 2013 SAT Report on College & Career Readiness".
- ↑ Pennsylvania Department of Education (2011). "Public School SAT Scores 2011".
- ↑ College Board (September 2011). "SAT Scores State By State - Pennsylvania".
- ↑ "While U.S. SAT scores dip across the board, N.J. test-takers hold steady". NJ.com. September 2011.
- ↑ The Center for Rural Pennsylvania (August 2006). "SAT Scores and Other School Data".
- ↑ PDE, School Performance Profile - Academic Performance Data -Loyalsock Township High School, December 2013
- ↑ Bloomsburg University Administration (2013). "High School Students (ACE)".
- ↑ Commonwealth of Pennsylvania (March 2010). "Pennsylvania Transfer and Articulation Agreement".
- ↑ Pennsylvania Department of Education (October 4, 2013). "Middle School School Fast Facts".
- ↑ Pennsylvania Department of Education, Professional Qualifications of Teachers Middle School, October 4, 2013
- ↑ National Center for Education Statistics, Common Care Data – Loyalsock Township Middle School, 2010
- ↑ Pennsylvania Department of Education, Professional Qualifications of Teachers Loyalsock Township Middle School, September 29, 2011
- ↑ Pennsylvania Department of Education (October 4, 2013). "Loyalsock Township Middle School Academic Performance Data 2013,".
- ↑ Pennsylvania Department of Education (September 29, 2011). "LOYALSOCK Township Middle School AYP Overview".
- ↑ Pennsylvania Department of Education (September 29, 2011). "LOYALSOCK TWP MS - School AYP Data Table".
- ↑ Pennsylvania Department of Education. "IU16-PSSA 95-96 Results by School". Retrieved May 11, 2014.
- ↑ Pennsylvania Department of Education (2014). "Standards Aligned Systems".
- ↑ Pennsylvania Department of Education (2014). "State Academic Standards".
- ↑ Pennsylvania Department of Education (2014). "State Academic Standards Mathematics".
- ↑ Pennsylvania Department of Education (September 14, 2010). "Loyalsock Township Middle School Academic Achievement Report Card 2010".
- ↑ Pennsylvania Department of Education. "PSSA Math and Reading Results 2007". Retrieved February 2011. Check date values in:
|access-date=(help) - ↑ Pennsylvania Department of Education (September 21, 2012). "Loyalsock Township Middle School Academic Achievement Report Card 2012" (PDF).
- ↑ Pennsylvania Department of Education. "PSSA Results Math and Reading School 2008". Retrieved February 2011. Check date values in:
|access-date=(help) - ↑ Pennsylvania Department of Education. "PSSA Science results 2008-09". Retrieved February 2011. Check date values in:
|access-date=(help) - ↑ Pennsylvania Department of Education. "Science Results by School and Grade 2008". Retrieved February 2011. Check date values in:
|access-date=(help) - ↑ Pennsylvania Department of Education (October 4, 2013). "Donald E Shick Elementary School Fast Facts 2013".
- ↑ Pennsylvania Department of Education, School Performance Profile, Donald E Shick Elementary School Fast Facts, 2013
- ↑ National Center for Education Statistics, Common Care Data – Donald E. Shick Elementary School, 2011
- ↑ Pennsylvania Department of Education, Professional Qualifications of Teachers Shick Elementary School, September 29, 2011
- ↑ Pennsylvania Department of Education (October 4, 2013). "Donald E Shick Elementary School Academic Performance Data 2013".
- ↑ Pennsylvania Department of Education (September 29, 2011). "DONALD E SCHICK Elementary School AYP Overview".
- ↑ Pennsylvania Department of Education (September 29, 2011). "DONALD E SCHICK Elementary School AYP Overview".
- ↑ Pennsylvania Department of Education (September 21, 2012). "Shick Elementary School Academic Achievement Report Card 2012" (PDF).
- ↑ Pennsylvania Department of Education, Shick Elementary School Academic Achievement Report Card 2011, September 29, 2011
- ↑ Pennsylvania Department of Education, Shick Elementary School Academic Achievement Report Card 2010, October 20, 2010
- ↑ Pennsylvania Department of Education, Shick Elementary School Academic Achievement Report Card 2009, September 14, 2009
- ↑ Pennsylvania Department of Education, Shick Elementary School Academic Achievement Report Card 2008, August 15, 2008
- ↑ Pennsylvania Department of Education, Shick Elementary School Academic Achievement Report Card 2007, 2007
- ↑ Pennsylvania Bureau of Special Education (January 31, 2011). "Loyalsock Township School District Special Education Data Report LEA Performance on State Performance Plan (SPP) Targets School Year 2008-2009" (PDF).
- ↑ Loyalsock Township School District (2010–2011). "Loyalsock Township School District Special Education Department - Annual Public Notice of Special Education Services".
- ↑ Pennsylvania Department of Education. "Pennsylvania Special Education Funding".
- ↑ Senator Patrick Browne (November 1, 2011). "Senate Education Committee Holds Hearing on Special Education Funding & Accountability".
- ↑ Pennsylvania Department of Education Amy Morton, Executive Deputy Secretary (November 11, 2011). "Public Hearing: Special Education Funding & Accountability Testimony".
- ↑ Baruch Kintisch Education Law Center (November 11, 2011). "Public Hearing: Special Education Funding & Accountability Testimony" (PDF).
- ↑ Pennsylvania Department of Education (July 2010). "Special Education Funding from Pennsylvania State_2010-2011".
- ↑ Pennsylvania Department of Education (July 2011). "Pennsylvania Department of Education 2011-12 Budget Information".
- ↑ Pennsylvania Department of Education (Revised December 1, 2009 Child Count (Collected July 2010)). "Gifted Students as Percentage of Total Enrollment by School District/Charter School" (PDF). Check date values in:
|date=(help) - ↑ Pennsylvania Department of Education and Pennsylvania School Board. "CHAPTER 16. Special Education For Gifted Students". Retrieved February 4, 2011.
- ↑ Center for Safe Schools (2013). "Loyalsock Township School Safety Report 2013" (PDF).
- ↑ Commonwealth of Pennsylvania Safe School Center (2012). "Pennsylvania Safe Schools Online Reports".
- ↑ Safe & Responsive Schools Project (June 20, 2011). "Area high school students create anti-bullying mural". Williamsport Sun Gazette.
- ↑ Pennsylvania Office of Safe Schools. "Loyalsock Township School District School Safety Annual Report 2008 - 2009" (PDF). Retrieved February 8, 2011.
- ↑ "Pennsylvania Safe Schools Online Reports". February 2011.
- ↑ Pennsylvania Office of Safe Schools. "Loyalsock Township School District School Safety Annual Report 2006 - 2007" (PDF). Retrieved August 3, 2014.
- ↑ Pennsylvania Office of Safe Schools. "Loyalsock Township School District School Safety Annual Report 2006 - 2007" (PDF). Retrieved August 3, 2014.
- ↑ Loyalsock Township School District Administration (December 2008). "Loyalsock Township School District AntiBullying Policy 249".
- ↑ "Regular Session 2007-2008 House Bill 1067, Act 61 Section 6 page 8".
- ↑ "Center for Safe Schools of Pennsylvania, Bullying Prevention advisory". Retrieved January 2011. Check date values in:
|access-date=(help) - ↑ Pennsylvania Department of Education. "Pennsylvania Academic Standards".
- ↑ Pennsylvania General Assembly, Taxpayer Relief Act, Act 1 of the Special Session of 2006, June 27, 2006
- ↑ Pennsylvania Department of Education (2014). "Investing in Pennsylvania Students 2014".
- ↑ "Loyalsock Township School District Payroll report 2012". OpenPA Gov.org. 2013.
- ↑ Times Tribune (June 16, 2013). "PA Teacher Profile Database 2011-12".
- ↑ Pennsylvania Department of Education (2012). "Investing in Pennsylvania Students".
- ↑ "Pa. Public School Salaries, 2009". Asbury Park Press. Retrieved February 2011. Check date values in:
|access-date=(help) - ↑ "Loyalsock Township School Payroll report". openpagov. Retrieved March 1, 2011.
- ↑ Teachers need to know enough is enough, PaDelcoTimes, April 20, 2010.
- ↑ "Loyalsock Township School District Teachers Union Employment Contract 2011".
- ↑ "Legislature must act on educators' pension hole.". The Patriot News. February 21, 2010.
- ↑ PSERS Board. "PSERS 2009/2010 report To the House Appropriations Committee" (PDF).
- ↑ Fenton, Jacob,. "Average classroom teacher salary in Lycoming County, 2006-07.". The Morning Call. Retrieved March 8, 2011.
- ↑ Fenton, Jacob. (Feb 2009). "Pennsylvania School District Data: Will School Consolidation Save Money?, '". The Morning Call.
- ↑ "Per Pupil Spending in Pennsylvania Public Schools in 2008 Sort by Administrative Spending".
- ↑ Pennsylvania Department of Education. "Fund Balances by Local Education Agency 1997 to 2008".
- ↑ Moody's Investor's Service (June 17, 2011). "MOODY'S ASSIGNS AN Aa3 UNDERLYING RATING AND Aa3 ENHANCED RATING WITH A NEGATIVE OUTLOOK TO LOYALSOCK TOWNSHIP SCHOOL DISTRICT (PA) $5.1 MILLION UNLIMITED GENERAL OBLIGATION REFUNDING BONDS, SERIES OF 2011".
- ↑ Murphy, Jan., Pennsylvania's public schools boost reserves, CentreDaily Times, September 22, 2010
- ↑ John Baer (December 9, 2013). "Pa. schools and $$ behind the curtain". Philadelphia Daily News.
- ↑ Melissa Daniels (June 1, 2013). "PA school districts look to cash stash to balance budgets". PA Independent.
- ↑ Pennsylvania Auditor General Office, Loyalsock Township School District Lycoming County, Pennsylvania Performance Audit Report ,March 2010
- ↑ "LOYALSOCK TOWNSHIP SCHOOL DISTRICT LYCOMING COUNTY, PENNSYLVANIA PERFORMANCE AUDIT REPORT". January 2012.
- ↑ "LOYALSOCK TOWNSHIP SCHOOL DISTRICT LYCOMING COUNTY, PENNSYLVANIA PERFORMANCE AUDIT REPORT". June 2014.
- ↑ Municipal and School District Tax Office, Income Tax reporting form instructions, 2012
- ↑ Pennsylvania Department of Revenue (October 2010). "Personal Income Tax Information".
- ↑ John Finnerty (2013). "PA teachers pensions". CNHI Harrisburg Bureau.
- ↑ Pennsylvania Representative Todd Stephens (January 23, 2014). "LEEF Funding Chart 2014".
- ↑ PDE (July 7, 2014). "Enacted Education Budget 2014-2015".
- ↑ Pennsylvania Department of Education, 2014-15 Enacted Education Budget Fast Facts, July 14, 2014
- ↑ Pennsylvania Office of the Budget, 2013-14 State Budget Highlights, 2013
- ↑ Senator Jake Corman (June 28, 2012). "Pennsylvania Education funding by Local School District" (PDF).
- ↑ Pennsylvania General Assembly Sen Jake Corman (June 29, 2012). "SB1466 of 2012 General Fund Appropriation".
- ↑ PA Senate Appropriations Committee (June 28, 2011). "School District 2011-12 funding Report".
- ↑ Pennsylvania Senate Appropriations Committee (June 2011). "Senate Budget Hearings 2011-2012 School District funding for 2011-2012".
- ↑ Pennsylvania Department of Education (June 30, 2011). "Basic Education Funding 2011-2012 Fiscal Year".
- ↑ Pennsylvania house Appropriations Committee (August 2010). "PA House Appropriations Committee Basic Education Funding-Printout2 2010-2011".
- ↑ Office of Budget, (February 2010). "Pennsylvania Budget Proposal".
- ↑ Pennsylvania Department of Education (October 2009). "Basic Education Funding by School District 2009-10".
- ↑ "Pennsylvania Department of Education Report on Funding by school district". October 2009.
- ↑ "Funding Report by LEA 2009". Pennsylvania Department of Education. 2009.
- ↑ Pennsylvania Department of Education (2010). "Accountability Block Grant report Grantee list 2010".
- ↑ Pennsylvania Department of Education (2008). "Accountability Block Grant Mid Year report".
- ↑ Pennsylvania Auditor General (2008-12-22). "Special Performance Audit Classrooms For the Future grants" (PDF).
- ↑ Pennsylvania Department of Education, Science: It’s Elementary Grantees Students in 143 Schools Benefit from Intensive Science Curriculum, July 22, 2008
- ↑ Pennsylvania Department of Education (May 23, 2012). "Pennsylvania Awards $36.1 Million to Strengthen Literacy Programs".
- ↑ Department of Environmental Protection (2014). "Environmental Education Grants".
- ↑ Pennsylvania Department of Education Press Office (October 17, 2013). "Acting Secretary of Education Says Hybrid Learning Benefits Students; Highlights Success of First-Year Pilot Program".
- ↑ Commonwealth of Pennsylvania. "Lycoming County ARRA FUNDING Report". Retrieved February 2011. Check date values in:
|access-date=(help) - ↑ "School stimulus money". Pittsburgh Post-Gazette. March 12, 2009.
- ↑ Pennsylvania Department of Education Press Release (January 2009). "Pennsylvania's 'Race to the Top' Fueled by Effective Reforms, Strong Local Support".
- ↑ Pennsylvania's 'Race to the Top' Fueled by Effective Reforms, Strong Local Support
- ↑ U.S. Department of Education (March 29, 2010). "Race to the Top Fund,".
- ↑ Pennsylvania Department of Education. "Common Cents program - Making Every Dollar Count". Retrieved February 1, 2011.
- ↑ Pennsylvania Department of Education,. "Act 511 Tax Report, 2004".
- ↑ Pennsylvania Department of Education (2004). "Act 511 Tax Report".
- ↑ State Tax Equalization Board (2011). "State Tax Equalization Board About US".
- ↑ Pennsylvania Auditor General office - Bureau of Audits (February 2011). "A Special Performance Audit of the Pennsylvania State Tax Equalization Boards" (PDF).
- ↑ Pennsylvania Department of Education. "Finances_Real Estate Tax Rates 2010-11".
- ↑ Pennsylvania Department of Education (2010). "Real Estate Tax Millage by School District, Pennsylvania Department of Revenue".
- ↑ Pennsylvania Department of Revenue. (2009). "Real Estate Tax Millage by School District,".
- ↑ Pennsylvania Department of Education (2008). "Pennsylvania School District Real Estate Tax Rates 2008-09".
- ↑ Pennsylvania Department of Education, Real Estate Tax Millage by School District 2005, 2005
- ↑ Pennsylvania Department of Education (2009). "Pennsylvania School Finances - Summaries of Annual Financial Report Data 2008-09".
- ↑ Lycoming County Property Taxes 2012, Tax-rates.org, 2012
- ↑ Tax-rates.org (2014). "Lycoming County Property Taxes 2013".
- ↑ Pennsylvania Department of Education 2010-11 Act 1 of 2006 Referendum Exception Guidelines.
- ↑ Pennsylvania Department of Education (May 2010). "Special Session Act 1 of 2006 School District Adjusted Index for 2006-2007 through 2011-2012".
- ↑ Pennsylvania Department of Education (May 4, 2011). "SSAct1 Adjusted Index History 2006-07 thru 2012-1213".
- ↑ Pennsylvania Department of Education, 2013-2014 School District Adjusted Index, May 2012
- ↑ Pennsylvania Department of Education, 2014-2015 School District Adjusted Index, September 2013
- ↑ Pennsylvania School Employees, Retirement System, PSERS Chart showing payment mandates 2007-2020, 2014
- ↑ Pennsylvania Department of Education (April 30, 2014). "Report on Referendum Exceptions For School Year 2014-2015".
- ↑ Pennsylvania Department of Education, Report on Referendum Exceptions For School Year 2013-2014, April 2013
- ↑ Pennsylvania Department of Education, Report on Referendum Exceptions For School Year 2012-2013, March 30, 2012
- ↑ Pennsylvania Department of Education (2011). "Special Session Act 1 of 2006 the Taxpayer Relief Act information".
- ↑ Pennsylvania Department of Education (April 2011). "Report on Exceptions".
- ↑ Pennsylvania Department of Education (April 2010). "Pennsylvania SSAct1_Act1 Exceptions Report 2010-2011 April 2010".
- ↑ Scarcella, Frank & Pursell, Tricia (May 25, 2010). "Local school tax assessments exceed state averages". The Daily Item.
- ↑ Pennsylvania Department of Education (May 1, 2013). "2013-2014 Estimated State Property Tax Relief per Homestead".
- ↑ Pennsylvania Gaming Control Board (2014). "Gaming Benefits for Pennsylvanians".
- ↑ Pennsylvania Department of Education (May 2009). "Estimated Tax Relief Per Homestead and Farmstead May 1, 2009" (PDF).
- ↑ Pennsylvania Auditor General Office (2010-02-23). "Special Report Pennsylvania Property Tax Relief,".
- ↑ Pennsylvania Department of Education, (May 2010). "Tax Relief per Homestead 5-1-10. Report".
- ↑ Pennsylvania Department of Education. "Property Tax/Rent Rebate Program".
- ↑ Tax Foundation (September 22, 2009). "New Census Data on Property Taxes on Homeowners,".
- ↑ PDE (January 2009). "Loyalsock Township School District Enrollment and Projections".
- ↑ Center for Rural Pennsylvania. "Research Analyzes Rural School District Enrollment and Building Capacity".
- ↑ "Research Analyzes Rural School District Enrollment and Building Capacity", The Center for Rural Pennsylvania. October 2009.
- ↑ Standard and Poors (2007). "Pennsylvania Legislative Budget and Finance Committee Study - Study of the Cost-Effectiveness of Consolidating Pennsylvania School Districts part 2" (PDF).
- ↑ Standard and Poors (2007). "Pennsylvania Legislative Budget and Finance Committee Study - Study of the Cost-Effectiveness of Consolidating Pennsylvania School Districts part 1" (PDF).
- ↑ The Center for Rural Pennsylvania. (October 2009). "Research Analyzes Rural School District Enrollment and Building Capacity" (PDF).
- ↑ Pennsylvania Department of Health, Birth Age County Reports 1990 and 2011, 2011
- ↑ Pennsylvania Department of Health, Health Statistics - Resident Live Birth rate by county, 1990
- ↑ Pennsylvania Department of Health, Health Statistics - Resident Live Birth rate by county, 2000
- ↑ Pennsylvania Department of Health, Health Statistics - Resident Live Birth rate by county, 2013
- ↑ Center for Rural Pennsylvania, Number of Children Decreasing, Number of Seniors Increasing in Rural Pennsylvania, July 2011
- ↑ Pennsylvania Department of Health, Birth Statistics, 2013
- ↑ Pennsylvania Legislative Budget and Finance Committee, Study of the Cost Effectiveness of Consolidating Pennsylvania School Districts, 2007.
- ↑ Loyalsock Township School District Board. "LTSD Extracurricular Activities Policy 122".
- ↑ Loyalsock Township School District Board. "LTSD Interscholastic Athletics Policy 123".
- ↑ "Extra-Curricular Academic Eligibility" (PDF). October 11, 1995.
- ↑ Loyalsock Township School District Board (October 15, 2009). "Student Code of Conduct For Extracurricular Activities".
- ↑ Fagnano v. Loyalsock Township School District, SLIE Vol. 50, No. 3 (Court of Common Pleas of Lycoming County, 2013)
- ↑ University of Pittsburgh’s tri-State Area School Study Council (2013). "Education Law Report August 2013" (PDF). Education Law Report.
- ↑ "Home-Schooled, Charter School Children Can Participate in School District Extracurricular Activities, Pennsylvania Office of the Governor Press Release,". November 10, 2005.
- ↑ PA General Assembly (July 1, 2012). "Senate Bill 200 of Session 2011 Safety in Youth Sports Act".
- ↑ UMPC Sports Medicine (2014). "Managing Concussions in Student Athletes: The Safety in Youth Sports Act".
- ↑ Loyalsock Township School Board, Loyalsock Township School District Teacher Union Contract, 2014
- ↑ "Pennsylvania Heartland Athletic Conference School list". 2012.
- ↑ Pennsylvania Interscholastic Athletics Association (2012). "PIAA School Directory".
Lycoming County, Pennsylvania Schools | |||||||||||||||||||||||||||||||||
|---|---|---|---|---|---|---|---|---|---|---|---|---|---|---|---|---|---|---|---|---|---|---|---|---|---|---|---|---|---|---|---|---|---|
| |||||||||||||||||||||||||||||||||
| |||||||||||||||||||||||||||||||||