West Dorset (UK Parliament constituency)
Coordinates: 50°47′20″N 2°35′53″W / 50.7889°N 2.5980°W
| West Dorset | |
|---|---|
|
County constituency for the House of Commons | |
|
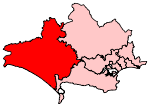
Boundary of West Dorset in Dorset. | |
|
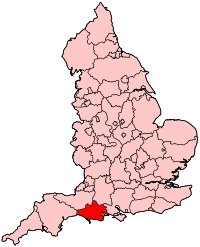
Location of Dorset within England. | |
| County | Dorset |
| Electorate | 76,779 (December 2010)[1] |
| Major settlements | Dorchester, Bridport and Sherborne |
| Current constituency | |
| Created | 1885 |
| Member of parliament | Oliver Letwin (Conservative) |
| Number of members | One |
| Overlaps | |
| European Parliament constituency | South West England |
West Dorset is a constituency[n 1] represented in the House of Commons of the UK Parliament since 1997 by Oliver Letwin, a Conservative.[n 2]
History
The seat was created under the Redistribution of Seats Act 1885.
- Political history
West Dorset has been served only by Conservative MPs. Historically there have mostly been large majorities; thus the seat can be considered a safe seat. The closest result in recent years was in 2001, when the present member, Oliver Letwin, only just held his seat, with a majority of 2.8% over the Liberal Democrat candidate, Simon Green. The Liberal Democrats have come second since then.
- Prominent frontbenchers
Oliver Letwin, with a settled background in policy formulation, was appointed Minister of State for Policy (a Cabinet Office role) in the Conservative-Liberal Democrat Coalition on 12 May 2010.
Boundaries
1885-1918: The Municipal Boroughs of Bridport and Lyme Regis, the Sessional Divisions of Bridport and Cerne, and part of the Sessional Divisions of Dorchester and Sherborne.
1918-1950: The Municipal Boroughs of Bridport, Dorchester, and Lyme Regis, the Rural Districts of Beaminster, Bridport, Cerne, and Dorchester, and part of the Rural District of Weymouth.
1950-1983: The Municipal Boroughs of Bridport, Dorchester, and Lyme Regis, the Urban District of Sherborne, the Rural Districts of Beaminster, Bridport, and Sherborne, and part of the Rural District of Dorchester.
1983-present: The District of West Dorset except the ward of Overmoigne.
The West Dorset constituency covers most of the West Dorset district and includes the towns of Dorchester, the county town of Dorset; Bridport, Lyme Regis and Beaminster to the west; and Sherborne to the north.
Constituency profile
Aside from tourist areas, including the Jurassic Coast which is a UNESCO World Heritage Site, the seat draws on managerial and advanced professional skills in sectors such as mechanical engineering, manufacturing, reconditioning, defence, art and design, which support local trades and retail. A slightly greater than average proportion of people are retired.[2] Workless claimants who were registered jobseekers were in November 2012 significantly lower than the national average of 3.8%, at 1.4% of the population based on a statistical compilation by The Guardian.[3]
Members of Parliament
| Election | Member[4] | Party | Notes | |
|---|---|---|---|---|
| 1885 | Henry Farquharson | Conservative | Died 1895 | |
| 1895 by-election | Robert Williams | Conservative | ||
| 1922 | Philip Colfox | Conservative | Resigned 1941 | |
| 1941 by-election | Simon Digby | Conservative | ||
| Feb 1974 | Jim Spicer | Conservative | ||
| 1997 | Oliver Letwin | Conservative | Retiring at next general election | |
Elections
Elections in the 2010s
| Party | Candidate | Votes | % | ± | |
|---|---|---|---|---|---|
| Conservative | Oliver Letwin | 28,329 | 50.2 | +2.6 | |
| Liberal Democrat | Ros Kayes | 12,199 | 21.6 | −19.1 | |
| UKIP | David Glossop | 7,055 | 12.5 | +8.7 | |
| Labour | Rachel Rogers | 5,633 | 10.0 | +3.3 | |
| Green | Peter Barton | 3,242 | 5.7 | +4.6 | |
| Majority | 16,130 | 28.6 | |||
| Turnout | 56,643 | 72.6 | −2.0 | ||
| Conservative hold | Swing | +10.9 | |||
| Party | Candidate | Votes | % | ± | |
|---|---|---|---|---|---|
| Conservative | Oliver Letwin | 27,287 | 47.6 | +1.1 | |
| Liberal Democrat | Sue Farrant | 23,364 | 40.7 | −1.2 | |
| Labour | Steve Bick | 3,815 | 6.7 | −1.1 | |
| UKIP | Oliver Chisholm | 2,196 | 3.8 | +1.8 | |
| Green | Susan Greene | 675 | 1.2 | −0.6 | |
| Majority | 3,923 | 6.8 | |||
| Turnout | 57,337 | 74.6 | −1.8 | ||
| Conservative hold | Swing | +1.1 | |||
Elections in the 2000s
| Party | Candidate | Votes | % | ± | |
|---|---|---|---|---|---|
| Conservative | Oliver Letwin | 24,763 | 46.5 | +1.9 | |
| Liberal Democrat | Justine McGuinness | 22,302 | 41.9 | +0.1 | |
| Labour | Dave Roberts | 4,124 | 7.7 | −5.9 | |
| UKIP | Linda Guest | 1,084 | 2.0 | N/A | |
| Green | Susan Greene | 952 | 1.8 | N/A | |
| Majority | 2,461 | 4.6 | |||
| Turnout | 53,225 | 76.3 | +6.8 | ||
| Conservative hold | Swing | +0.9 | |||
| Party | Candidate | Votes | % | ± | |
|---|---|---|---|---|---|
| Conservative | Oliver Letwin | 22,126 | 44.6 | +3.5 | |
| Liberal Democrat | Simon Green | 20,712 | 41.8 | +4.1 | |
| Labour | Richard Hyde | 6,733 | 13.6 | −4.1 | |
| Majority | 1,414 | 2.8 | |||
| Turnout | 49,571 | 69.5 | −6.6 | ||
| Conservative hold | Swing | ||||
Elections in the 1990s
| Party | Candidate | Votes | % | ± | |
|---|---|---|---|---|---|
| Conservative | Oliver Letwin | 22,036 | 41.1 | ||
| Liberal Democrat | Robin AS Legg | 20,196 | 37.7 | ||
| Labour | Robert Bygraves | 9,491 | 17.7 | ||
| UKIP | P. Jenkins | 1,590 | 3.0 | ||
| Natural Law | Mark Griffiths | 239 | 0.4 | ||
| Majority | 1,840 | 3.4 | |||
| Turnout | 53,552 | 76.1 | |||
| Conservative hold | Swing | ||||
| Party | Candidate | Votes | % | ± | |
|---|---|---|---|---|---|
| Conservative | Sir James Wilton Spicer | 27,766 | 50.8 | −5.3 | |
| Liberal Democrat | Robin A.S. Legg | 19,756 | 36.2 | +4.5 | |
| Labour | JPB Mann | 7,082 | 13.0 | +0.8 | |
| Majority | 8,010 | 14.7 | −9.9 | ||
| Turnout | 54,604 | 81.2 | +2.9 | ||
| Conservative hold | Swing | −4.9 | |||
Elections in the 1980s
| Party | Candidate | Votes | % | ± | |
|---|---|---|---|---|---|
| Conservative | Sir James Wilton Spicer | 28,305 | 56.20 | ||
| Liberal | Trevor Jones | 15,941 | 31.65 | ||
| Labour | D Watson | 6,123 | 12.16 | ||
| Majority | 12,364 | 24.55 | |||
| Turnout | 78.26 | ||||
| Conservative hold | Swing | ||||
| Party | Candidate | Votes | % | ± | |
|---|---|---|---|---|---|
| Conservative | Sir James Wilton Spicer | 27,030 | 59.7 | ||
| Liberal | Trevor Jones | 13,078 | 28.9 | ||
| Labour | D Cash | 5,168 | 11.4 | ||
| Majority | 13,952 | 30.82 | |||
| Turnout | 45,276 | 74.23 | |||
| Conservative hold | Swing | ||||
Elections in the 1970s
| Party | Candidate | Votes | % | ± | |
|---|---|---|---|---|---|
| Conservative | Sir James Wilton Spicer | 26,281 | 58.71 | ||
| Liberal | Trevor Jones | 9,776 | 21.84 | ||
| Labour | HJ Skevington | 7,999 | 17.87 | ||
| National Front | J Tillotson | 514 | 1.15 | ||
| Wessex Regionalist | G McEwan | 192 | 0.43 | ||
| Majority | 16,505 | 36.87 | |||
| Turnout | 79.00 | ||||
| Conservative hold | Swing | ||||
| Party | Candidate | Votes | % | ± | |
|---|---|---|---|---|---|
| Conservative | Sir James Wilton Spicer | 20,517 | 49.20 | ||
| Liberal | RM Angus | 11,832 | 28.37 | ||
| Labour | PJ Dawe | 9,350 | 22.42 | ||
| Majority | 8,685 | 20.83 | |||
| Turnout | 77.84 | ||||
| Conservative hold | Swing | ||||
| Party | Candidate | Votes | % | ± | |
|---|---|---|---|---|---|
| Conservative | Sir James Wilton Spicer | 21,634 | 49.00 | ||
| Liberal | R Angus | 14,183 | 32.12 | ||
| Labour | MF Cross | 8,333 | 18.87 | ||
| Majority | 7,451 | 16.88 | |||
| Turnout | 83.12 | ||||
| Conservative hold | Swing | ||||
| Party | Candidate | Votes | % | ± | |
|---|---|---|---|---|---|
| Conservative | Simon Wingfield Digby | 21,081 | 54.15 | ||
| Labour | George Sakwa | 10,536 | 27.06 | ||
| Liberal | Allan Percival | 7,314 | 18.79 | ||
| Majority | 10,545 | 27.09 | |||
| Turnout | 38,931 | 76.76 | |||
| Conservative hold | Swing | ||||
Elections in the 1960s
| Party | Candidate | Votes | % | ± | |
|---|---|---|---|---|---|
| Conservative | Simon Wingfield Digby | 17,709 | 47.68 | ||
| Labour | F Donald Shirreff | 11,757 | 31.65 | ||
| Liberal | Michael Aza Pinney | 7,676 | 20.67 | ||
| Majority | 5,952 | 16.02 | |||
| Turnout | 80.85 | ||||
| Conservative hold | Swing | ||||
| Party | Candidate | Votes | % | ± | |
|---|---|---|---|---|---|
| Conservative | Simon Wingfield Digby | 17,841 | 48.59 | ||
| Labour | Leslie William King | 10,631 | 28.96 | ||
| Liberal | Michael Aza Pinney | 8,242 | 22.45 | ||
| Majority | 7,210 | 19.64 | |||
| Turnout | 81.68 | ||||
| Conservative hold | Swing | ||||
Elections in the 1950s
| Party | Candidate | Votes | % | ± | |
|---|---|---|---|---|---|
| Conservative | Simon Wingfield Digby | 19,747 | 54.65 | ||
| Labour | Leslie William King | 11,536 | 31.93 | ||
| Liberal | John H. Goodden | 4,850 | 13.42 | ||
| Majority | 8,211 | 22.72 | |||
| Turnout | 36,133 | 81.92 | |||
| Conservative hold | Swing | ||||
| Party | Candidate | Votes | % | ± | |
|---|---|---|---|---|---|
| Conservative | Simon Wingfield Digby | 21,007 | 59.59 | ||
| Labour | Leslie William King | 14,244 | 40.41 | ||
| Majority | 6,763 | 19.19 | |||
| Turnout | 35,251 | 80.07 | |||
| Conservative hold | Swing | ||||
| Party | Candidate | Votes | % | ± | |
|---|---|---|---|---|---|
| Conservative | Simon Wingfield Digby | 21,739 | 60.31 | ||
| Labour | Cambreth John Kane | 14,308 | 39.69 | ||
| Majority | 7,431 | 20.61 | |||
| Turnout | 82.11 | ||||
| Conservative hold | Swing | ||||
| Party | Candidate | Votes | % | ± | |
|---|---|---|---|---|---|
| Conservative | Simon Wingfield Digby | 18,771 | 51.75 | ||
| Labour | Cambreth John Kane | 11,967 | 33.00 | ||
| Liberal | Colin Grant Cameron | 5,531 | 15.25 | ||
| Majority | 6,804 | 18.76 | |||
| Turnout | 83.95 | ||||
| Conservative hold | Swing | ||||
Elections in the 1940s
| Party | Candidate | Votes | % | ± | |
|---|---|---|---|---|---|
| Conservative | Simon Wingfield Digby | 13,399 | 50.1 | ||
| Labour | Cambreth John Kane | 8,215 | 30.8 | ||
| Liberal | George Harold Newsom | 5,098 | 19.1 | ||
| Majority | 5,184 | 19.3 | |||
| Turnout | 74.7 | ||||
| Conservative hold | Swing | ||||
| Party | Candidate | Votes | % | ± | |
|---|---|---|---|---|---|
| Conservative | Simon Wingfield Digby | unopposed | n/a | n/a | |
| Conservative hold | Swing | n/a | |||
General Election 1939/40:
Another general election was required to take place before the end of 1940. The political parties had been making preparations for an election to take place from 1939, and by the end of this year the following candidates had been selected:
- Conservative: Simon Wingfield Digby
- Liberal: George Edwin Chappell
- British Union: Ralph Jebb
Elections in the 1930s
| Party | Candidate | Votes | % | ± | |
|---|---|---|---|---|---|
| Conservative | William Philip Colfox | 13,825 | 54.1 | -6.1 | |
| Liberal | George Edwin Chappell | 11,735 | 45.9 | +6.1 | |
| Majority | 2,090 | 8.2 | |||
| Turnout | 77.9 | -3.7 | |||
| Conservative hold | Swing | -6.1 | |||
| Party | Candidate | Votes | % | ± | |
|---|---|---|---|---|---|
| Conservative | William Philip Colfox | 15,510 | 60.2 | ||
| Liberal | George Edwin Chappell | 10,271 | 39.8 | ||
| Majority | 5,239 | 20.4 | |||
| Turnout | 81.6 | ||||
| Conservative hold | Swing | ||||
Elections in the 1920s
| Party | Candidate | Votes | % | ± | |
|---|---|---|---|---|---|
| Unionist | William Philip Colfox | 12,247 | 49.1 | -19.2 | |
| Liberal | George Edwin Chappell | 7,921 | 31.8 | n/a | |
| Labour | Thomas Robins | 4,770 | 19.1 | -12.6 | |
| Majority | 4,326 | 17.3 | -19.3 | ||
| Turnout | 80.6 | +7.4 | |||
| Unionist hold | Swing | n/a | |||
| Party | Candidate | Votes | % | ± | |
|---|---|---|---|---|---|
| Unionist | William Philip Colfox | 12,426 | 68.3 | +9.5 | |
| Labour | Mrs Louie Simpson | 5,764 | 31.7 | -9.5 | |
| Majority | 6,662 | 36.6 | +19.0 | ||
| Turnout | 73.2 | +2.3 | |||
| Unionist hold | Swing | +9.5 | |||
| Party | Candidate | Votes | % | ± | |
|---|---|---|---|---|---|
| Unionist | William Philip Colfox | 10,100 | 58.8 | -3.3 | |
| Labour | Mrs Louie Simpson | 7,087 | 41.2 | +3.3 | |
| Majority | 3,013 | 17.6 | -6.6 | ||
| Turnout | 70.9 | -7.6 | |||
| Unionist hold | Swing | -3.3 | |||
| Party | Candidate | Votes | % | ± | |
|---|---|---|---|---|---|
| Unionist | William Philip Colfox | 11,649 | 62.1 | n/a | |
| Labour | T C Duke | 7,101 | 37.9 | n/a | |
| Majority | 4,548 | 24.2 | n/a | ||
| Turnout | 78.5 | n/a | |||
| Unionist hold | Swing | n/a | |||
Elections in the 1910s
| Party | Candidate | Votes | % | ± | |
|---|---|---|---|---|---|
| Unionist | unopposed | n/a | n/a | ||
| Unionist hold | Swing | n/a | |||
- endorsed by Coalition Government
General Election 1914/15:
Another General Election was required to take place before the end of 1915. The political parties had been making preparations for an election to take place and by the July 1914, the following candidates had been selected:
- Unionist: Robert Williams
- Liberal:
| Party | Candidate | Votes | % | ± | |
|---|---|---|---|---|---|
| Conservative | Robert Williams | unopposed | n/a | n/a | |
| Conservative hold | Swing | n/a | |||
| Party | Candidate | Votes | % | ± | |
|---|---|---|---|---|---|
| Conservative | Robert Williams | 4,011 | 59.2 | +3.2 | |
| Liberal | William Saunders Edwards | 2,759 | 40.8 | -3.2 | |
| Majority | 1,252 | 18.3 | +6.4 | ||
| Turnout | |||||
| Conservative hold | Swing | +3.2 | |||
Elections in the 1900s
| Party | Candidate | Votes | % | ± | |
|---|---|---|---|---|---|
| Conservative | Robert Williams | 3,671 | 56.4 | n/a | |
| Liberal | Johnstone J Haye | 2,834 | 43.6 | n/a | |
| Majority | 837 | 12.9 | n/a | ||
| Turnout | |||||
| Conservative hold | Swing | n/a | |||
| Party | Candidate | Votes | % | ± | |
|---|---|---|---|---|---|
| Conservative | Robert Williams | unopposed | n/a | n/a | |
| Conservative hold | Swing | n/a | |||
Elections in the 1890s
| Party | Candidate | Votes | % | ± | |
|---|---|---|---|---|---|
| Conservative | Robert Williams | unopposed | n/a | n/a | |
| Conservative hold | Swing | n/a | |||
| Party | Candidate | Votes | % | ± | |
|---|---|---|---|---|---|
| Conservative | Robert Williams | 3,538 | 60.3 | +3.6 | |
| Liberal | G W Homer | 2,825 2,325 | 39.7 | -3.6 | |
| Majority | 1,213 | 20.7 | +7.2 | ||
| Turnout | |||||
| Conservative hold | Swing | +3.6 | |||
| Party | Candidate | Votes | % | ± | |
|---|---|---|---|---|---|
| Conservative | Henry Richard Farquharson | 3,691 | 56.7 | -3.1 | |
| Liberal | CT Gatty | 2,813 | 43.3 | +3.1 | |
| Majority | 878 | 13.4 | |||
| Turnout | |||||
| Conservative hold | Swing | -3.1 | |||
Elections in the 1880s
| Party | Candidate | Votes | % | ± | |
|---|---|---|---|---|---|
| Conservative | Henry Richard Farquharson | 3,672 | 59.8 | +8.3 | |
| Liberal | H Carey G Batten | 2,467 | 40.2 | -8.3 | |
| Majority | 1,205 | 19.6 | +16.6 | ||
| Turnout | |||||
| Conservative hold | Swing | +8.3 | |||
| Party | Candidate | Votes | % | ± | |
|---|---|---|---|---|---|
| Conservative | Henry Richard Farquharson | 3,507 | 51.5 | n/a | |
| Liberal | H Carey G Batten | 3,305 | 48.5 | n/a | |
| Majority | 202 | 3.0 | n/a | ||
| Turnout | n/a | ||||
| Conservative win (new seat) | |||||
See also
Notes and references
- Notes
- ↑ A county constituency (for the purposes of election expenses and type of returning officer)
- ↑ As with all constituencies, the constituency elects one Member of Parliament (MP) by the first past the post system of election at least every five years.
- References
- ↑ "Electorate Figures - Boundary Commission for England". 2011 Electorate Figures. Boundary Commission for England. 4 March 2011. Retrieved 13 March 2011.
- ↑ 2011 Census
- ↑ Unemployment claimants by constituency The Guardian
- ↑ Leigh Rayment's Historical List of MPs – Constituencies beginning with "D" (part 2)
- ↑ "Election Data 2015". Electoral Calculus. Archived from the original on 17 October 2015. Retrieved 17 October 2015.
- ↑ "Election Data 2010". Electoral Calculus. Archived from the original on 17 October 2015. Retrieved 17 October 2015.
- ↑ "Election Data 2005". Electoral Calculus. Archived from the original on 15 October 2011. Retrieved 18 October 2015.
- ↑ "Election Data 2001". Electoral Calculus. Archived from the original on 15 October 2011. Retrieved 18 October 2015.
- ↑ "Election Data 1997". Electoral Calculus. Archived from the original on 15 October 2011. Retrieved 18 October 2015.
- ↑ "Election Data 1992". Electoral Calculus. Archived from the original on 15 October 2011. Retrieved 18 October 2015.
- ↑ "Politics Resources". Election 1992. Politics Resources. 9 April 1992. Retrieved 2010-12-06.
- ↑ "Election Data 1987". Electoral Calculus. Archived from the original on 15 October 2011. Retrieved 18 October 2015.
- ↑ "Election Data 1983". Electoral Calculus. Archived from the original on 15 October 2011. Retrieved 18 October 2015.
- ↑ Craig, F. W. S. (1983). British parliamentary election results 1918-1949 (3 ed.). Chichester: Parliamentary Research Services. ISBN 0-900178-06-X.
- ↑ Craig, F. W. S. (1983). British parliamentary election results 1918-1949 (3 ed.). Chichester: Parliamentary Research Services. ISBN 0-900178-06-X.
- ↑ Craig, F. W. S. (1983). British parliamentary election results 1918-1949 (3 ed.). Chichester: Parliamentary Research Services. ISBN 0-900178-06-X.
- ↑ Craig, F. W. S. (1983). British parliamentary election results 1918-1949 (3 ed.). Chichester: Parliamentary Research Services. ISBN 0-900178-06-X.
- ↑ Craig, F. W. S. (1983). British parliamentary election results 1918-1949 (3 ed.). Chichester: Parliamentary Research Services. ISBN 0-900178-06-X.
- ↑ Craig, F. W. S. (1983). British parliamentary election results 1918-1949 (3 ed.). Chichester: Parliamentary Research Services. ISBN 0-900178-06-X.
- ↑ Craig, F. W. S. (1983). British parliamentary election results 1918-1949 (3 ed.). Chichester: Parliamentary Research Services. ISBN 0-900178-06-X.
- ↑ Craig, F. W. S. (1983). British parliamentary election results 1918-1949 (3 ed.). Chichester: Parliamentary Research Services. ISBN 0-900178-06-X.
- ↑ Craig, F. W. S. (1983). British parliamentary election results 1918-1949 (3 ed.). Chichester: Parliamentary Research Services. ISBN 0-900178-06-X.
- ↑ British Parliamentary Election Results 1885-1918, FWS Craig
- ↑ British Parliamentary Election Results 1885-1918, FWS Craig
- ↑ British Parliamentary Election Results 1885-1918, FWS Craig
- ↑ British Parliamentary Election Results 1885-1918, FWS Craig
- ↑ British Parliamentary Election Results 1885-1918, FWS Craig
- ↑ The Constitiutional Year Book, 1904, published by Conservative Central Office, page 143 (167 in web page), Dorsetshire
- ↑ British Parliamentary Election Results 1885-1918, FWS Craig
- ↑ British Parliamentary Election Results 1885-1918, FWS Craig
- ↑ British Parliamentary Election Results 1885-1918, FWS Craig