Weston-super-Mare (UK Parliament constituency)
| Weston-super-Mare | |
|---|---|
|
County constituency for the House of Commons | |
|
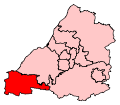
Boundary of Weston-super-Mare in Avon. | |
|
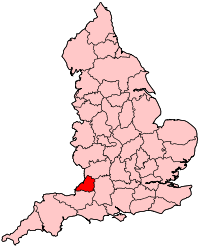
Location of Avon within England. | |
| County | Somerset |
| Electorate | 78,778 (December 2010)[1] |
| Major settlements | Weston-super-Mare |
| Current constituency | |
| Created | 1918 |
| Member of parliament | John Penrose (Conservative) |
| Number of members | One |
| Created from | part North Somerset, part Wells |
| Overlaps | |
| European Parliament constituency | South West England |
Weston-super-Mare is a constituency[n 1] represented in the House of Commons of the UK Parliament since 2005 by John Penrose, a Conservative.[n 2]
History
The seat was created under the Representation of the People Act 1918. Its forerunner was the North Somerset division created in 1885.
The by-election of 1934 was triggered by the acceptance of the appointment of Lord Erskine to the position of Governor of Madras Presidency, that of 1958 by the death of Ian Orr-Ewing and that of 1969 by the death of David Webster following an accident.
- Political history
The seat has alternated in representation between 1992 and 2005: in the election of 1997 the fresh Conservative candidate, Margaret Daly failed to hold the seat which led to Weston Super Mare's first marginal majority since 1923, obtained by Brian Cotter, a Liberal Democrat. Since this date all of the majorities have been lower than 3,000 votes, remaining strongly marginal and seeing in 2005 Cotter lose the seat to John Penrose.
In terms of other parties, the last occasion on which the Labour candidate achieved second place was at the 1970 general election.
- Frontbenchers
- Jerry Wiggin was a Minister for the Armed Services from 1981–1983.
- Brian Cotter was the Liberal Democrat Small Business Spokesman (1997–2005),
- John Penrose was appointed the Minister for Tourism and Heritage (2010–2012).
Boundaries
1918-1950: The Urban Districts of Clevedon, Portishead, and Weston-super-Mare, and the Rural Districts of Axbridge and Long Ashton.
1950-1983: The Municipal Borough of Weston-super-Mare, the Urban District of Clevedon, the Rural District of Axbridge, and in the Rural District of Long Ashton the civil parishes of Kenn, Kingston Seymour, and Yatton.
1983-1997: The District of Woodspring wards of Banwell, Blagdon, Churchill, Congresbury, Hutton, Locking, Weston-super-Mare Ashcombe, Weston-super-Mare East, Weston-super-Mare Ellenborough, Weston-super-Mare North, Weston-super-Mare South, Weston-super-Mare Uphill, Weston-super-Mare West, Winscombe, Wrington, and Yatton.
1997-2010: The District of Woodspring wards of Banwell, Blagdon, Churchill, Congresbury, Hutton, Locking, Weston-super-Mare Ashcombe, Weston-super-Mare East, Weston-super-Mare Ellenborough, Weston-super-Mare North, Weston-super-Mare South, Weston-super-Mare Uphill, Weston-super-Mare West, and Winscombe.
2010–present: The District of North Somerset wards of Banwell and Winscombe, Blagdon and Churchill, Congresbury, Hutton and Locking, Kewstoke, Weston-super-Mare Central, Weston-super-Mare Clarence and Uphill, Weston-super-Mare East, Weston-super-Mare Milton and Old Worle, Weston-super-Mare North Worle, Weston-super-Mare South, Weston-super-Mare South Worle, and Weston-super-Mare West.
The constituency covers the southern half of North Somerset Unitary Authority, including its only town, Weston-super-Mare on the Bristol Channel.
History of boundaries
- Changes for 1950
Under the first periodic review the Weston constituency lost Portishead, Gordano, Nailsea, Backwell and Long Ashton wards/areas to North Somerset constituency.
- Changes for 1983
Under the third periodic review the Weston constituency lost Berrow, Brent Knoll, Axbridge, Cheddar, and Mark and Wedmore wards to Wells, and Clevedon to Woodspring which temporarily took the place of North Somerset until 2010.
- Changes for 1997
Under the fourth periodic review the Weston constituency lost Yatton and Wrington to Woodspring.
- Changes for 2010
Parliament accepted the Boundary Commission's Fifth Periodic Review of Westminster constituencies by making slight changes to this constituency for the 2010 general election, namely the loss of only 181 electors in Butcombe (in the ward of Wrington, no longer in the seat at all) to North Somerset.
Constituency profile
The town grew as a relatively late-Victorian affluent resort with many green spaces and gardens south of the headland, Sand Point which denotes the sandier beach of the town and of Burnham on Sea relative to northerly shores such as at Clevedon.
Work in tourism and visitor attractions is seasonal but other areas of the economy locally, such as customer services operations, freight, haulage and distribution, social, care, elderly and health services as well as retail, manufacturing and materials/foods processing provide employment. Workless claimants who were registered jobseekers were in November 2012 lower than the national average of 3.8%, at 3.5% of the population based on a statistical compilation by The Guardian.[2]
Members of Parliament
Elections
Elections in the 2010s
| Party | Candidate | Votes | % | ± | |
|---|---|---|---|---|---|
| Conservative | John Penrose | 25,203 | 48.0 | +3.7 | |
| Labour | Tim Taylor | 9,594 | 18.3 | +7.4 | |
| UKIP | Ernie Warrender | 9,366 | 17.8 | +15.1 | |
| Liberal Democrat | John Munro | 5,486 | 10.4 | -28.8 | |
| Green | Richard Lawson | 2,592 | 4.9 | +4.9 | |
| English Democrat | Ronald Lavelle | 311 | 0.6 | +0.1 | |
| Majority | 15,609 | 29.7 | +24.6 | ||
| Turnout | 52,552 | 66.0 | -1.2 | ||
| Conservative hold | Swing | ||||
| Party | Candidate | Votes | % | ± | |
|---|---|---|---|---|---|
| Conservative | John Penrose | 23,356 | 44.3 | +4.0 | |
| Liberal Democrat | Mike Bell | 20,665 | 39.2 | +3.1 | |
| Labour | David Bradley | 5,772 | 10.9 | -7.8 | |
| UKIP | Paul Spencer | 1,406 | 2.7 | +0.2 | |
| BNP | Peryn Parsons | 1,098 | 2.1 | +0.5 | |
| English Democrat | John Peverelle | 275 | 0.5 | +0.5 | |
| Independent | Steve Satch | 144 | 0.3 | +0.3 | |
| Majority | 2,691 | 5.1 | |||
| Turnout | 52,716 | 67.2 | +1.5 | ||
| Conservative hold | Swing | +0.4 | |||
Elections in the 2000s
| Party | Candidate | Votes | % | ± | |
|---|---|---|---|---|---|
| Conservative | John Penrose | 19,804 | 40.3 | +1.6 | |
| Liberal Democrat | Brian Cotter | 17,725 | 36.1 | −3.4 | |
| Labour | Damien Egan | 9,169 | 18.7 | −1.1 | |
| UKIP | Paul Spencer | 1,207 | 2.5 | +1.1 | |
| BNP | Clive Courtney | 778 | 1.6 | ||
| Independent | William Human | 225 | 0.5 | ||
| Demanding Honesty in Politics and Whitehall | Paul Hemingway-Arnold | 187 | 0.4 | ||
| Majority | 2,079 | 4.2 | |||
| Turnout | 49,095 | 65.5 | +2.7 | ||
| Conservative gain from Liberal Democrat | Swing | +2.5 | |||
| Party | Candidate | Votes | % | ± | |
|---|---|---|---|---|---|
| Liberal Democrat | Brian Cotter | 18,424 | 39.5 | -0.6 | |
| Conservative | John Penrose | 18,086 | 38.7 | +1.0 | |
| Labour | Derek Kraft | 9,235 | 19.8 | +1.9 | |
| UKIP | Bill Lukins | 650 | 1.4 | ||
| Independent | John Peverelle | 206 | 0.4 | ||
| Independent | Richard Sibley | 79 | 0.2 | ||
| Majority | 338 | 0.8 | |||
| Turnout | 46,680 | 62.8 | -10.8 | ||
| Liberal Democrat hold | Swing | -0.8 | |||
Elections in the 1990s
| Party | Candidate | Votes | % | ± | |
|---|---|---|---|---|---|
| Liberal Democrat | Brian Cotter | 21,407 | 40.1 | ||
| Conservative | Mrs. Margaret Daly | 20,133 | 37.7 | ||
| Labour | Derek Kraft | 9,557 | 17.9 | ||
| Referendum | Tom Sewell | 2,280 | 4.3 | ||
| Majority | 1,274 | 2.4 | |||
| Turnout | 53,377 | 73.7 | |||
| Liberal Democrat gain from Conservative | Swing | ||||
| Party | Candidate | Votes | % | ± | |
|---|---|---|---|---|---|
| Conservative | Alfred William 'Jerry' Wiggin | 30,022 | 47.7 | −1.7 | |
| Liberal Democrat | Brian Cotter | 24,680 | 39.3 | +3.7 | |
| Labour | David E. Murray | 6,913 | 11.0 | −0.4 | |
| Green | Richard Hugh Lawson | 1,262 | 2.0 | −1.6 | |
| Majority | 5,342 | 8.5 | −5.4 | ||
| Turnout | 62,877 | 79.7 | +4.1 | ||
| Conservative hold | Swing | −2.7 | |||
Elections in the 1980s
| Party | Candidate | Votes | % | ± | |
|---|---|---|---|---|---|
| Conservative | Alfred William 'Jerry' Wiggin | 28,547 | 49.4 | ||
| Social Democratic | John Richard Crockford-Hawley | 20,549 | 35.6 | ||
| Labour | Paul James Loach | 6,584 | 11.4 | ||
| Green | Richard Hugh Lawson | 2,067 | 3.6 | ||
| Majority | 7,998 | 13.8 | |||
| Turnout | 57,747 | 75.7 | |||
| Conservative hold | Swing | ||||
| Party | Candidate | Votes | % | ± | |
|---|---|---|---|---|---|
| Conservative | Alfred William 'Jerry' Wiggin | 27,948 | 53.6 | ||
| Social Democratic | Jonathan Marks | 18,457 | 35.4 | ||
| Labour | Roger Berry | 5,781 | 11.1 | ||
| Majority | 9,491 | 18.2 | |||
| Turnout | 52,186 | 73.1 | |||
| Conservative hold | Swing | ||||
Elections in the 1970s
| Party | Candidate | Votes | % | ± | |
|---|---|---|---|---|---|
| Conservative | Alfred William 'Jerry' Wiggin | 40,618 | 56.9 | ||
| Liberal | Rowland Morgan | 16,305 | 22.9 | ||
| Labour | Alan Taylor | 14,420 | 20.2 | ||
| Majority | 24,313 | 34.0 | |||
| Turnout | 71,343 | 77.5 | |||
| Conservative hold | Swing | ||||
| Party | Candidate | Votes | % | ± | |
|---|---|---|---|---|---|
| Conservative | Alfred William 'Jerry' Wiggin | 31,028 | 48.8 | ||
| Liberal | Roger Miller | 18,169 | 28.6 | ||
| Labour | Peter Owen | 14,057 | 22.1 | ||
| United Democratic | Eric Iszatt | 296 | 0.5 | ||
| Majority | 12,859 | 20.2 | |||
| Turnout | 63,550 | 74.8 | |||
| Conservative hold | Swing | ||||
| Party | Candidate | Votes | % | ± | |
|---|---|---|---|---|---|
| Conservative | Alfred William 'Jerry' Wiggin | 33,838 | 50.0 | ||
| Liberal | Philip Golding | 20,237 | 29.9 | ||
| Labour | Roy Morris | 13,542 | 20.0 | ||
| Majority | 13,601 | 20.1 | |||
| Turnout | 67,617 | 80.1 | |||
| Conservative hold | Swing | ||||
| Party | Candidate | Votes | % | ± | |
|---|---|---|---|---|---|
| Conservative | Alfred William 'Jerry' Wiggin | 33,816 | 57.9 | ||
| Labour | Sarah Palmer | 14,473 | 24.8 | ||
| Liberal | Edward Richard F. Deal | 10,120 | 17.3 | ||
| Majority | 19,343 | 33.1 | |||
| Turnout | 58,409 | 73.7 | |||
| Conservative hold | Swing | ||||
Elections in the 1960s
| Party | Candidate | Votes | % | ± | |
|---|---|---|---|---|---|
| Conservative | Alfred William 'Jerry' Wiggin | 29,211 | 65.7 | ||
| Liberal | Edward Richard F. Deal | 8,739 | 19.7 | ||
| Labour | Nicholas Bosanquet | 6,504 | 14.6 | ||
| Majority | 20,472 | 46.0 | |||
| Turnout | 44,454 | 60.8 | |||
| Conservative hold | Swing | ||||
| Party | Candidate | Votes | % | ± | |
|---|---|---|---|---|---|
| Conservative | David William Ernest Webster | 27,733 | 52.1 | ||
| Labour | Melvyn Butcher | 15,340 | 28.8 | ||
| Liberal | Ian McDonald | 10,173 | 19.1 | ||
| Majority | 12,393 | 23.3 | |||
| Turnout | 53,246 | 78.5 | |||
| Conservative hold | Swing | ||||
| Party | Candidate | Votes | % | ± | |
|---|---|---|---|---|---|
| Conservative | David William Ernest Webster | 27,143 | 53.1 | ||
| Labour | Jessie Stephen | 12,248 | 23.9 | ||
| Liberal | Ian McDonald | 11,771 | 23.0 | ||
| Majority | 14,895 | 29.2 | |||
| Turnout | 51,162 | 79.0 | |||
| Conservative hold | Swing | ||||
Elections in the 1950s
| Party | Candidate | Votes | % | ± | |
|---|---|---|---|---|---|
| Conservative | David William Ernest Webster | 27,881 | 57.5 | ||
| Labour | Edward Hampton | 10,977 | 22.7 | ||
| Liberal | Edward Taylor | 9,609 | 19.8 | ||
| Majority | 16,904 | 34.8 | |||
| Turnout | 48,467 | 79.7 | |||
| Conservative hold | Swing | ||||
| Party | Candidate | Votes | % | ± | |
|---|---|---|---|---|---|
| Conservative | David William Ernest Webster | 21,271 | 49.3 | ||
| Labour | Edward Hampton | 11,295 | 26.2 | ||
| Liberal | Edward Taylor | 10,588 | 24.5 | ||
| Majority | 9,976 | 23.1 | |||
| Turnout | 43,154 | 72.2 | |||
| Conservative hold | Swing | ||||
| Party | Candidate | Votes | % | ± | |
|---|---|---|---|---|---|
| Conservative | Sir Ian Leslie Orr-Ewing | 27,357 | 62.7 | ||
| Labour | Robert Andrews | 16,275 | 37.3 | ||
| Majority | 11,082 | 25.4 | |||
| Turnout | 43,632 | 73.8 | |||
| Conservative hold | Swing | ||||
| Party | Candidate | Votes | % | ± | |
|---|---|---|---|---|---|
| Conservative | Ian Leslie Orr-Ewing | 30,485 | 65.7 | ||
| Labour | Robert Andrews | 15,942 | 34.3 | ||
| Majority | 14,543 | 31.4 | |||
| Turnout | 46,427 | 79.7 | |||
| Conservative hold | Swing | ||||
| Party | Candidate | Votes | % | ± | |
|---|---|---|---|---|---|
| Conservative | Ian Leslie Orr-Ewing | 26,767 | 56.4 | ||
| Labour | Michael Hill | 13,294 | 28.0 | ||
| Liberal | Frederick Archie Kew | 7,394 | 15.6 | ||
| Majority | 13,473 | 53.6 | |||
| Turnout | 47,455 | 83.1 | |||
| Conservative hold | Swing | ||||
Elections in the 1940s
| Party | Candidate | Votes | % | ± | |
|---|---|---|---|---|---|
| Conservative | Ian Leslie Orr-Ewing | 30,720 | 49.5 | ||
| Labour | Hugh Bruce Oliphant Cardew | 20,542 | 33.1 | ||
| Liberal | Stanley Sanger | 10,804 | 17.4 | ||
| Majority | 10,178 | 16.4 | |||
| Turnout | 62,066 | 73.7 | |||
| Conservative hold | Swing | ||||
Elections in the 1930s
| Party | Candidate | Votes | % | ± | |
|---|---|---|---|---|---|
| Conservative | Ian Leslie Orr-Ewing | 27,735 | 65.7 | ||
| Liberal | Henry Folliott Scott-Stokes | 7,883 | 18.7 | ||
| Labour | George Elvin | 6,625 | 15.7 | ||
| Majority | 19,852 | 47.0 | |||
| Turnout | 42,243 | 66.4 | |||
| Conservative hold | Swing | ||||
| Party | Candidate | Votes | % | ± | |
|---|---|---|---|---|---|
| Conservative | Ian Leslie Orr-Ewing | 21,203 | 61.5 | ||
| Liberal | Henry Folliott Scott-Stokes | 7,551 | 21.9 | ||
| Labour | Albert Edward Millett | 5,715 | 16.6 | ||
| Majority | 13,652 | 39.6 | |||
| Turnout | 34,469 | ||||
| Conservative hold | Swing | ||||
| Party | Candidate | Votes | % | ± | |
|---|---|---|---|---|---|
| Conservative | Lord John Erskine | 35,255 | 85.7 | ||
| Labour | Bernard Craig | 5,905 | 14.3 | ||
| Majority | 29,350 | 71.4 | |||
| Turnout | 41,160 | 71.8 | |||
| Conservative hold | Swing | ||||
Elections in the 1920s
| Party | Candidate | Votes | % | ± | |
|---|---|---|---|---|---|
| Unionist | John Francis Ashley Erskine, Lord Erskine | 22,898 | 52.2 | -3.6 | |
| Liberal | William Ewart Morse | 16,219 | 37.0 | -3.0 | |
| Labour | Constance Elizabeth Borrett | 4,766 | 10.9 | +6.7 | |
| Majority | 6,670 | 15.2 | -0.6 | ||
| Turnout | 43,883 | 79.6 | -2.1 | ||
| Unionist hold | Swing | -0.3 | |||
| Party | Candidate | Votes | % | ± | |
|---|---|---|---|---|---|
| Unionist | John Francis Ashley Erskine, Lord Erskine | 17,987 | 55.8 | ||
| Liberal | Frank Edric Joseph Murrell | 12,895 | 40.0 | ||
| Labour | Raphael Neft | 1,343 | 4.2 | ||
| Majority | 5,092 | 15.8 | |||
| Turnout | 32,225 | 81.7 | |||
| Conservative gain from Liberal | Swing | ||||
| Party | Candidate | Votes | % | ± | |
|---|---|---|---|---|---|
| Liberal | Frank Edric Joseph Murrell | 15,223 | 51.5 | +6.6 | |
| Unionist | Lord John Erskine | 14,318 | 48.5 | -6.6 | |
| Majority | 905 | 3.0 | 13.2 | ||
| Liberal gain from Unionist | Swing | +6.6 | |||
| Party | Candidate | Votes | % | ± | |
|---|---|---|---|---|---|
| Unionist | John Francis Ashley Erskine, Lord Erskine | 15,552 | 55.1 | ||
| Liberal | Frank Edric Joseph Murrell | 12,674 | 44.9 | ||
| Majority | 2,878 | 10.2 | |||
| Unionist hold | Swing | ||||
Elections in the 1910s
| Party | Candidate | Votes | % | ± | |
|---|---|---|---|---|---|
| Unionist | 13,494 | 65.5 | |||
| Liberal | Edmund Thruston | 7,104 | 34.5 | ||
| Majority | 6,390 | 31.0 | |||
| Unionist win | |||||
- endorsed by Coalition Government
See also
Notes and references
- Notes
- ↑ A county constituency (for the purposes of election expenses and type of returning officer)
- ↑ As with all constituencies, the constituency elects one Member of Parliament (MP) by the first past the post system of election at least every five years.
- ↑ Heir to the Earl of Mar, however predeceased his father. This title has a subsidiary title gained by one of the clan's forebears, remaining as a courtesy title, Lord Erskine, which attaches to its current holder's eldest son.
- References
- ↑ "Electorate Figures — Boundary Commission for England". 2011 Electorate Figures. Boundary Commission for England. 4 March 2011. Retrieved 13 March 2011.
- ↑ Unemployment claimants by constituency The Guardian
- ↑ "Weston-super-Mare 1918–". Hansard. Retrieved 6 October 2012.
- ↑ "Election Data 2015". Electoral Calculus. Archived from the original on 17 October 2015. Retrieved 17 October 2015.
- ↑ "Election Data 2010". Electoral Calculus. Archived from the original on 26 July 2013. Retrieved 17 October 2015.
- 1 2 3 4 "Weston-Super-Mare". The Guardian. Retrieved 27 December 2010.
- ↑ "Politics Resources". Election 1992. Politics Resources. 9 April 1992. Retrieved 6 December 2010.
- ↑ "Stephen, Miss Jessie 8SUF/B/157". The National Archives. 1 July 1977. Retrieved 7 December 2012.
Sources
- The Constitutional Year Book for 1913 (London: National Union of Conservative and Unionist Associations, 1913)
- F W S Craig, British Parliamentary Election Results 1832–1885 (2nd edition, Aldershot: Parliamentary Research Services, 1989)
- Michael Kinnear, The British Voter (London: BH Batsford, Ltd, 1968)
- Henry Pelling, Social Geography of British Elections 1885–1910 (London: Macmillan, 1967)
- Frederic A Youngs, jr, Guide to the Local Administrative Units of England, Vol I (London: Royal Historical Society, 1979)