Dewsbury (UK Parliament constituency)

Coordinates: 53°41′28″N 1°40′19″W / 53.691°N 1.672°W / 53.691; -1.672

Dewsbury
County constituency
for the House of Commons

Outline map

Boundary of Dewsbury in West Yorkshire for the 2010 general election.

Outline map

Location of West Yorkshire within England.
County West Yorkshire
Electorate 79,634 (December 2010)[1]
Major settlements Dewsbury and Mirfield
Current constituency
Created 1868
Member of parliament Paula Sherriff (Labour)
Number of members One
Overlaps
European Parliament constituency Yorkshire and the Humber

Dewsbury is a constituency[n 1] represented in the House of Commons of the UK Parliament since 2015 by Paula Sherriff of the Labour Party.[n 2]

History

Dewsbury's seat dates back to 1868 and the electorate has usually given the winning MP marginal majorities which means it is a marginal seat. Labour MPs served the seat from 1935 until 1983 and again from 1987. In 2010 it was gained by Simon Reevell, a Conservative and in 2015 it was gained by Paula Sherriff, a Labour Party candidate.

Boundaries

1918-1950: The County Borough of Dewsbury.

1950-1955: The County Borough of Dewsbury, the Municipal Borough of Ossett, and the Urban Districts of Heckmondwike and Mirfield.

1955-1983: The County Borough of Dewsbury, the Municipal Borough of Ossett, and the Urban District of Mirfield.

1983-1997: The Metropolitan Borough of Kirklees wards of Denby Dale, Dewsbury East, Dewsbury West, Kirkburton, Mirfield, and Thornhill.

1997-2010: The Metropolitan Borough of Kirklees wards of Dewsbury East, Dewsbury West, Heckmondwike, Mirfield, and Thornhill.

2010-present: The Metropolitan Borough of Kirklees wards of Denby Dale, Dewsbury East, Dewsbury South, Dewsbury West, Kirkburton, and Mirfield.

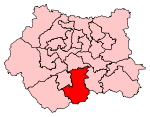
The constituency covers the towns of Dewsbury and Mirfield, and the surrounding areas.

In the 2010 redistribution, the constituency lost the Labour-leaning ward of Heckmondwike, but gained the Conservative-leaning wards of Denby Dale and Kirkburton.

Constituency profile

The seat has a substantial Muslim population and few rural parts. The seat has close to national average income and several developments have desirable views as the upland town cuts into the Pennines. Relatively few people rely upon social housing.[2] In the light of increasing concern over Muslim extremism, the Labour Party candidate Shahid Malik enjoyed a fairly large public media profile after his victory in 2005, with various TV appearances and interviews, strongly denouncing believers in and adherents of such views; however, this has also been a strong area for the British National Party, who obtained their highest vote in Britain (13.1%) in the 2005 general election, much of it taken at the Labour Party's expense. They have also had a substantial vote at local level, when in 2006 for the first time in the UK the BNP polled more votes than any other party standing. However, at the 2010 general election, the BNP's popularity in Dewsbury fell (despite a substantial nationwide rise in support for the party compared to five years previously) and they gained a mere 6% of the vote.[3]

Members of Parliament

ElectionMember[4]Party
1868 Sir John Simon Liberal
1888 by-election Mark Oldroyd Liberal
1902 by-election Walter Runciman Liberal
1918 Emil William Pickering Coalition Conservative
1922 Benjamin Riley Labour
1923 Thomas Edmund Harvey Liberal
1924 Benjamin Riley Labour
1931 Walter Russell Rea Liberal
1935 Benjamin Riley Labour
1945 Will Paling Labour
1959 David Ginsburg Labour
1981 Social Democrat
1983 John Whitfield Conservative
1987 Ann Taylor Labour
2005 Shahid Malik Labour
2010 Simon Reevell Conservative
2015 Paula Sherriff Labour

Election results

Elections in the 2010s

General Election 2015: Dewsbury[5][6]
Party Candidate Votes % ±
Labour Paula Sherriff 22,406 41.8 +9.6
Conservative Simon Reevell 20,955 39.1 +4.1
UKIP Mark Thackray 6,649 12.4 N/A
Liberal Democrat Ednan Hussain 1,924 3.6 −13.4
Green Adrian Cruden 1,366 2.5 +1.0
Yorkshire First Richard Carter 236 0.4 N/A
Christian Peoples Steve Hakes 94 0.2 N/A
Majority 1,451 2.7 N/A
Turnout 53,630 67.2 −1.3
Labour gain from Conservative Swing +2.8
General Election 2010: Dewsbury[7]
Party Candidate Votes % ±
Conservative Simon Reevell 18,898 35.0 +6.0
Labour Shahid Malik 17,372 32.2 −9.5
Liberal Democrat Andrew Hutchinson 9,150 16.9 +3.3
Independent Khizar Iqbal 3,813 7.1 N/A
BNP Roger Roberts 3,265 6.0 −7.1
Green Adrian Cruden 849 1.6 +0.1
English Democrat Michael Felse 661 1.2 N/A
Majority 1,526 2.8 N/A
Turnout 54,008 68.5 +6.5
Conservative gain from Labour Swing +7.8

Elections in the 2000s

General Election 2005: Dewsbury[8]
Party Candidate Votes % ±
Labour Shahid Malik 15,807 41.0 −9.5
Conservative Sayeeda Warsi 11,192 29.0 −1.2
Liberal Democrat Kingsley Hill 5,624 14.6 +2.6
BNP David Exley 5,066 13.1 +8.6
Green Brenda Smithson 593 1.5 +0.0
Independent Alan Girvan 313 0.8 N/A
Majority 3,615 12 −8.3
Turnout 38,595 62.0 +3.2
Labour hold Swing −4.2
General Election 2001: Dewsbury[9]
Party Candidate Votes % ±
Labour Winifred Ann Taylor 18,524 50.5 +1.1
Conservative Robert Cole 11,075 30.2 +0.1
Liberal Democrat Ian Cuthbertson 4,382 12.0 +1.7
BNP Russell Smith 1,632 4.5 −0.7
Green Brenda Smithson 560 1.5 +0.6
UKIP David Peace 478 1.3 N/A
Majority 7,449 20.3 +1.0
Turnout 36,651 58.8 -11.2
Labour hold Swing +0.5

Elections in the 1990s

General Election 1997: Dewsbury[10]
Party Candidate Votes % ±
Labour Winifred Ann Taylor 21,286 49.4 +5.6
Conservative Paul McCormick 12,963 30.1 −12.7
Liberal Democrat Kingsley Hill 4,422 10.3 −1.0
BNP Frances Taylor 2,232 5.2 +4.1
Referendum Wendy Golf 1,019 2.4 N/A
Independent Labour David Daniel 770 1.8 N/A
Green Ian McCourtie 383 0.9 +0.1
Majority 8,323 19.3 +18.2
Turnout 43,975 70.0 -10.2
Labour hold Swing +9.2
General Election 1992: Dewsbury[11]
Party Candidate Votes % ±
Labour Winifred Ann Taylor 25,596 43.8 +1.4
Conservative John Whitfield 24,962 42.7 +1.1
Liberal Democrat Robert Meadowcroft 6,570 11.3 N/A
BNP Jane Birdwood 660 1.1 N/A
Green Neil Denby 471 0.8 N/A
Natural Law Janet Marsden 146 0.3 N/A
Majority 634 1.1 +0.3
Turnout 58,402 80.2 +2.4
Labour hold Swing +0.2

Elections in the 1980s

General Election 1987: Dewsbury[12]
Party Candidate Votes % ±
Labour Winifred Ann Taylor 23,668 42.4 +7.1
Conservative John Whitfield 23,223 41.6 +2.3
Social Democratic Alan Mills 8,907 16.0 −9.3
Majority 445 0.8 N/A
Turnout 55,798 78.8 +7.9
Labour gain from Conservative Swing +2.4
General Election 1983: Dewsbury[13]
Party Candidate Votes % ±
Conservative John Whitfield 20,297 39.4 +1.6
Labour Denis Ripley 18,211 35.3 −11.4
Social Democratic David Ginsburg 13,065 25.3 N/A
Majority 2,086 4.0 N/A
Turnout 51,573 70.8 −6.3
Conservative gain from Labour Swing +6.5

Elections in the 1970s

General Election 1979: Dewsbury[14]
Party Candidate Votes % ±
Labour David Ginsburg 22,829 46.7 +1.3
Conservative Roy Galley 18,448 37.8 +7.7
Liberal Neil Philip Derbyshire 7,580 15.5 −9.0
Majority 4,381 9.0 −6.4
Turnout 48,857 77.1 +4.2
Labour hold Swing −3.2
General Election October 1974: Dewsbury[14]
Party Candidate Votes % ±
Labour David Ginsburg 20,378 45.4 +3.0
Conservative Marguerite Elizabeth Liversidge Wood 13,477 30.1 −1.6
Liberal Alan Allsop 10,991 24.5 −1.4
Majority 6,901 15.4 +4.5
Turnout 44,846 72.9 -8.4
Labour hold Swing +2.3
General Election February 1974: Dewsbury[14]
Party Candidate Votes % ±
Labour David Ginsburg 21,186 42.5 -6.3
Conservative Ivor James Humphrey 15,774 31.6 -7.0
Liberal Alan Allsop 12,889 25.9 +13.2
Majority 5,412 10.9 +0.8
Turnout 49,859 81.8 +7.2
Labour hold Swing +0.4
General Election 1970: Dewsbury[15]
Party Candidate Votes % ±
Labour David Ginsburg 22,015 48.7 -4.8
Conservative John M Stanfield 17,468 38.7 +9.9
Liberal Alan Allsop 5,688 12.6 -5.1
Majority 4,547 10.1 -14.8
Turnout 45,171 74.5 -3.4
Labour hold Swing -7.4

Elections in the 1960s

General Election 1966: Dewsbury[16]
Party Candidate Votes % ±
Labour David Ginsburg 23,027 53.6 +5.2
Conservative Donald H Haynes 12,361 28.8 -5.4
Liberal Alan Allsop 7,593 17.7 +0.2
Majority 10,666 24.8 +10.7
Turnout 42,981 77.9 -1.6
Labour hold Swing +5.3
General Election 1964: Dewsbury[17]
Party Candidate Votes % ±
Labour David Ginsburg 21,284 48.4 +2.4
Conservative Mrs. Barbara M Garden 15,046 34.2 -3.7
Liberal Alan Allsop 7,679 17.5 +1.2
Majority 6,238 14.2 +6.1
Turnout 44,009 79.5 -3.2
Labour hold Swing +3.1

Elections in the 1950s

General Election 1959: Dewsbury[18]
Party Candidate Votes % ±
Labour David Ginsburg 20,870 46.0 -6.2
Conservative John Marcus Fox 17,201 37.9 +2.4
Liberal John M McLusky 7,321 16.1 +3.8
Majority 3,669 7.1 -8.5
Turnout 45,392 82.7 +1.9
Labour hold Swing -4.3
General Election 1955: Dewsbury[19]
Party Candidate Votes % ±
Labour William Thomas Paling 23,286 52.1 -1.1
Conservative Michael Norman Shaw 15,869 35.5 -0.9
Liberal Joseph Stanley Snowden 5,516 12.4 +2.0
Majority 7,417 16.6 -0.2
Turnout 44,671 80.8 -5.0
Labour hold Swing
General Election 1951: Dewsbury[20]
Party Candidate Votes % ±
Labour William Thomas Paling 28,650 53.3 -0.4
Conservative James Edward Ramsden 19,562 36.4 +3.4
Liberal Joseph Stanley Snowden 5,584 10.4 -3.0
Majority 9,088 16.9 -3.7
Turnout 53,796 85.8 -2.1
Labour hold Swing
General Election 1950: Dewsbury[21]
Party Candidate Votes % ±
Labour William Thomas Paling 29,341 53.6 -2.7
Conservative James Edward Ramsden 18,076 33.0 +3.1
Liberal George Granville Slack 7,323 13.4 -0.5
Majority 11,265 20.6 -5.8
Turnout 54,740 87.9 +7.6
Labour hold Swing -2.9

Elections in the 1940s

General Election 1945: Dewsbury[22]
Party Candidate Votes % ±
Labour William Thomas Paling 16,330 56.3 +9.1
Liberal National Ernest Kilner 8,674 29.9 N/A
Liberal Thomas Mercer Banks 4,023 13.9 -9.4
Majority 7,656 26.4 +8.7
Turnout 29,027 80.3 -0.5
Labour hold Swing

General Election 1939/40:

Another General Election was due to take place before the end of 1940. The political parties had been making preparations for an election to take place from 1939 and by the end of this year, the following candidates had been selected:

Elections in the 1930s

General Election 1935: Dewsbury[24]
Party Candidate Votes % ±
Labour Benjamin Riley 14,066 47.21 +10.89
National Labour John Fennell 8,798 29.53 N/A
Liberal Walter Russell Rea 6,933 23.27 -40.41
Majority 5,268 17.68 N/A
Turnout 29,797 80.81 -3.42
Labour gain from Liberal Swing
General Election 1931: Dewsbury[25]
Party Candidate Votes % ±
Liberal Walter Russell Rea 19,463 63.68 +29.68
Labour Benjamin Riley 11,101 36.32 -9.88
Majority 8,362 27.36 N/A
Turnout 30,564 84.23 -1.88
Liberal gain from Labour Swing

Elections in the 1920s

General Election 1929: Dewsbury
Party Candidate Votes % ±
Labour Benjamin Riley 14,420 46.2 +5.1
Liberal Ronald Fitzjohn Walker 10,607 34.0 +6.2
Unionist JWW Shuttleworth 6,175 19.8 -11.3
Majority 3,813 12.2 +2.2
Turnout 36,250 86.1 +1.8
Labour hold Swing
General Election 1924: Dewsbury
Party Candidate Votes % ±
Labour Benjamin Riley 19,941 41.1 -3.2
Unionist Frederick Walter Skelsey 7,516 31.1 N/A
Liberal Thomas Edmund Harvey 6,723 27.8 -27.8
Majority 2,425 10.0 N/A
Turnout 28,677 84.3 +13.6
Labour gain from Liberal Swing
General Election 1923: Dewsbury
Party Candidate Votes % ±
Liberal Thomas Edmund Harvey 11,179 55.6 +21.5
Labour Benjamin Riley 8,923 44.4 +13.2
Majority 2,256 11.2 N/A
Turnout 20,102 70.7 -13.2
Liberal gain from Labour Swing
General Election 1922: Dewsbury
Party Candidate Votes % ±
Labour Benjamin Riley 8,821 37.3 +7.2
Liberal Thomas Edmund Harvey 8,065 34.1 +5.5
Unionist Osbert Peake 8,065 28.5 N/A
Majority 756 3.3 N/A
Turnout 23,630 83.9
Labour gain from Unionist Swing

Elections in the 1910s

Walter Runciman
General Election 1918: Dewsbury[26]
Party Candidate Votes % ±
Unionist 7,853 42.3
Labour Benjamin Riley 5,596 30.1 N/A
Liberal Walter Runciman 5,130 27.6
Turnout
Unionist gain from Liberal Swing
  • endorsed by Coalition Government
General Election December 1910: Dewsbury[27]
Party Candidate Votes % ±
Liberal Walter Runciman 7,061
Conservative Edward Overend Simpson 4,033
Turnout
Liberal hold Swing
General Election January 1910: Dewsbury[27]
Party Candidate Votes % ±
Liberal Walter Runciman 7,882
Conservative Edward Overend Simpson 4,747
Turnout
Liberal hold Swing

Elections in the 1900s

Dewsbury by-election, 1908[27]
Party Candidate Votes % ±
Liberal Walter Runciman 5,594
Conservative W. B. Boyd-Carpenter 4,078
Labour Ben Turner 2,446
Turnout
Liberal hold Swing
Walter Runciman
General Election 1906: Dewsbury[27]
Party Candidate Votes % ±
Liberal Walter Runciman 6,764 54.8 +6.6
Conservative W. B. Boyd-Carpenter 2,954 24.0 -14.2
Labour Ben Turner 2,629 21.2 +7.6
Turnout 12,347 89 +1
Majority 30.8 +21.0
Liberal hold Swing +10.4
Harry Quelch
Dewsbury by-election, 1902[28]
Party Candidate Votes % ±
Liberal Walter Runciman 5,660 48.1
Conservative Joe Haley 4,512 38.3
Social Democratic Federation Harry Quelch 1,597 13.6
Turnout
Majority 1,148 9.8
Liberal hold Swing
General Election 1900: Dewsbury[28]
Party Candidate Votes % ±
Liberal Mark Oldroyd 6,045 60.1
Conservative Forbes St John Morrow 3,897 39.2
Turnout
Majority 2,148 20.2
Liberal hold Swing

Elections in the 1890s

Mark Oldroyd
General Election 1895: Dewsbury[26]
Party Candidate Votes % ±
Liberal Mark Oldroyd 5,379 52.1
Conservative Henry Strother Cautley 3,875 37.5
Ind. Labour Party Edward Hartley 1,080 10.4 N/A
Turnout
Liberal hold Swing
General Election 1892: Dewsbury[28]
Party Candidate Votes % ±
Liberal Mark Oldroyd 5,759
Conservative Henry Strother Cautley 3,670
Turnout
Liberal hold Swing

Elections in the 1880s

Dewsbury by-election, 1888[26]
Party Candidate Votes % ±
Liberal Mark Oldroyd 6,075 60.5
Liberal Unionist Hugh Oakeley Arnold-Forster 3,969 39.5
Turnout
Liberal hold Swing
1886: Dewsbury[26]
Party Candidate Votes % ±
Liberal John Simon 5,118 65.1
Conservative J.S. Colefax 2,759 34.9
Turnout
Liberal hold Swing
1885: Dewsbury[28]
Party Candidate Votes % ±
Liberal John Simon 6,124
Conservative Joe Foz 3,664
Turnout
Liberal hold Swing

See also

Notes

  1. A county constituency (for the purposes of election expenses and type of returning officer)
  2. As with all constituencies, the constituency elects one Member of Parliament (MP) by the first past the post system of election at least every five years.

References

Craig, F. W. S. (1983). British parliamentary election results 1918-1949 (3 ed.). Chichester: Parliamentary Research Services. ISBN 0-900178-06-X.

  1. "Electorate Figures - Boundary Commission for England". 2011 Electorate Figures. Boundary Commission for England. 4 March 2011. Retrieved 13 March 2011.
  2. "Check Browser Settings". statistics.gov.uk.
  3. "UK > England > Yorkshire & the Humber > Dewsbury". Election 2010. BBC. 7 May 2010. Retrieved 12 May 2010.
  4. Leigh Rayment's Historical List of MPs – Constituencies beginning with "D" (part 2)
  5. "Election Data 2015". Electoral Calculus. Archived from the original on 17 October 2015. Retrieved 17 October 2015.
  6. "Dewsbury". BBC News. Retrieved 13 May 2015.
  7. "Election Data 2010". Electoral Calculus. Archived from the original on 26 July 2013. Retrieved 17 October 2015.
  8. "Election Data 2005". Electoral Calculus. Archived from the original on 15 October 2011. Retrieved 18 October 2015.
  9. "Election Data 2001". Electoral Calculus. Archived from the original on 15 October 2011. Retrieved 18 October 2015.
  10. "Election Data 1997". Electoral Calculus. Archived from the original on 15 October 2011. Retrieved 18 October 2015.
  11. "Election Data 1992". Electoral Calculus. Archived from the original on 15 October 2011. Retrieved 18 October 2015.
  12. "Election Data 1987". Electoral Calculus. Archived from the original on 15 October 2011. Retrieved 18 October 2015.
  13. "Election Data 1983". Electoral Calculus. Archived from the original on 15 October 2011. Retrieved 18 October 2015.
  14. 1 2 3 "'Dewsbury', Feb 1974 - May 1983". ElectionWeb Project. Cognitive Computing Limited. Retrieved 27 March 2016.
  15. Kimber, Richard. "UK General Election results 1970". Political Science Resources. Retrieved 27 March 2016.
  16. Kimber, Richard. "UK General Election results March 1966". Political Science Resources. Retrieved 27 March 2016.
  17. Kimber, Richard. "UK General Election results October 1964". Political Science Resources. Retrieved 27 March 2016.
  18. Kimber, Richard. "UK General Election results October 1959". Political Science Resources. Retrieved 27 March 2016.
  19. Kimber, Richard. "UK General Election results October 1955". Political Science Resources. Retrieved 27 March 2016.
  20. Kimber, Richard. "UK General Election results October 1951". Political Science Resources. Retrieved 27 March 2016.
  21. Kimber, Richard. "UK General Election results February 1950". Political Science Resources. Retrieved 27 March 2016.
  22. Kimber, Richard. "UK General Election results July 1945". Political Science Resources. Retrieved 27 March 2016.
  23. Yorkshire Post and Leeds Intelligencer 15 March 1939
  24. Kimber, Richard. "UK General Election results November 1935". Political Science Resources. Retrieved 27 March 2016.
  25. Kimber, Richard. "UK General Election results October 1931". Political Science Resources. Retrieved 27 March 2016.
  26. 1 2 3 4 Christopher J. James, M.P. for Dewsbury, p.291
  27. 1 2 3 4 The Liberal Year Book (1917), p.231
  28. 1 2 3 4 The Constitutional Year Book 1908, p.189

Sources

  • Craig, F. W. S. (1983) [1969]. British parliamentary election results 1918-1949 (3rd ed.). Chichester: Parliamentary Research Services. ISBN 0-900178-06-X. 
This article is issued from Wikipedia - version of the 9/5/2016. The text is available under the Creative Commons Attribution/Share Alike but additional terms may apply for the media files.