Belgian general election, 1978
| | |||||||
| |||||||
| |||||||
|
| |||||||
| Colours denote the winning party in each electoral district (for the Chamber of Deputies). | |||||||

 |
| This article is part of a series on the politics and government of Belgium |
| Constitution |
|
| Foreign relations |
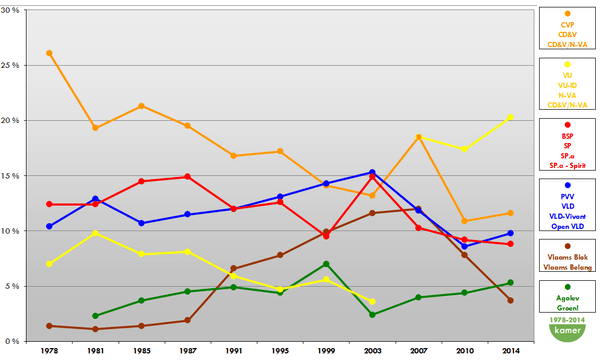
General elections were held in Belgium on 17 December 1978.[1] The Christian People's Party emerged as the largest party, with 57 of the 212 seats in the Chamber of Representatives and 29 of the 106 seats in the Senate. Voter turnout was 94.8%.[2] Elections were also held for the nine provincial councils and for the Council of the German Cultural Community.
The snap elections were called after Prime Minister Leo Tindemans resigned over the Egmont pact, which would have transformed Belgium into a federal state. Vlaams Blok participated for the first time, which was formed out of disagreement within the People's Union over concessions in the Egmont pact.
Results
Chamber of Deputies
| Party | Votes | % | Seats | +/– |
|---|---|---|---|---|
| Christian People's Party | 1,447,112 | 26.14 | 57 | +1 |
| Belgian Socialist Party (Wallonia) | 689,876 | 12.46 | 31 | +31 |
| Belgian Socialist Party (Flanders) | 684,976 | 12.37 | 26 | –1 |
| Party for Freedom and Progress | 573,387 | 10.36 | 22 | +5 |
| Christian Social Party | 560,440 | 10.12 | 25 | +1 |
| People's Union | 388,762 | 7.02 | 14 | –6 |
| Democratic Front of the Francophones | 259,019 | 4.68 | 11 | 0 |
| Liberal Reformist Party | 256,685 | 4.64 | 15 | –1 |
| Communist Party of Belgium | 180,234 | 3.26 | 4 | +4 |
| Walloon Rally | 128,153 | 2.32 | 4 | 0 |
| Vlaams Blok | 75,635 | 1.37 | 1 | +1 |
| UDRT/RAD | 48,616 | 0.88 | 1 | +1 |
| AMA/TPO | 43,483 | 0.79 | 0 | New |
| PL | 41,460 | 0.75 | 0 | New |
| PRLW/PRF | 31,280 | 0.57 | 0 | 0 |
| Belgian Socialist Party (Luxembourg) | 30,222 | 0.55 | 1 | New |
| Ecolo | 21,224 | 0.38 | 0 | 0 |
| PLW | 9,861 | 0.18 | 0 | New |
| Party of German-speaking Belgians | 9,032 | 0.16 | 0 | 0 |
| ECOLOG | 8,360 | 0.15 | 0 | 0 |
| Walloon Rally (Luxembourg) | 6,493 | 0.12 | 0 | New |
| AGALEV | 5,556 | 0.10 | 0 | 0 |
| ECOPOL | 3,922 | 0.07 | 0 | New |
| LSDP | 3,678 | 0.07 | 0 | New |
| BNP-PNB | 3,465 | 0.06 | 0 | New |
| LRT | 2,597 | 0.05 | 0 | 0 |
| PLF | 2,313 | 0.04 | 0 | New |
| PPB | 2,123 | 0.04 | 0 | New |
| UDP | 1,843 | 0.03 | 0 | New |
| GROEN | 1,761 | 0.03 | 0 | New |
| PFU | 1,686 | 0.03 | 0 | 0 |
| PF-ECO | 1,512 | 0.03 | 0 | New |
| KAGANO | 1,376 | 0.02 | 0 | 0 |
| PVCM | 993 | 0.02 | 0 | New |
| PFN | 729 | 0.01 | 0 | New |
| LP-PL | 698 | 0.01 | 0 | New |
| PDE | 375 | 0.01 | 0 | New |
| PDRT | 311 | 0.01 | 0 | New |
| Invalid/blank votes | 507,058 | – | – | – |
| Total | 6,042,689 | 100 | 212 | 0 |
| Source: Belgian Elections | ||||
Senate
| Party | Votes | % | Seats | +/– |
|---|---|---|---|---|
| Christian People's Party | 1,420,777 | 25.93 | 29 | +1 |
| Belgian Socialist Party (Wallonia) | 685,307 | 12.51 | 17 | –2 |
| Belgian Socialist Party (Flanders) | 678,776 | 12.39 | 13 | +1 |
| Party for Freedom and Progress | 572,535 | 10.45 | 11 | +2 |
| Christian Social Party | 535,939 | 9.78 | 12 | +1 |
| People's Union | 384,562 | 7.02 | 7 | –3 |
| Liberal Reformist Party-PL | 330,155 | 6.03 | 6 | New |
| Democratic Front of the Francophones | 266,713 | 4.87 | 7 | New |
| Communist Party of Belgium | 182,711 | 3.33 | 1 | 0 |
| Walloon Rally | 123,794 | 2.26 | 2 | 0 |
| Vlaams Blok | 80,809 | 1.47 | 0 | New |
| UDRT/RAD | 51,571 | 0.94 | 0 | New |
| AMA/TPO | 44,379 | 0.81 | 0 | New |
| Ecolo | 43,883 | 0.80 | 0 | 0 |
| Belgian Socialist Party (Luxembourg) | 30,837 | 0.56 | 1 | New |
| Party of German-speaking Belgians | 11,148 | 0.20 | 0 | 0 |
| PLW | 11,081 | 0.2 | 0 | New |
| Walloon Rally (Luxembourg) | 6,659 | 0.12 | 0 | New |
| RAL/LRT | 3,744 | 0.07 | 0 | New |
| LSDP | 3,239 | 0.06 | 0 | New |
| PPB | 2,804 | 0.05 | 0 | New |
| PLF | 2,640 | 0.05 | 0 | New |
| UDP | 2,221 | 0.04 | 0 | New |
| PFU | 2,045 | 0.04 | 0 | New |
| PCR | 917 | 0.02 | 0 | New |
| Invalid/blank votes | 565,299 | – | – | – |
| Total | 6,044,545 | 100 | 106 | 0 |
| Source: Belgian Elections | ||||
References
This article is issued from Wikipedia - version of the 6/4/2016. The text is available under the Creative Commons Attribution/Share Alike but additional terms may apply for the media files.