Belgian general election, 1991
Belgian general election, 1991
.svg.png)
|
|
|
|
212 seats in the Chamber of Representatives
All 70 seats in the Senate |
| |
First party |
Second party |
Third party |
| |
 |
 |
 |
| Leader |
Wilfried Martens |
Guy Spitaels |
Frank Vandenbroucke |
| Party |
CVP |
PS |
SP |
| Leader since |
Candidate for PM |
1981 |
1989 |
| Last election |
43 seats, 19.5% |
40 seats, 15.6% |
32 seats, 14.9% |
| Seats won |
39 |
35 |
28 |
| Seat change |
 4 4 |
5 |
4 |
| Popular vote |
1,035,165 |
831,199 |
737,976 |
| Percentage |
16.8% |
13.5% |
12.0% |
| Swing |
2.7% |
2.1% |
2.9% |
|
| |
Fourth party |
Fifth party |
Sixth party |
| |
 |
|
|
| Leader |
Guy Verhofstadt |
Antoine Duquesne
Daniel Ducarme |
Gérard Deprez |
| Party |
PVV |
PRL |
PSC |
| Leader since |
1989 |
1990 |
1981 |
| Last election |
25 seats, 11.5% |
23 seats, 9.4% |
19 seats, 8.0% |
| Seats won |
26 |
20 |
18 |
| Seat change |
 1 1 |
3 |
1 |
| Popular vote |
738,016 |
501,647 |
476,470 |
| Percentage |
12.0% |
8.1% |
7.7% |
| Swing |
0.5% |
1.3% |
0.3% |
|
|
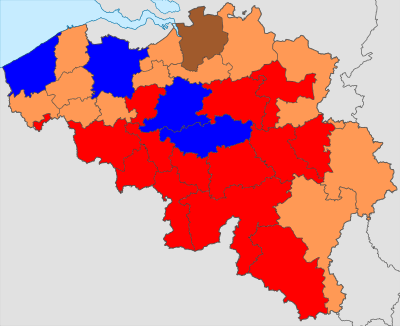
| Colours denote the winning party in each electoral district, as shown in the table of results. |
|
|
The 24 November 1991 Belgian general elections was a Belgian election for the Belgian Chamber of Representatives and Belgian Senate.
The results represented a big loss for the majority parties (Christian democrats and Socialists). The Vlaams Blok on the other hand had a very big gain; the day became known as "black Sunday" due to the rise of the far-right party.
These were the last elections before the new 1993 Belgian Constitution, which turned Belgium formally into a federal state: after this election, the number of MPs were reduced while the regional parliaments would become directly elected. The provincial elections would no longer coincide with national elections, but with municipal elections.
By law of 16 July 1991, experiments with electronic voting were carried out for the first time in Belgium during these elections, specifically in the canton of Verlaine (province of Liège) and the canton of Waarschoot (province of East Flanders).
Chamber of Representatives
Elections Belgian chamber 24/11/1991
| Party |
Total |
Dutch-speaking electoral college |
French-speaking electoral college |
| Votes |
% |
Seats |
Votes |
% |
Seats |
Votes |
% |
Seats |
| |
Christian People Party (CVP) | 1,036,165 | 16.8 | 39 | 1,036,165 | | 39 | |
| |
Socialist Party (PS) | 831,199 | 13.5 | 35 | | 831,199 | | 35 |
| |
Party for Freedom and Progress (PVV) | 738,016 | 12.0 | 26 | 738,016 | | 26 | |
| |
Socialist Party (SP) | 737,976 | 12.0 | 28 | 737,976 | | 28 | |
| |
Liberal Reform Party (PRL) | 501,647 | 8.1 | 20 | | 501,647 | | 20 |
| |
Christian Social Party (PSC) | 476,730 | 7.7 | 18 | | 476,730 | | 18 |
| |
Flemish Bloc (VB) | 405,247 | 6.6 | 12 | 405,247 | | 12 | |
| |
People's Union (VU) | 363,124 | 5.9 | 10 | 363,124 | | 10 | |
| |
Ecolo | 312,624 | 5.1 | 10 | | 312,624 | | 10 |
| |
Agalev | 299,550 | 4.9 | 7 | 299,550 | | 7 | |
| |
ROSSEM | 198,182 | 3.2 | 3 | 198,182 | | 3 | |
| |
Democratic Front of the Francophones (FDF)/PPW | 90,813 | 1,5 | 3 | | 90,813 | | 3 |
| |
National Front (FN) | 64,992 | 1.1 | 1 | | 64,992 | | 1 |
| |
Workers' Party (PVDA/PTB) | 30,491 | 0.5 | — | | | — | | | — |
| |
B.E.B. | 15,429 | 0.3% | - |
| |
REGEBO | 11,944 | 0.2% | - |
| |
Agir | 11,189 | 0.2% | - |
| |
PC | 5,706 | 0.1% | - |
| |
Socialist Workers' Party (SAP/POS) | 5,243 | 0.1% | - |
| |
V.D. | 4,467 | 0.1% | - |
| |
Walloon Rally | 756 | 0.1% | - |
| |
Total | 6,162,160 | 100 | 212 | | 100 | | | 100 | |
Senate
Elections Belgian Senate 24/11/1991
| Party | Votes | Percentage | Seats |
| total | 6,117,614 | 100% | 70 |
| CVP | 1,028,699 | 16.8% | 20 |
| PS | 814,136 | 13.2% | 18 |
| SP | 730,274 | 11.9% | 14 |
| PVV | 713,542 | 11.7% | 13 |
| PRL | 496,562 | 8.1% | 9 |
| PSC | 483,961 | 7.9% | 9 |
| Vlaams Blok | 414,481 | 6.8% | 5 |
| Volksunie | 365,173 | 6.0% | 5 |
| Ecolo | 323,683 | 5.3% | 6 |
| Agalev | 314,360 | 5.1% | 5 |
| ROSSEM | 196,052 | 3.2% | 1 |
| FDF/PPW | 86,026 | 1.4% | 1 |
| FN | 60,876 | 1.0% | - |
| PVDA/PTB | 31,754 | 0.5% | - |
| B.E.B. | 15,893 | 0.3% | - |
| REGEBO | 12,150 | 0.2% | - |
| PC | 6,552 | 0.1% | - |
| SAP/POS | 6,485 | 0.1% | - |
| V.D. | 4,228 | 0.1% | - |
| RW | 3,441 | 0.1% | - |