Belgian federal election, 1995
Belgian federal election, 1995
.svg.png)
|
|
|
|
All 150 seats in the Chamber of Representatives
40 of 71 seats in the Senate
respectively 76 and 36 seats needed for a majority |
| |
First party |
Second party |
Third party |
| |
 |
 |
 |
| Leader |
Jean-Luc Dehaene |
Guy Verhofstadt |
Philippe Busquin |
| Party |
CVP |
VLD |
PS |
| Leader since |
Candidate for PM |
1992 |
1992 |
| Last election |
39 seats, 16.8% |
26 seats, 12.0% |
35 seats, 13.5% |
| Seats won |
29 |
21 |
21 |
| Seat change |
 10 10 |
5 |
14 |
| Popular vote |
1,042,933 |
798,363 |
720.819 |
| Percentage |
17.2% |
13.1% |
11.9% |
| Swing |
 0.4% 0.4% |
1.1% |
1.6% |
|
| |
Fourth party |
Fifth party |
Sixth party |
| |
 |
 |
|
| Leader |
Louis Tobback |
Louis Michel |
Gérard Deprez |
| Party |
SP |
PRL + FDF |
PSC |
| Leader since |
1994 |
1995 |
1981 |
| Last election |
28 seats, 12.0% |
23 seats, 9.6% |
18 seats, 7.7% |
| Seats won |
20 |
18 |
12 |
| Seat change |
8 |
5 |
6 |
| Popular vote |
762.444 |
623.250 |
469.101 |
| Percentage |
12.6% |
10.1% |
7.7% |
| Swing |
0.6% |
0.5% |
 |
|
|
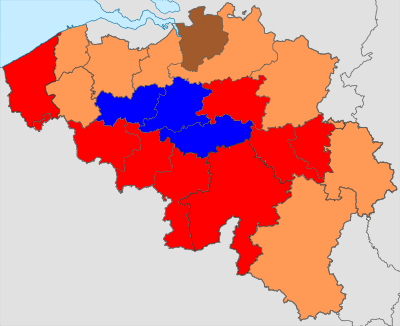
| Colours denote the winning party in each electoral district, as shown in the table of results. |
|
|
The 21 May 1995 Belgian general elections was a Belgian election for the Chamber of Representatives and Senate. The Christian People's Party (CVP) kept its position as largest party in Flanders and overall in Belgium, and Jean-Luc Dehaene (CVP) continued as Prime Minister.
On the same day, regional elections were also held. These were the first elections after the new 1993 Belgian Constitution, which turned Belgium formally into a federal state. The new Constitution also reduced the number of seats in the Chamber (from 212 to 150) and in the Senate (from 70 to 40 directly elected senators).
Chamber of Representatives
Summary of the 21 May 1995 Belgian Chamber of Representatives election results
| Parties |
Chamber |
| Votes |
+/- |
% |
+/- |
Seats |
+/- |
|
Christian People's Party (Christelijke Volkspartij) |
1,042,933 |
|
17.2 |
|
29 |
|
|
Flemish Liberals and Democrats (Vlaamse Liberalen en Democraten) |
798,363 |
|
13.1 |
|
21 |
|
|
Socialist Party (Wallonia) (Parti Socialiste) |
720,819 |
|
11.9 |
|
21 |
|
|
Socialist Party (Flanders) (Socialistische Partij) |
762,444 |
|
12.6 |
|
20 |
|
|
Liberal Reformist Party - Democratic Front of Francophones (PRL-FDF) |
623,250 |
|
10.3 |
|
18 |
|
|
PSC (Parti Social Chrétien) |
469,101 |
|
7.7 |
|
12 |
|
|
Flemish Block (Vlaams Blok) |
475,677 |
|
7.8 |
|
11 |
|
|
People's Union (Volksunie) |
283,516 |
|
4.7 |
|
5 |
|
|
Ecolo |
243,362 |
|
4.0 |
|
6 |
|
|
Agalev |
269,058 |
|
4.4 |
|
5 |
|
|
National Front (Front National) |
138,496 |
|
2.3 |
|
2 |
|
|
Others |
245,032 |
— |
4.0 |
— |
— |
— |
|
Total (turnout 91.1%) |
6,072,051 |
|
100 |
|
150 |
|
| Source: IBZ. |
Senate
Summary of the 21 May 1995 Belgian Senate election results
| Parties |
Senate |
| Votes |
+/- |
% |
+/- |
Seats |
+/- |
|
Christian People's Party (Christelijke Volkspartij) |
1,009,656 |
|
16.8 |
|
7 |
|
|
Flemish Liberals and Democrats (Vlaamse Liberalen en Democraten) |
796,154 |
|
13.3 |
|
6 |
|
|
Socialist Party (Flanders) (Socialistische Partij) |
792,941 |
|
13.2 |
|
6 |
|
|
Socialist Party (Wallonia) (Parti Socialiste) |
764,610 |
|
12.8 |
|
5 |
|
|
Liberal Reformist Party–Democratic Front of Francophones (PRL–FDF) |
672,798 |
|
11.2 |
|
5 |
|
|
Flemish Block (Vlaams Blok) |
463,896 |
|
7.7 |
|
3 |
|
|
Christian Social Party (Parti Social Chrétien) |
434,492 |
|
7.3 |
|
3 |
|
|
People's Union (Volksunie) |
318,453 |
|
5.3 |
|
2 |
|
|
Ecolo |
258,635 |
|
4.3 |
|
2 |
|
|
Agalev |
223,355 |
|
3.7 |
|
1 |
|
|
Other |
257,335 |
— |
4.3 |
— |
— |
— |
|
Total (turnout 91.1%) |
5,992,325 |
|
100 |
|
40 |
|
| Source: IBZ. |