West Nova
West Nova Nova Scotia electoral district Nova Scotia electoral district |
|---|
|
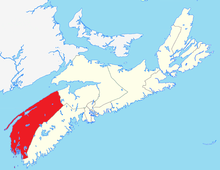
West Nova in relation to the other Nova Scotia federal electoral districts |
| Federal electoral district |
|---|
| Legislature |
House of Commons |
|---|
| MP |
Colin Fraser
Liberal |
|---|
| District created |
1966 |
|---|
| First contested |
1968 |
|---|
| Last contested |
2015 |
|---|
| District webpage |
profile, map |
|---|
| Demographics |
|---|
| Population (2011)[1] |
83,654 |
|---|
| Electors (2015) |
66,796 |
|---|
| Area (km²)[1] |
9,965 |
|---|
| Pop. density (per km²) |
8.4 |
|---|
| Census divisions |
Annapolis, Digby, Kings, Yarmouth |
|---|
| Census subdivisions |
Annapolis Royal, Berwick, Bridgetown, Digby, Middleton, Yarmouth |
|---|
West Nova (French: Nova-Ouest) is a federal electoral district in Nova Scotia, Canada, that has been represented in the House of Commons of Canada since 1968.
South Western Nova and South West Nova were ridings that covered roughly the same geographic area and were represented in the House of Commons from 1968 to 1979 and 1979 to 1997, respectively.
The district is rural with a few small towns and communities located along the coast. The riding has been called a microcosm of rural Canada because it includes fishing, farming, tourism, small business and an English-French mix.[2] The riding is noted as having the highest Baptist proportion in Canada at 28%.[3]
The riding tends to have socially conservative views. In the 1990s, Harry Verran was able to win the district as a Liberal in part because of his socially conservative views, including campaigning against same-sex marriage.[4]
History
The electoral district was created in 1966 from Digby—Annapolis—Kings and Shelburne—Yarmouth—Clare ridings. In 1996, Seal Island was added and the name was changed from South West Nova to West Nova. In 2004, 20 percent of Kings—Hants was added to the district. The boundaries of this riding will remain unchanged as per the 2012 federal electoral redistribution.
Demographics
| Historical population |
|---|
| Year | Pop. | ±% |
|---|
| 2001 | 88,257 | — |
|---|
| 2006 | 86,393 | −2.1% |
|---|
| 2011 | 83,654 | −3.2% |
|---|
From the 2006 census [5]
Ethnic groups:
Languages:
Religions:
Education:
- No certificate, diploma or degree: 35.4%
- High school certificate: 20.5%
- Apprenticeship or trade certificate or diploma: 13.6%
- Community college, CEGEP or other non-university certificate or diploma: 18.4%
- University certificate or diploma: 12.1%
Income:
- Per capita income: $19,450
- Median household income: $40,290
- Median family income: $48,969
- Average house value: $133,217
Median Age:
Unemployment:
Geography
It reaches from Berwick in Kings County (it only includes the western part of Kings County) down through Annapolis County, Digby County and Yarmouth County, ending at the Yarmouth-Shelburne border.
Members of Parliament
This riding has elected the following Members of Parliament:
Election results
West Nova, 2013 Representation Order
West Nova, 2003 Representation Order
| Canadian federal election, 2011 |
| Party |
Candidate |
Votes | % | ∆% | Expenditures |
|
Conservative | Greg Kerr | 20,204 | 47.04 | +7.10 | $82,563.21 |
|
Liberal | Robert Thibault | 15,632 | 36.39 | +0.24 | $62,177.30 |
|
New Democratic | George Barron | 5,631 | 13.11 | -3.78 | $12,244.90 |
|
Green | Ross Johnson | 1,487 | 3.46 | -1.55 | none listed |
| Total valid votes/Expense limit |
42,954 | 100.0 | | $86,810.95 |
| Total rejected, unmarked and declined ballots |
356 | 0.82 | +0.10 |
| Turnout |
43,310 | 63.75 | +1.27 |
| Eligible voters |
67,938 |
|
Conservative hold |
Swing |
+3.43
|
| Sources:[8][9] |
| Canadian federal election, 2008 |
| Party |
Candidate |
Votes | % | ∆% | Expenditures |
|
Conservative | Greg Kerr | 16,779 | 39.94 | +1.83 | $69,467.56 |
|
Liberal | Robert Thibault | 15,185 | 36.15 | -3.09 | $57,096.02 |
|
New Democratic | George Barron | 7,097 | 16.89 | -1.95 | $12,741.38 |
|
Green | Ronald Mills | 2,106 | 5.01 | +2.71 | $123.04 |
|
Independent | Cindy M. Nesbitt | 844 | 2.01 | – | $10,570.22 |
| Total valid votes/Expense limit |
42,011 | 100.0 | | $83,932 |
| Total rejected, unmarked and declined ballots |
304 | 0.72 | +0.12 |
| Turnout |
42,315 | 62.48 | -1.20 |
| Eligible voters |
67,722 |
|
Conservative gain from Liberal |
Swing |
+2.46
|
| Canadian federal election, 2006 |
| Party |
Candidate |
Votes | % | ∆% | Expenditures |
|
Liberal | Robert Thibault | 17,734 | 39.24 | -3.42 | $53,606.19 |
|
Conservative | Greg Kerr | 17,222 | 38.11 | +5.06 | $54,945.96 |
|
New Democratic | Arthur Bull | 8,512 | 18.84 | -2.29 | $25,148.83 |
|
Green | Matthew Granger | 1,040 | 2.30 | -0.92 | $74.10 |
|
Independent | Ken Griffiths | 681 | 1.51 | – | $2,576.48 |
| Total valid votes/Expense limit |
45,190 | 100.0 | | $79,451 |
| Total rejected, unmarked and declined ballots |
274 | 0.60 | -0.21 |
| Turnout |
45,464 | 63.68 | -2.26 |
| Eligible voters |
71,393 |
|
Liberal hold |
Swing |
-4.24
|
| Canadian federal election, 2004 |
| Party |
Candidate |
Votes | % | ∆% | Expenditures |
|
Liberal | Robert Thibault | 18,343 | 42.66 | +8.06 | $48,703.53 |
|
Conservative | Jon Charles Carey | 14,209 | 33.05 | -20.44 | $70,393.83 |
|
New Democratic | Arthur Bull | 9,086 | 21.13 | +9.67 | $24,310.23 |
|
Green | Matthew Granger | 1,385 | 3.22 | – | none listed |
| Total valid votes/Expense limit |
42,996 | 100.0 | | $76,207 |
| Total rejected, unmarked and declined ballots |
352 | 0.81 |
| Turnout |
43,348 | 65.94 | +1.04 |
| Eligible voters |
65,736 |
|
Liberal notional gain from Progressive Conservative |
Swing |
+14.25 |
| Changes from 2000 are based on redistributed results. Change for the Conservative Party is based on the combined totals of the Progressive Conservative Party and the Canadian Alliance. |
West Nova, 1996 Representation Order
| Canadian federal election, 2000 |
| Party |
Candidate |
Votes | % | ∆% | Expenditures |
|
Liberal | Robert Thibault | 12,783 | 36.09 | +10.39 | $57,653 |
|
Progressive Conservative | Mark Muise | 12,080 | 34.11 | -0.20 | $34,692 |
|
Alliance | Mike Donaldson | 6,581 | 18.58 | -0.23 | $32,417 |
|
New Democratic | Phil Roberts | 3,976 | 11.23 | -9.23 | $14,118 |
| Total valid votes |
35,420 | 100.00 |
Results for the Canadian Alliance from 1997 are based on the results of its predecessor, the Reform Party.
| Canadian federal election, 1997 |
| Party |
Candidate |
Votes | % | ∆% | Expenditures |
|
Progressive Conservative | Mark Muise | 13,187 | 34.31 | +11.64 | $37,592 |
|
Liberal | Harry Verran | 9,877 | 25.70 | -29.19 | $47,082 |
|
New Democratic | Brian Noble | 7,862 | 20.46 | +14.87 | $4,426 |
|
Reform | Betty Cox | 7,229 | 18.81 | +3.66 | $25,210 |
|
Natural Law | Neeraj Lakhanpal | 275 | 0.72 | -0.98 | $0.00 |
| Total valid votes |
38,430 | 100.00 |
South West Nova
South Western Nova
See also
References
Notes