Malpeque (electoral district)
Malpeque Prince Edward Island electoral district Prince Edward Island electoral district |
|---|
|
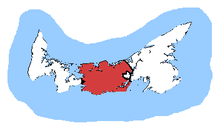
Malpeque in relation to the other Prince Edward Island ridings |
| Federal electoral district |
|---|
| Legislature |
House of Commons |
|---|
| MP |
Wayne Easter
Liberal |
|---|
| District created |
1966 |
|---|
| First contested |
1968 |
|---|
| Last contested |
2015 |
|---|
| District webpage |
profile, map |
|---|
| Demographics |
|---|
| Population (2011)[1] |
35,039 |
|---|
| Electors (2015) |
28,556 |
|---|
| Area (km²)[1] |
1,663 |
|---|
| Pop. density (per km²) |
21.1 |
|---|
| Census divisions |
Prince, Queens |
|---|
| Census subdivisions |
Towns:
Borden-Carleton
Cornwall
Kensington
Villages:
Bedeque, Brackley, Breadalbane, Central Bedeque, Clyde River, Crapaud, DeSable, Hunter River, Kinkora, Meadowbank, Miltonvale Park, Stanley Bridge, Hope River, Bayview, Cavendish and North Rustico, Union Road, Victoria, Warren Grove, Winsloe Park
First Nations reserves:
Rocky Point 3
Lots:
Lot 18, 19, 20, 21, 22, 23, 24, 25, 26, 27, 28, 29, 30, 31, 33, 34, 65, 67 |
|---|
Malpeque is a federal electoral district in Prince Edward Island, Canada, that has been represented in the Canadian House of Commons since 1968. Its population in 2011 was 35,039.
Demographics
- Ethnic groups: 98.8% White
- Languages: 95.7% English, 2.5% French, 1.4% Other
- Religions: 53.2% Protestant, 36.4% Catholic, 2.9% Other Christian, 7.3% no affiliation
- Average income: $24,005
Geography
The district includes the extreme eastern part of Prince County and most of Queens County except the extreme eastern portion and the City of Charlottetown. Communities include Cornwall, Kensington, Miltonvale Park, Borden-Carleton, North Rustico and Clyde River. The area is 1,663 km2.
History
The electoral district was created in 1966 from parts of Prince and Queen's ridings. There will be no boundary changes as a result of the 2012 federal electoral redistribution.
Members of Parliament
This riding has elected the following Members of Parliament:
Election results
Malpeque, 2013 Representation Order
Malpeque, 2003 Representation Order
| Canadian federal election, 2011 |
| Party |
Candidate |
Votes | % | ∆% | Expenditures |
|
Liberal | Wayne Easter | 8,605 | 42.40 | -1.79 | $47,363.15 |
|
Conservative | Tim Ogilvie | 7,934 | 39.10 | -0.18 | $62.426.68 |
|
New Democratic | Rita Jackson | 2,970 | 14.63 | +4.96 | $5,426.11 |
|
Green | Peter Bevan-Baker | 785 | 3.87 | -2.99 | $1,367.33 |
| Total valid votes/Expense limit |
20,294 | 100.0 | | $69,634.73 |
| Total rejected, unmarked and declined ballots |
90 | 0.44 | -0.16 |
| Turnout |
20,384 | 77.47 | +6.06 |
| Eligible voters |
26,311 |
|
Liberal hold |
Swing |
-0.80
|
| Sources:[4][5] |
| Canadian federal election, 2008 |
| Party |
Candidate |
Votes | % | ∆% | Expenditures |
|
Liberal | Wayne Easter | 8,312 | 44.19 | -6.29 | $51,835.54 |
|
Conservative | Mary Crane | 7,388 | 39.28 | +4.65 | $56,705.00 |
|
New Democratic | J'Nan Brown | 1,819 | 9.67 | -0.57 | $5,225.01 |
|
Green | Peter Bevan-Baker | 1,291 | 6.86 | +2.21 | $3,626.22 |
| Total valid votes/Expense limit |
18,810 | 100.0 | | $67,177 |
| Total rejected, unmarked and declined ballots |
113 | 0.60 | +0.01 |
| Turnout |
18,923 | 71.41 | -3.69 |
| Eligible voters |
26,498 |
|
Liberal hold |
Swing |
-5.47
|
| Canadian federal election, 2006 |
| Party |
Candidate |
Votes | % | ∆% | Expenditures |
|
Liberal | Wayne Easter | 9,779 | 50.48 | -1.42 | $51,121.23 |
|
Conservative | George Noble | 6,708 | 34.63 | +2.13 | $52,989.45 |
|
New Democratic | George Marshall | 1,983 | 10.24 | +0.15 | $3,388.31 |
|
Green | Sharon Labchuk | 901 | 4.65 | -0.85 | $2,925.11 |
| Total valid votes/Expense limit |
19,371 | 100.0 | | $62,210 |
| Total rejected, unmarked and declined ballots |
114 | 0.59 | -0.17 |
| Turnout |
19,485 | 75.10 | +2.09 |
| Eligible voters |
25,945 |
|
Liberal hold |
Swing |
-1.78
|
| Canadian federal election, 2004 |
| Party |
Candidate |
Votes | % | ∆% | Expenditures |
|
Liberal | Wayne Easter | 9,782 | 51.90 | +3.28 | $49,256.92 |
|
Conservative | Mary Crane | 6,126 | 32.50 | -13.28 | $52,127.38 |
|
New Democratic | Ken Bingham | 1,902 | 10.09 | +5.86 | $3,055.96 |
|
Green | Sharon Labchuk | 1,037 | 5.50 | +4.15 | $2,989.44 |
| Total valid votes/Expense limit |
18,847 | 100.0 | | $60,645 |
| Total rejected, unmarked and declined ballots |
144 | 0.76 |
| Turnout |
18,991 | 73.01 |
| Eligible voters |
26,010 |
|
Liberal hold |
Swing |
+8.28
|
| Change for the Conservatives is from the combined totals of the Progressive Conservatives and the Canadian Alliance. |
Previous elections
Changes for the Canadian Alliance from 1997 are based on the results of its predecessor, the Reform Party.
Student Vote results
2011 election
In 2011, a Student Vote was conducted at participating Canadian schools to parallel the 2011 Canadian federal election results. The vote was designed to educate students and simulate the electoral process for persons who have not yet reached the legal majority. Schools with a large student body that reside in another electoral district had the option to vote for candidates outside of the electoral district then where they were physically located.[6]
See also
References
Notes
External links