United States presidential election in Oregon, 2012
United States presidential election in Oregon, 2012
|
|
|
|
|
|
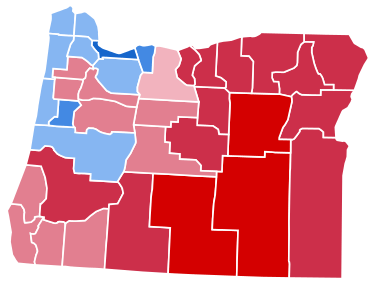
County Results
|
Obama—50-60%
Obama—60-70%
Obama—70-80%
|
Romney—40-50%
Romney—50-60%
Romney—60-70%
Romney—70-80%
|
|
|
|
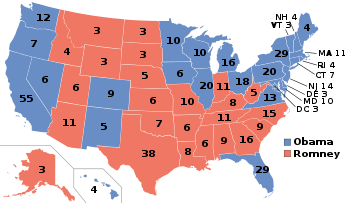
The 2012 United States presidential election in Oregon took place on November 6, 2012, as part of the 2012 General Election in which all 50 states plus The District of Columbia participated. Oregon voters chose seven electors to represent them in the Electoral College via a popular vote pitting incumbent Democratic President Barack Obama and his running mate, Vice President Joe Biden, against Republican challenger and former Massachusetts Governor Mitt Romney and his running mate, Congressman Paul Ryan.
On election day, Obama carried Oregon with 54.24% of the vote to Romney's 42.15%, a Democratic victory margin of 12.09%. The Democrats have won the state in every presidential election since 1988.
General election
Democratic primary
The Democratic primary was held on May 15, 2012. Barack Obama was unopposed for the nomination.
Republican primary
Oregon Republican primary, 2012
|
| May 15, 2012 (2012-05-15) |
|
|
|

|
| Oregon results by county
Mitt Romney
(Note: Italicization indicates a withdrawn candidacy) |
|
The Republican primary occurred on May 15, 2012.[3][4] Rick Santorum and Newt Gingrich had withdrawn prior to the election, but their names still appeared on the Oregon ballot.
In order to participate in the primary, voters were required to register to vote by April 24, 2012.[5] A closed primary was used to elect the presidential, legislative, and local partisan offices. A semi-closed primary, which allowed non-affiliated voters to participate, was used to elect the attorney general, secretary of state and treasurer positions.[6]
See also
References
- ↑ "Official Results November 6, 2012 General Election" (PDF). Oregon Secretary of State. Retrieved September 19, 2016.
- 1 2 "May 15, 2012, Primary Election Abstracts of Votes: United States President" (PDF). Oregon Elections Division. Retrieved December 5, 2012.
- ↑ "Primary and Caucus Printable Calendar". CNN. Retrieved January 12, 2012.
- ↑ "Presidential Primary Dates" (PDF). Federal Election Commission. Retrieved January 23, 2012.
- ↑ Mickler, Lauren (March 6, 2012). "Oregon Primary Two Months Away". Eugene, OR: KEZI 9 News.
- ↑ Mapes, Jeff (February 6, 2012). "Oregon Republican Party opens three statewide primaries to non-affiliated voters". The Oregonian.
External links
|
|---|
|
| Election timelines | |
|---|
|
| National polling | |
|---|
|
| State polling | |
|---|
|
| Fundraising | |
|---|
|
| Debates and forums | |
|---|
|
| Straw polls | |
|---|
|
| Major events | |
|---|
|
Caucuses
and primaries | | |
|---|
| | |
|---|
| Libertarian Party | |
|---|
| Green Party | |
|---|
| Constitution Party | |
|---|
|
|---|
|
| Results breakdown | |
|---|
|
National
conventions | |
|---|
|
| Reforms | |
|---|