Statewide opinion polling for the Democratic Party presidential primaries, 2008
2008 U.S. Presidential Election |
|---|
|
| Democratic Party |
| Republican Party |
| Minor parties |
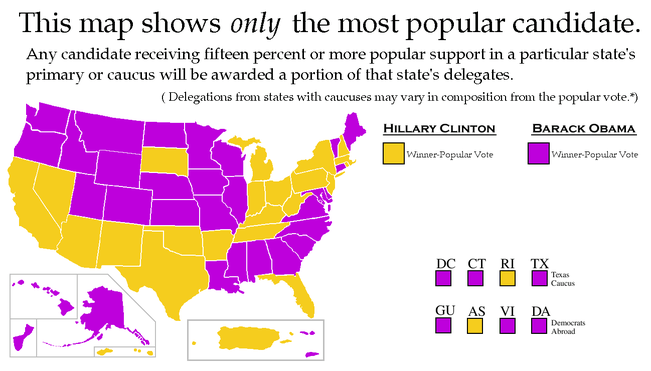
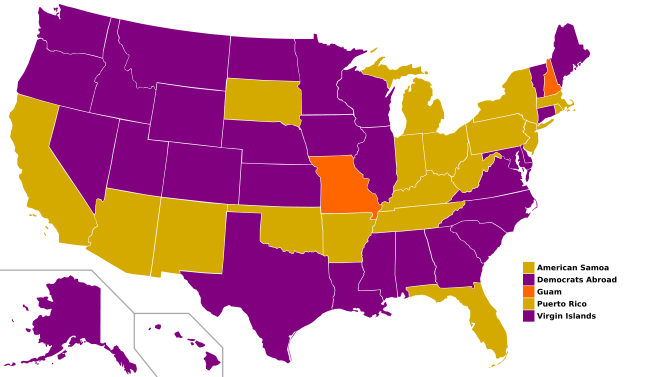
This article is a collection of statewide public opinion polls that have been conducted relating to the Democratic presidential primaries, 2008. A graphic summary of the data in map form follows. For state and territory names abbreviated in the maps in this article, see: List of US postal abbreviations.
Polling
Poll summary and current pledged delegate count
Delegate table and polling data
The following table shows a summary of the most recent polling data for each state, as well as completed primary and caucus results. Totals for withdrawn candidates have been placed in the "Uncommitted/Other" and "Other" columns. The pledged delegate vote estimates come from each state's primary or caucus article. Click on the specific election (link) column to see the sources used in those articles.
| Date | State | Delegates | Hillary Clinton | Barack Obama | Uncommitted/ other |
Hillary Clinton | Barack Obama | Other |
|---|---|---|---|---|---|---|---|---|
| 2008-01-03 | Iowa | 45 | 29% | 38% | 33% | 14 | 24 | 7 |
| 2008-01-08 | New Hampshire | 22 | 39% | 36% | 24% | 9 | 9 | 4 |
| 2008-01-15 | Michigan1 | 128 | 55% | -† | 45% | 73 | 55 | 0 |
| 2008-01-19 | Nevada | 25 | 51% | 45% | 4% | 11 | 14 | 0 |
| 2008-01-26 | South Carolina | 45 | 27% | 55% | 18% | 12 | 25 | 8 |
| 2008-01-29 | Florida1 | 185 | 50% | 33% | 17% | 105 | 67 | 13 |
| 2008-02-05 | Alabama | 52 | 42% | 56% | 2% | 25 | 27 | 0 |
| 2008-02-05 | Alaska | 13 | 25% | 75% | 0% | 4 | 9 | 0 |
| 2008-02-05 | American Samoa | 3 | 57% | 43% | 0% | 2 | 1 | 0 |
| 2008-02-05 | Arizona | 56 | 51% | 42% | 7% | 31 | 25 | 0 |
| 2008-02-05 | Arkansas | 35 | 70% | 27% | 3% | 27 | 8 | 0 |
| 2008-02-05 | California | 370 | 52% | 43% | 6% | 204 | 166 | 0 |
| 2008-02-05 | Colorado | 55 | 32% | 67% | 1% | 20 | 35 | 0 |
| 2008-02-05 | Connecticut | 48 | 47% | 51% | 2% | 22 | 26 | 0 |
| 2008-02-05 | Delaware | 15 | 43% | 53% | 4% | 6 | 9 | 0 |
| 2008-02-05 | Georgia | 87 | 31% | 67% | 2% | 27 | 60 | 0 |
| 2008-02-05 | Idaho | 18 | 17% | 79% | 1% | 3 | 15 | 0 |
| 2008-02-05 | Illinois | 153 | 33% | 65% | 2% | 49 | 104 | 0 |
| 2008-02-05 | Kansas | 32 | 26% | 74% | 0% | 9 | 23 | 0 |
| 2008-02-05 | Massachusetts | 93 | 56% | 41% | 3% | 55 | 38 | 0 |
| 2008-02-05 | Minnesota | 72 | 32% | 67% | 1% | 24 | 48 | 0 |
| 2008-02-05 | Missouri | 72 | 48% | 49% | 3% | 36 | 36 | 0 |
| 2008-02-05 | New Jersey | 107 | 54% | 44% | 2% | 59 | 48 | 0 |
| 2008-02-05 | New Mexico | 26 | 49% | 48% | 3% | 14 | 12 | 0 |
| 2008-02-05 | New York | 232 | 57% | 40% | 3% | 139 | 93 | 0 |
| 2008-02-05 | North Dakota | 13 | 37% | 61% | 2% | 5 | 8 | 0 |
| 2008-02-05 | Oklahoma | 38 | 55% | 31% | 14% | 24 | 14 | 0 |
| 2008-02-05 | Tennessee | 68 | 54% | 41% | 5% | 40 | 28 | 0 |
| 2008-02-05 | Utah | 23 | 39% | 57% | 4% | 9 | 14 | 0 |
| 2008-02-09 | Louisiana | 56 | 36% | 57% | 7% | 22 | 34 | 0 |
| 2008-02-09 | Nebraska | 24 | 32% | 68% | 0% | 8 | 16 | 0 |
| 2008-02-09 | U.S. Virgin Islands | 3 | 8% | 92% | 0% | 0 | 3 | 0 |
| 2008-02-09 | Washington caucus | 78 | 31% | 68% | 1% | 26 | 52 | 0 |
| 2008-02-10 | Maine | 24 | 40% | 59% | 1% | 9 | 15 | 0 |
| 2008-02-12 | Democrats Abroad | 7 | 33% | 66% | 1% | 2.5 | 4.5 | 0 |
| 2008-02-12 | District of Columbia | 15 | 24% | 75% | 1% | 3 | 12 | 0 |
| 2008-02-12 | Maryland | 70 | 36% | 61% | 3% | 28 | 42 | 0 |
| 2008-02-12 | Virginia | 83 | 35% | 64% | 1% | 29 | 54 | 0 |
| 2008-02-19 | Hawaii | 20 | 24% | 76% | 0% | 6 | 14 | 0 |
| 2008-02-19 | Wisconsin | 74 | 41% | 58% | 1% | 32 | 42 | 0 |
| 2008-03-04 | Ohio | 141 | 54% | 44% | 2% | 75 | 66 | 0 |
| 2008-03-04 | Rhode Island | 21 | 58% | 40% | 2% | 13 | 8 | 0 |
| 2008-03-04 | Texas primary | 126 | 51% | 47% | 2% | 65 | 61 | 0 |
| 2008-03-04 | Texas caucus | 67 | 44% | 56% | 0% | 30 | 37 | 0 |
| 2008-03-04 | Vermont | 15 | 39% | 59% | 2% | 6 | 9 | 0 |
| 2008-03-08 | Wyoming | 12 | 38% | 61% | 1% | 5 | 7 | 0 |
| 2008-03-11 | Mississippi | 33 | 37% | 61% | 2% | 14 | 19 | 0 |
| 2008-04-22 | Pennsylvania | 158 | 55% | 45% | 0% | 85 | 73 | 0 |
| 2008-05-03 | Guam | 4 | 50% | 50% | 0% | 2 | 2 | 0 |
| 2008-05-06 | Indiana | 72 | 51% | 49% | 0% | 39 | 33 | 0 |
| 2008-05-06 | North Carolina | 115 | 42% | 56% | 2% | 50 | 65 | 0 |
| 2008-05-13 | West Virginia | 28 | 67% | 26% | 7% | 20 | 8 | 0 |
| 2008-05-20 | Kentucky | 51 | 65% | 30% | 5% | 37 | 14 | 0 |
| 2008-05-20 | Oregon | 52 | 41% | 58% | 1% | 21 | 31 | 0 |
| 2008-06-01 | Puerto Rico | 55 | 68% | 32% | 1% | 38 | 17 | 0 |
| 2008-06-03 | Montana | 16 | 41% | 56% | 3% | 7 | 9 | |
| 2008-06-03 | South Dakota | 15 | 55% | 45% | 0% | 9 | 6 | |
| Total | 3,545 | 1,744.5 | 1,787.5 | 32 | ||||
† Barack Obama was not on the ballot in Michigan.
- On 24 August, the DNC gave Florida and Michigan full voting rights.
See also
External links
| Wikimedia Commons has media related to Statewide opinion polling for the Democratic Party presidential primaries, 2008. |
- 2008 Democratic National Convention Website – FAQ gives map with delegation information.
- Pollster.com Graphs showing various primary and general polls
- USAElectionPolls.com – Primary polling by state
- Select2008 – Live issue-based and policy-based polling